Email sending dashboard. All your sending on one screen.
Are the servers working, how many messages went out and how many arrived, which mailbox providers accept your mail worse than the rest, are domains, proxies and warm-up in order — one look is enough to tell whether everything is fine.
The numbers come from the reports of PowerMTA and MailerQ themselves on your servers, not from your email platform.
Usually this information is scattered across server consoles, DNS panels and MTA reports. The email sending Dashboard brings it together: six numbers at the top answer the main question — “is everything fine?” — and below you see where exactly something is wrong.
All infrastructures · 7 days
01 · Nodes online15 of 15
02 · Sent187,647
03 · Delivery rate97.2%
04 · Not delivered5,339 · 2.8%
A green tile means all is well, a yellow one means there's something to look at
Numbers from the MTA
Not from the platform
The Hub takes every number from the reports of PowerMTA and MailerQ themselves on your servers. The average speed counts only the hours when mail actually went out — a quiet night doesn't drag it down.
MMTA
reports
Messages per hour1,158.3
peak 2,499over 162 sending hours
A silent server
Not in the totals
If a server stops responding, the Hub doesn't pass off its old numbers as fresh: such a server is left out of the totals, and the Dashboard says plainly that nothing is known about it.
HMTA-Hub
connection
Nodes online15 of 15
MTA on 15three checks in a row
02 / To-do list
A to-do list: what to fix in your infrastructure.
The Hub puts the to-do list together from its own checks: connection to the servers, domain DNS, reverse DNS of addresses, queues, warm-up, proxy gates, failed jobs. It's not an event feed: a line appears only when something needs to be done, and disappears by itself as soon as the cause is fixed.
Housekeeping · proxies
9 of 9 proxies have no reverse DNS record
FCrDNS doesn't match — major mailbox providers cut such sending.
Housekeeping · DNS
1 of 26 domains has an incomplete set
Without SPF, DKIM and DMARC, a message loses its sender authentication.
Housekeeping · gates
1 of 2 gates is out of service
The service is stopped or its version differs from the others.
A red icon means it's blocking sending now; yellow means it hurts delivery or soon will; gray means it's not urgent. While all items are routine, the block stays collapsed; if something urgent appears, it turns red and opens by itself. Each line has an “Open” button that takes you to the screen where it gets fixed.
03 / Message path
A message's path from the domain to the Proxy Gate.
A message doesn't just go out “from a server” — it travels along a chain: domain, server with an MTA, vMTA, IP address, proxy gate. The block shows the whole chain from left to right, in the order the message passes through it — so you can see at once which link has the least capacity.
Message path · 7 days
01 · Domains26 · DKIM on 25
02 · Nodes with an MTA15 online
03 · vMTA35 in use
04 · Addresses26 · PTR on 26
05 · Gates1 online
The narrowest link here is the proxy gates: one of two is online
Breakdown by provider
Who accepts how well
The overall delivery rate hides the differences. Here you see each mailbox provider: Apple accepts 98.2%, Google 97.5%, Microsoft 96.3%.
GMailbox providers
7 days
LowestMicrosoft · 96.3%
Apple · 98.2%Google · 97.5%
Day by day
Not just one average
The daily chart shows exactly which day the delivery rate dipped. The pale last bar means the day isn't over yet, so an unfinished day doesn't look like a failure.
HMTA-Hub
by day
Delivery rate97.2% for the week
Oct 13–19day still in progress
04 / Bounces, proxies and warm-up
Bounces, proxies and IP warm-up in one summary.
The lower blocks give short answers: which mailbox providers reject mail and why, whether the proxies are fit for use and whether mail gets through them, and whether warm-up is on plan. That's enough to tell whether a problem is general or affects only one provider. The full breakdown of each is in its own section.
HARD · no mailbox
3,773 bounces
The address leaves your list for good.
SOFT · mailbox exists
1,566 bounces
A spam filter or a provider rule.
Deferred
4,724 messages
The provider asks to retry — the message is still in progress.
FBL complaints
23 in 7 days
Recipients clicked “this is spam”.
Proxies
Compared with the fleet
Over 7 days, 37,772 messages went out through proxies and 94.0% arrived — versus 97.2% across the whole fleet. 9 of 9 addresses are fit for mail, but none has a reverse DNS record.
PProxies
7 days
Delivered through proxies94.0%
fleet — 97.2%37,772 messages
Warm-up
Across all plans
Today 2,218 of 2,560 warm-up messages went out; over the week, 17,155, with 99.2% delivered. No mailbox providers need attention: all are growing or holding pace.
HMTA-Hub
warm-up
Today2,218 of 2,560
2 of 5 plans runningdelivery 99.2%
05 / The interface in detail
The sending Dashboard interface — 9 screens.
Six numbers, the to-do list, sending over time, nodes, the message path, domains, proxies, warm-up and bounces. Above each screenshot: why the screen matters. Below it: what it shows.
Now and sending
3 screens
The top of the Dashboard answers the question “is everything fine right now?”. Here are the six summary numbers, the to-do list the Hub puts together itself, and sending by day next to the breakdown by mailbox provider. You choose the period and the infrastructure on the right, above the tiles.
01
Is everything working right now
Six numbers at the top
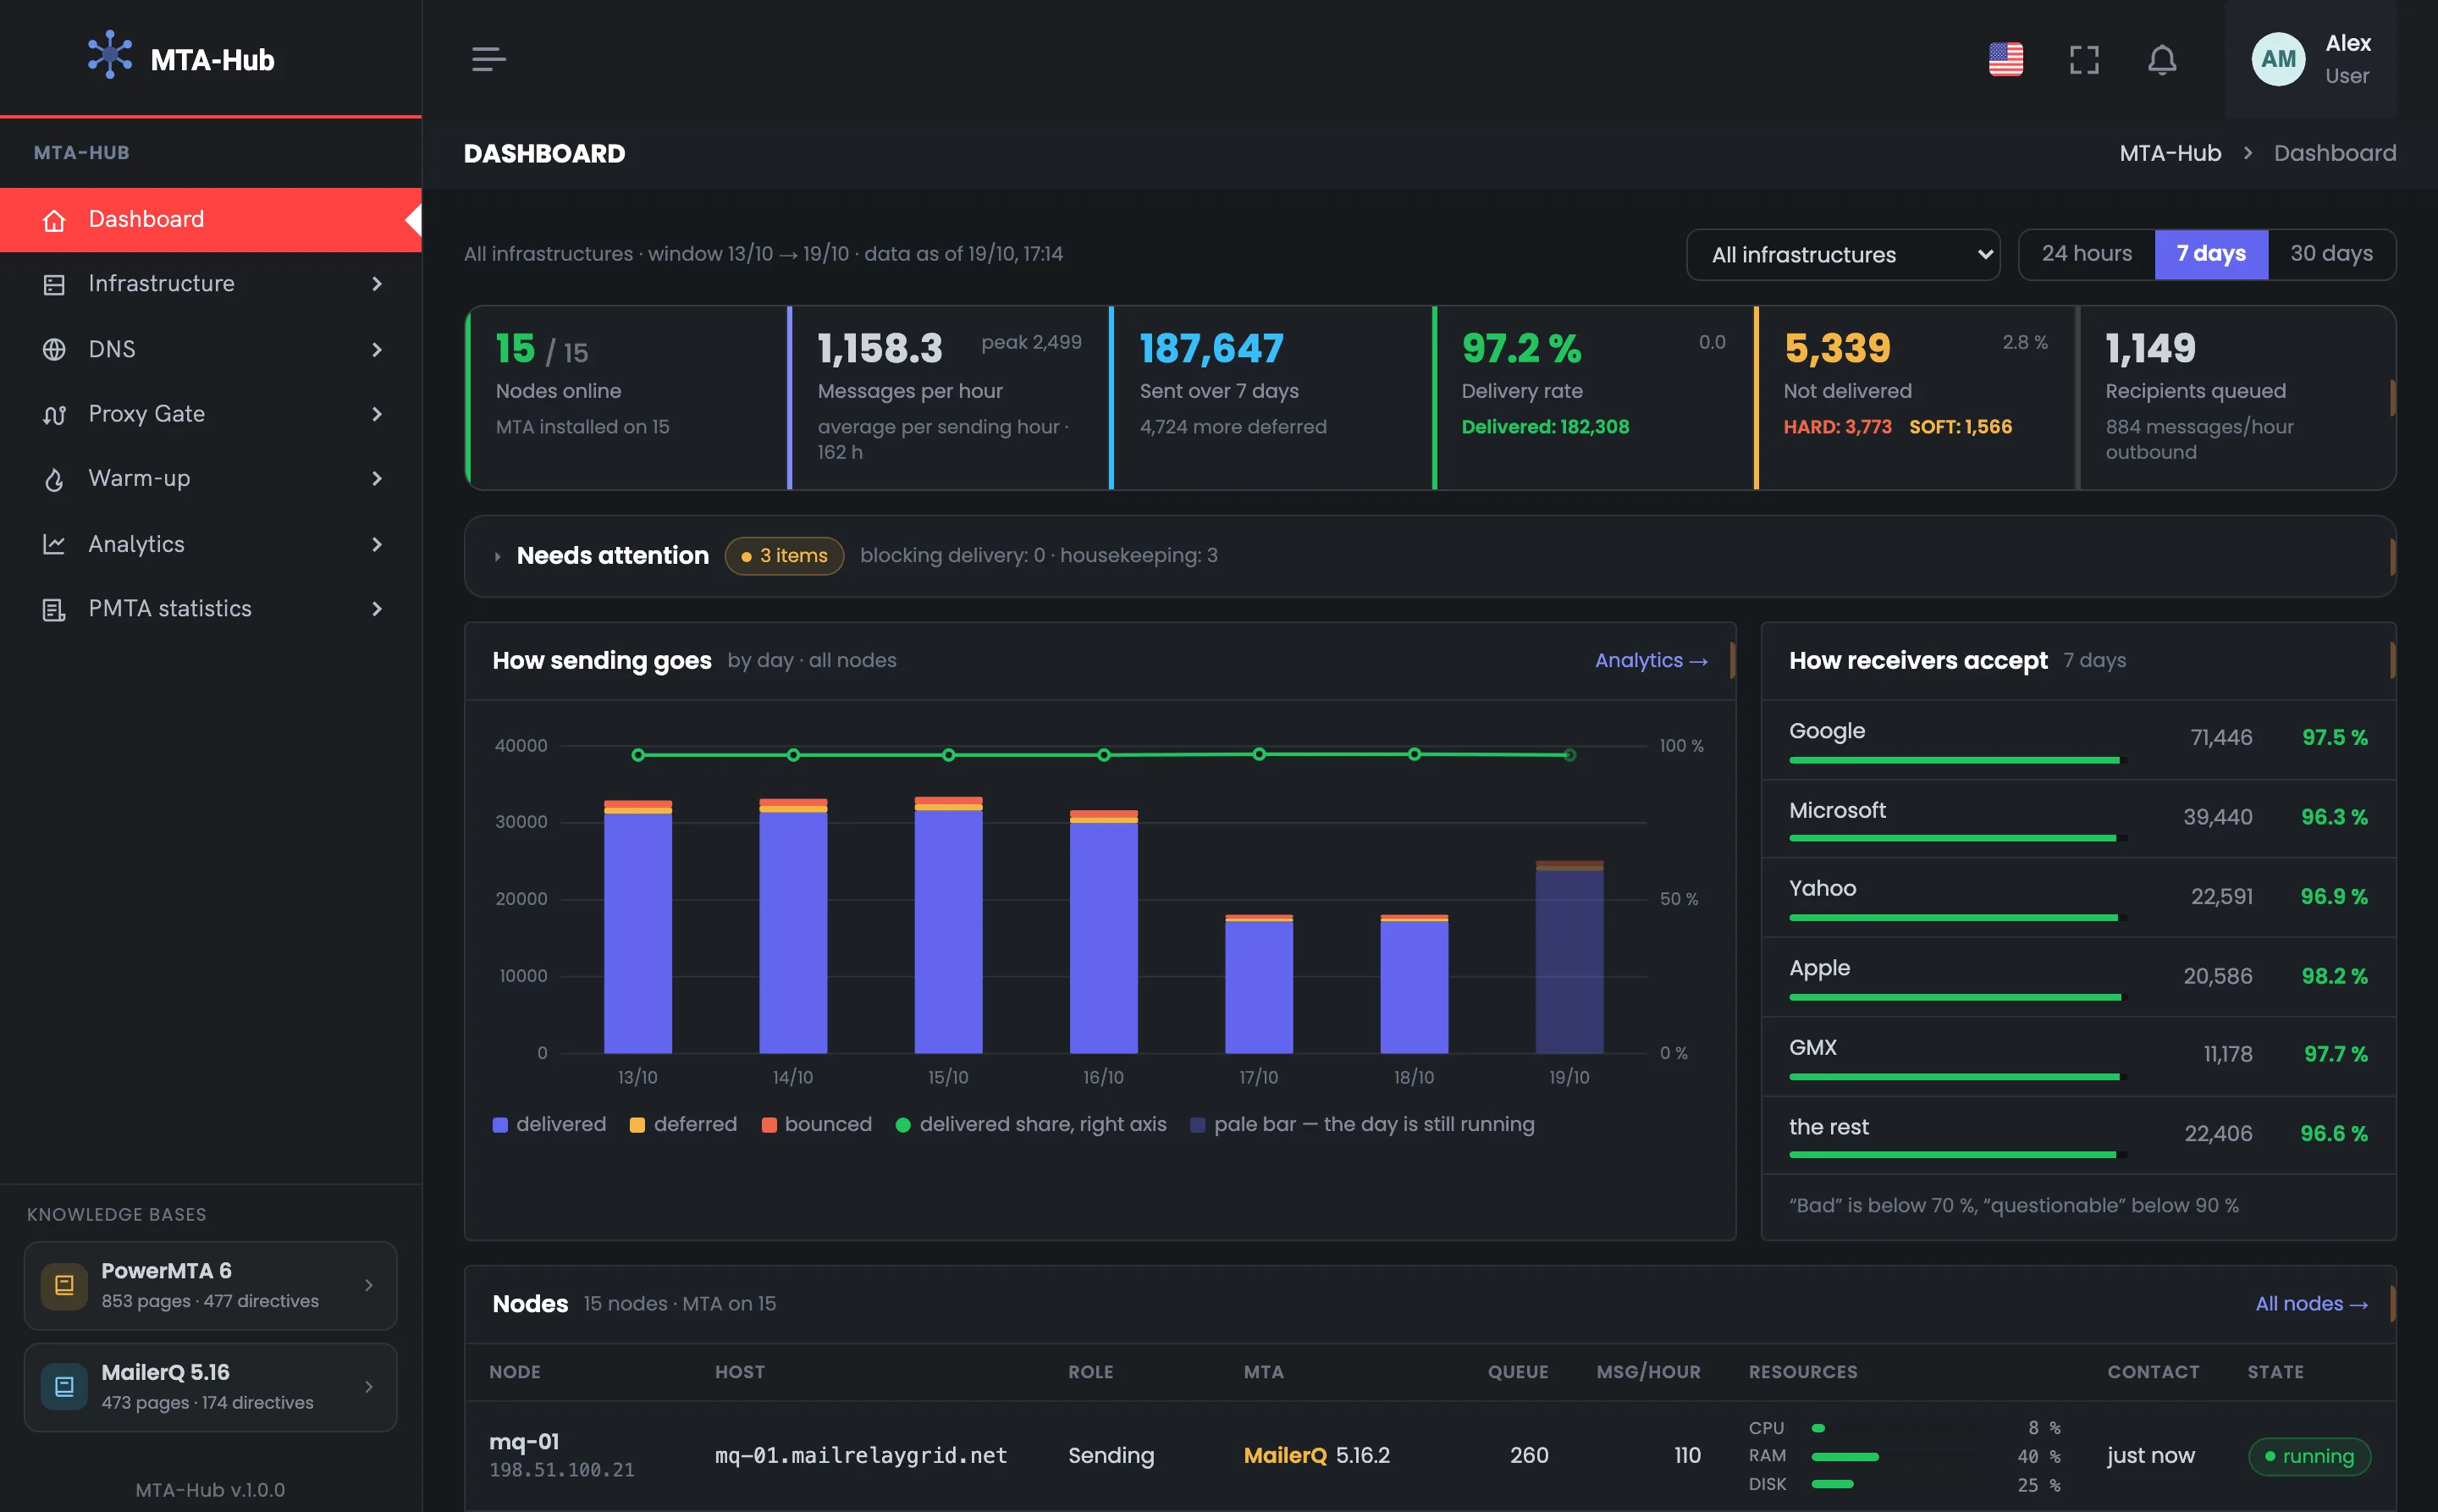
The top row of the Dashboard is a sending summary for the chosen period. The first tile is about the connection to the servers, the other five are about messages: speed, sent, delivery rate, not delivered and the queue. The tile color speaks for itself: green means all is well, yellow means there's something to look at. In the example, over 7 days 15 of 15 nodes are online, 187,647 messages were sent, and the delivery rate is 97.2%. On the right above the tiles you choose the infrastructure and the period. The average speed counts only the hours when mail went out, so a quiet night doesn't drag it down. If a tile turns yellow, look for the cause below: in the to-do list, in sending by provider or in the node table.
EnlargeScreen 01 · Is everything working right now. An example from the MTA-Hub interface.
The line above the tiles — all infrastructures, period Oct 13 → Oct 19, data as of Oct 19, 17:14.
Nodes online — 15 of 15, MTA installed on 15.
Messages per hour — 1,158.3 on average per sending hour, peak 2,499.
Sent in 7 days — 187,647, plus 4,724 deferred.
Delivery rate — 97.2% — 182,308 delivered; in the corner, the change from the previous period.
Not delivered — 5,339 (2.8%): HARD 3,773, SOFT 1,566.
Recipients queued — 1,149, going out at 884 messages an hour.
A server that misses three checks in a row is considered to have lost connection.
02
Needs attention
The Hub's to-do list
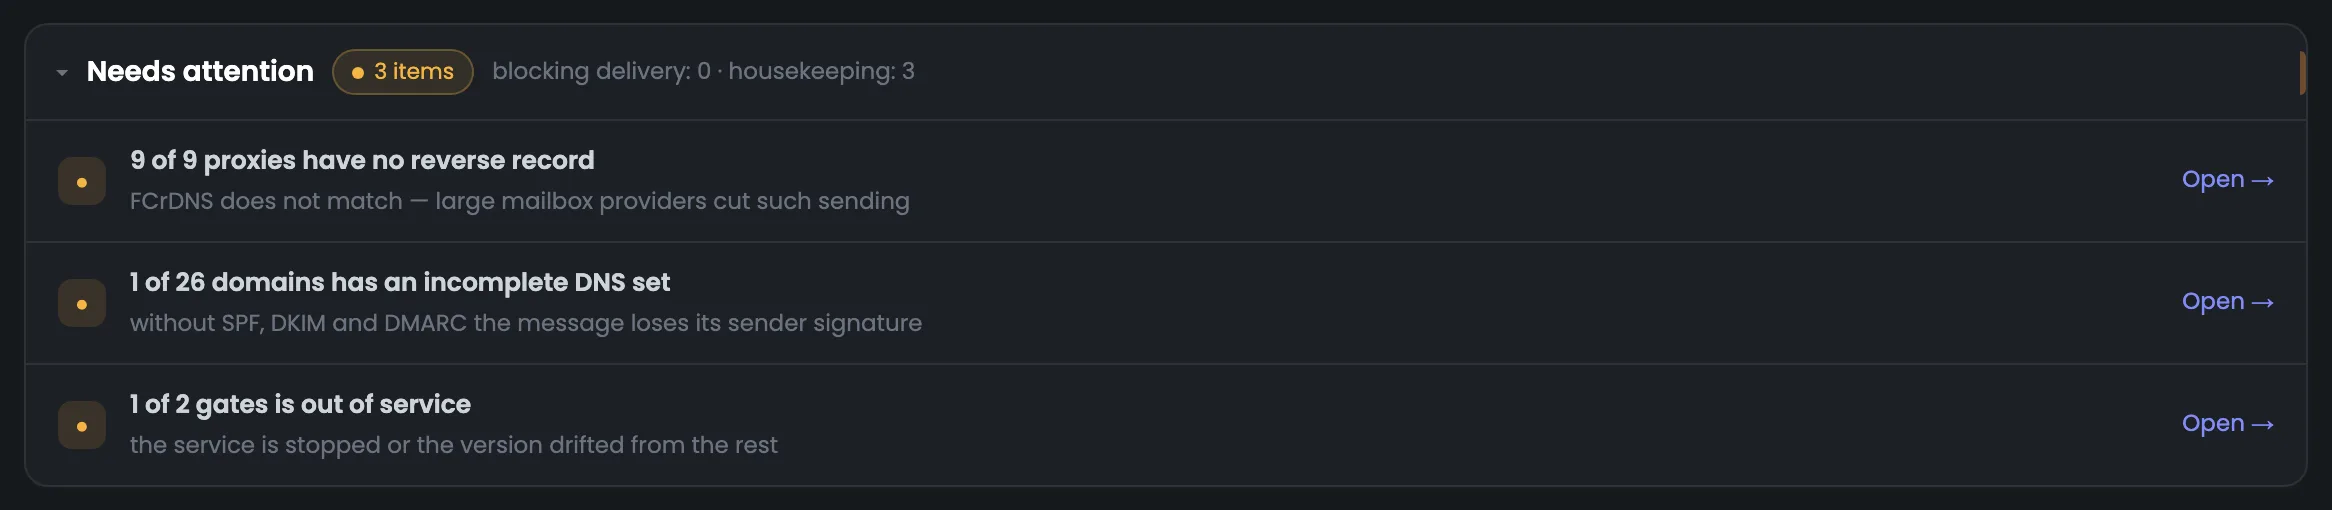
The “Needs attention” block is a to-do list the Hub puts together from its own checks: connection to the servers, DNS, reverse DNS, queues, warm-up, proxy gates. A line appears only when something needs to be done, and disappears as soon as the cause is fixed. In the example there are three housekeeping items and none that block sending: proxies without a reverse DNS record, an incomplete DNS set on one domain, and a gate out of service. The “Open” button takes you to where it gets fixed. The icon on the left shows urgency: red means it's blocking sending now, yellow means it hurts delivery or soon will, gray means it's not urgent. If there's nothing to do, the block isn't on the page at all.
EnlargeScreen 02 · Needs attention. An example from the MTA-Hub interface.
Reverse DNS — missing on 9 of 9 proxies — FCrDNS doesn't match.
DNS — 1 of 26 domains has an incomplete set.
Gates — 1 of 2 gates is out of service.
Open — goes to the screen where it gets fixed.
While all items are routine, the block stays collapsed; if something urgent appears, it turns red and opens by itself. If there's nothing to do, the block isn't there at all.
03
How sending goes and how providers accept
By day and by provider
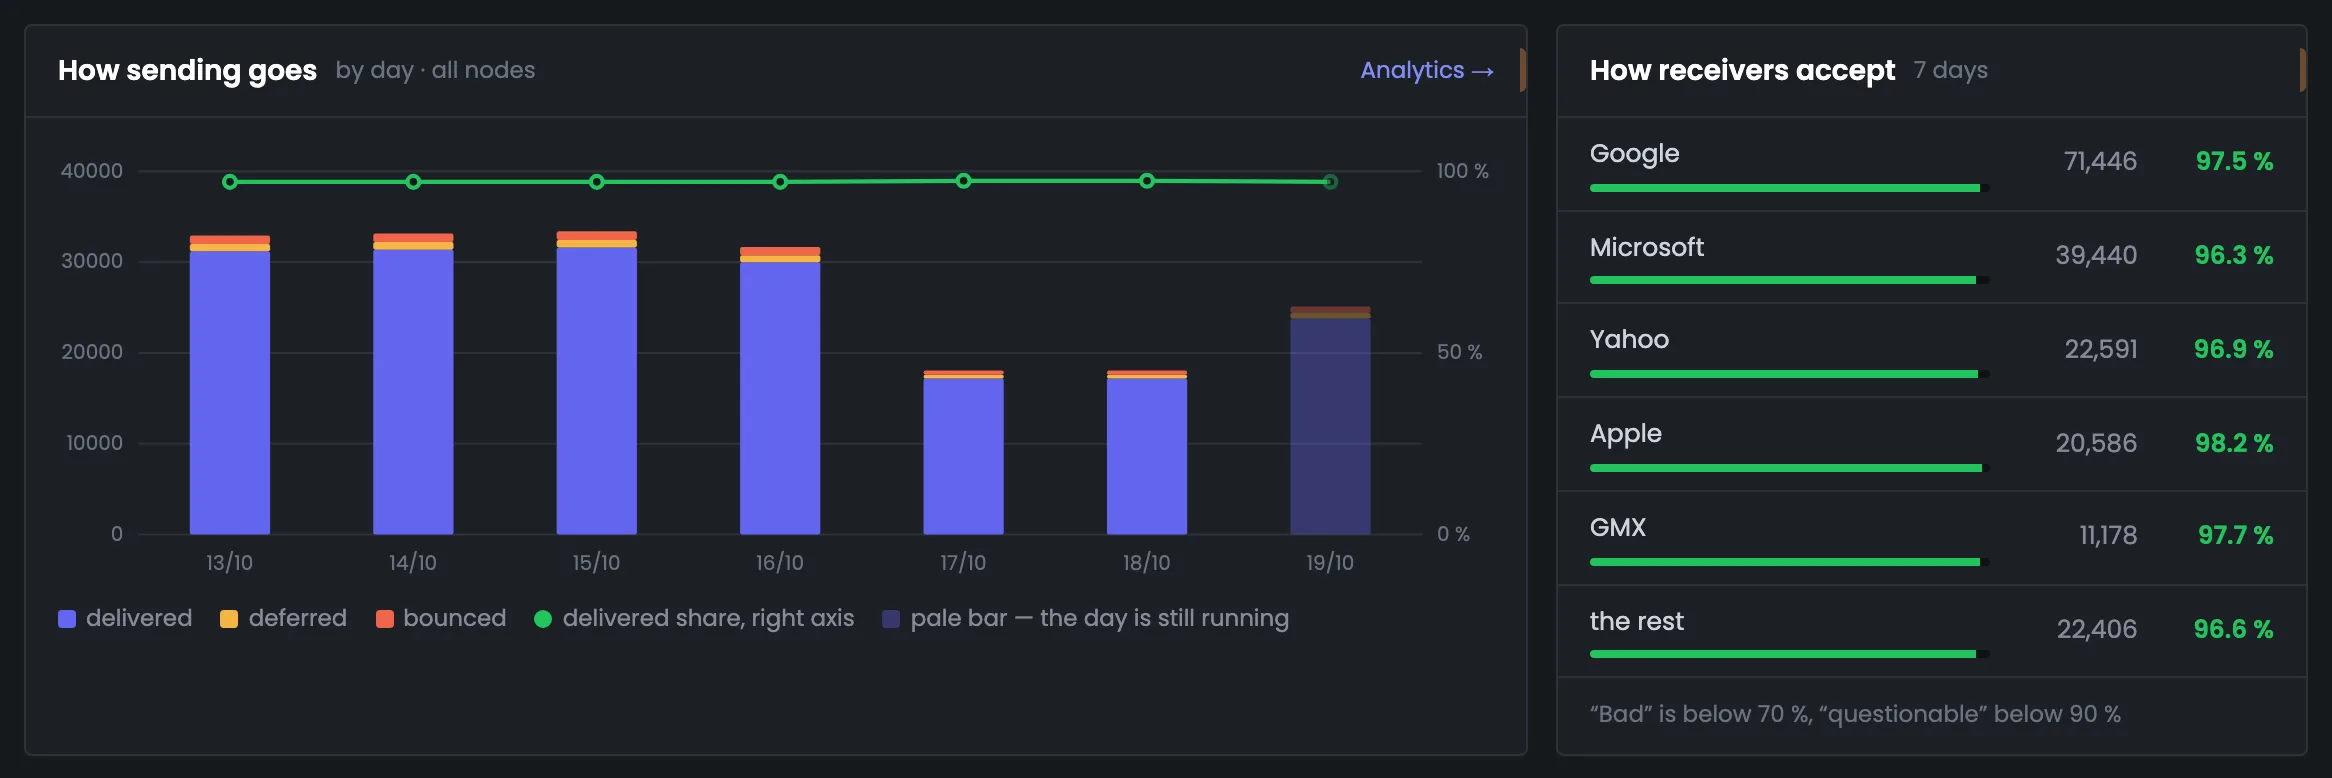
Two cards side by side: on the left, sending by day; on the right, the same messages by the recipients' mailbox providers. The chart shows which day the delivery rate dipped: each bar is split into delivered, deferred and rejected, and the green line is the delivered share. The provider card tells you who accepts worse: in the example, Apple 98.2%, Google 97.5%, Microsoft 96.3%. If one provider is noticeably lower than the rest, investigate it in “Analytics”. A provider here means the company that owns the domains: gmail.com and googlemail.com both count as Google. The five largest are shown by name and the rest are grouped into the last row, so the rows add up to what was sent.
EnlargeScreen 03 · How sending goes and how providers accept. An example from the MTA-Hub interface.
Bar — blue is delivered, yellow is deferred, red is bounced.
Green line — the delivered share, scale on the right.
Pale bar — the day is still in progress.
How providers accept — Google 97.5%, Microsoft 96.3%, Yahoo 96.9%, Apple 98.2%, GMX 97.7%, others 96.6%.
Color — green from 90%, yellow 70–90%, red below 70%.
A provider is the company that owns the domains: gmail.com and googlemail.com are Google. The rows always add up to what was sent over the period.
Servers and the chain
3 screens
Below are the sending servers themselves and everything a message passes through. The node table shows each server's queue and resources, the chain shows a message's path from the domain to the gate, and the domain table shows their DNS and blacklists. This is where you look when the numbers at the top aren't what you expected.
04
Nodes
Servers, queue and resources
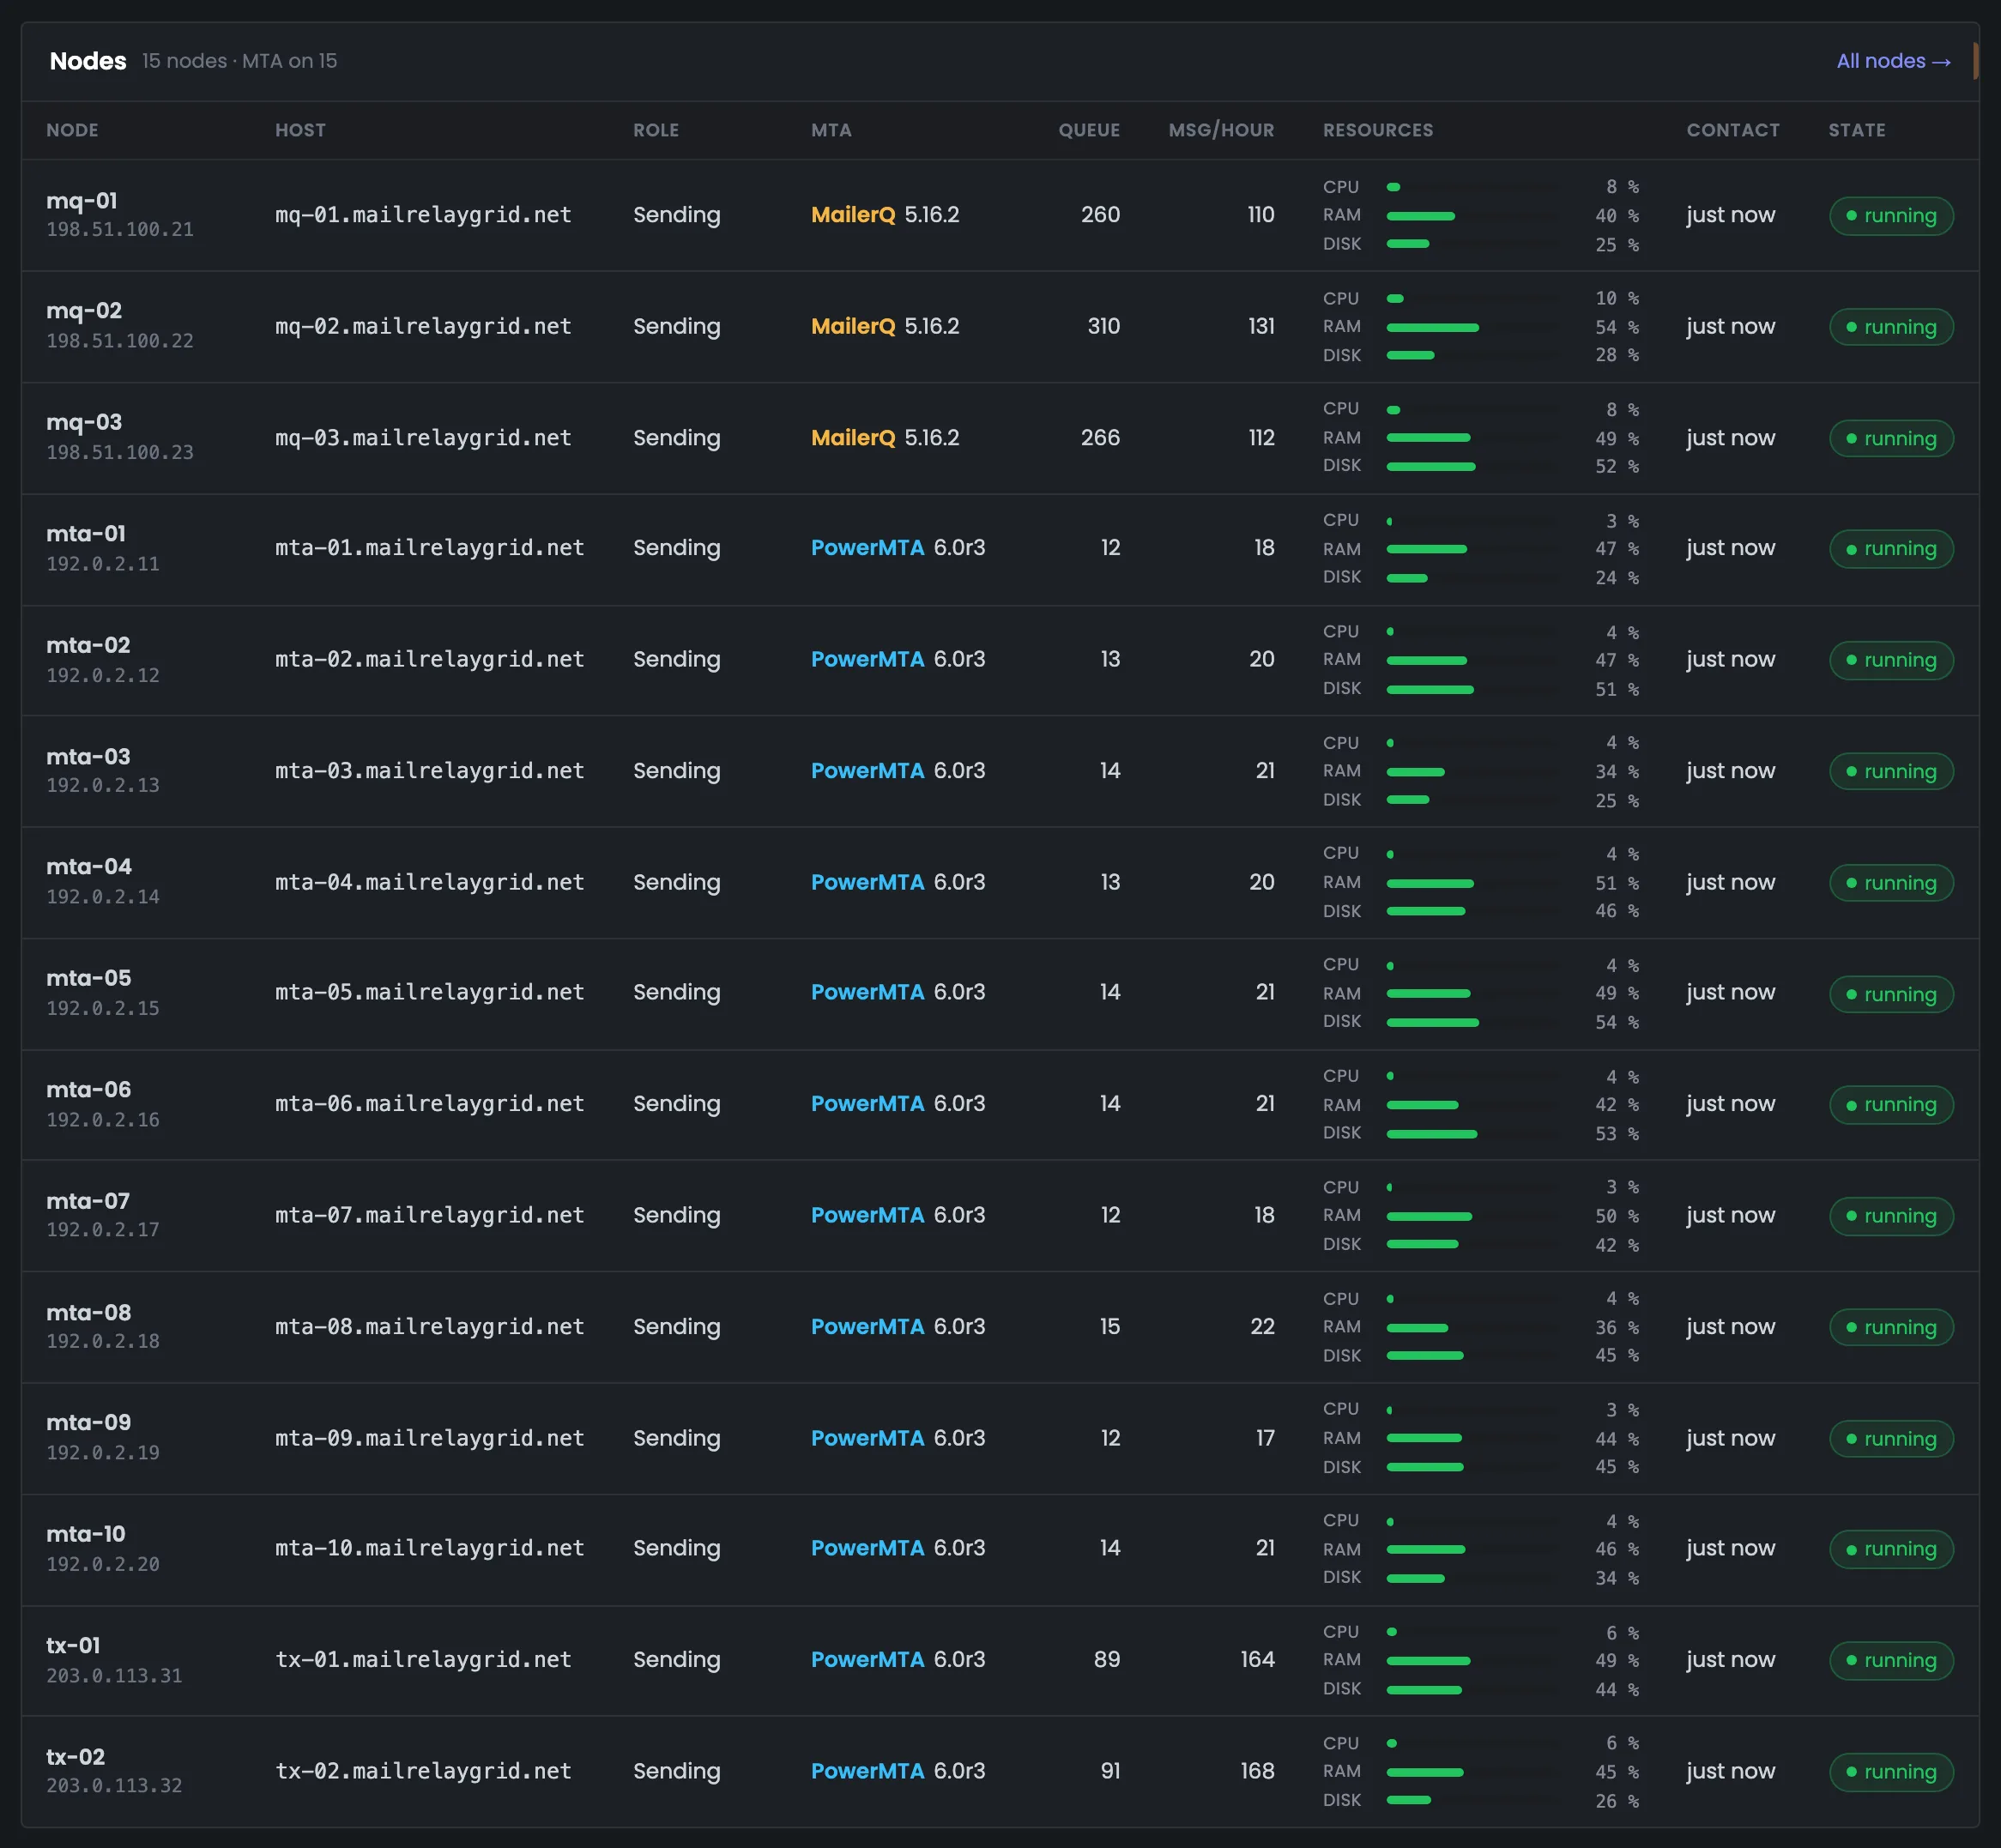
The node table shows the state of your sending servers: which ones are sending, through which MTA, how many messages are waiting in the queue and whether there are enough resources. Everything above is about messages; this table is about the machines themselves. This is where you look when the numbers at the top aren't what you expected and you need to find which server has the problem. The CPU, memory and disk bars turn yellow and then red near the limit, and the status column says plainly if the server or the MTA isn't responding. The disk threshold is stricter than for CPU and memory: when the disk is full, the MTA stops. A single server in full — MTA status, queues and controls — is shown in monitoring.
EnlargeScreen 04 · Nodes. An example from the MTA-Hub interface.
Node and host — the name in the Hub, the address and the full host name.
Role — sending, tracking or both.
MTA — PowerMTA or MailerQ, with the version.
Queue and messages per hour — for each server.
Resources — CPU, memory and disk; the bar turns yellow and then red near the limit.
Contact and status — “running”, “not responding”, “MTA not responding”, or “silent” for more than 15 minutes.
The disk threshold is stricter: when the disk is full, the MTA stops.
05
Message path
The chain from domain to gate
The message path is the sending chain from left to right, in the order a message passes through it: domains, nodes with an MTA, vMTAs, addresses and proxy gates. Each link shows how many are in use and what has been checked: DKIM for domains, reverse DNS for addresses. The block helps you spot the bottleneck: in the example only one gate is online, while there are 26 domains and 15 nodes. On the right is a link to the infrastructure diagram, where you see the whole chain. Only vMTAs that actually sent mail during the period are counted: in the example, 35 — 22 domain channels, 9 proxy channels and 4 per address. Major mailbox providers check reverse DNS first.
EnlargeScreen 05 · Message path. An example from the MTA-Hub interface.
Sending domains — 26 — DKIM on 25, on own NS — 24.
Nodes with an MTA — 15 of 15 online.
vMTAs in use — 35 — 22 domain, 9 proxy channels, 4 per address.
Node addresses — 26 — all have reverse DNS.
Gates online — 1, with 7 proxies in pools.
This way you see at once at which link the chain narrows.
06
Domains
Zone, DNS and blacklists
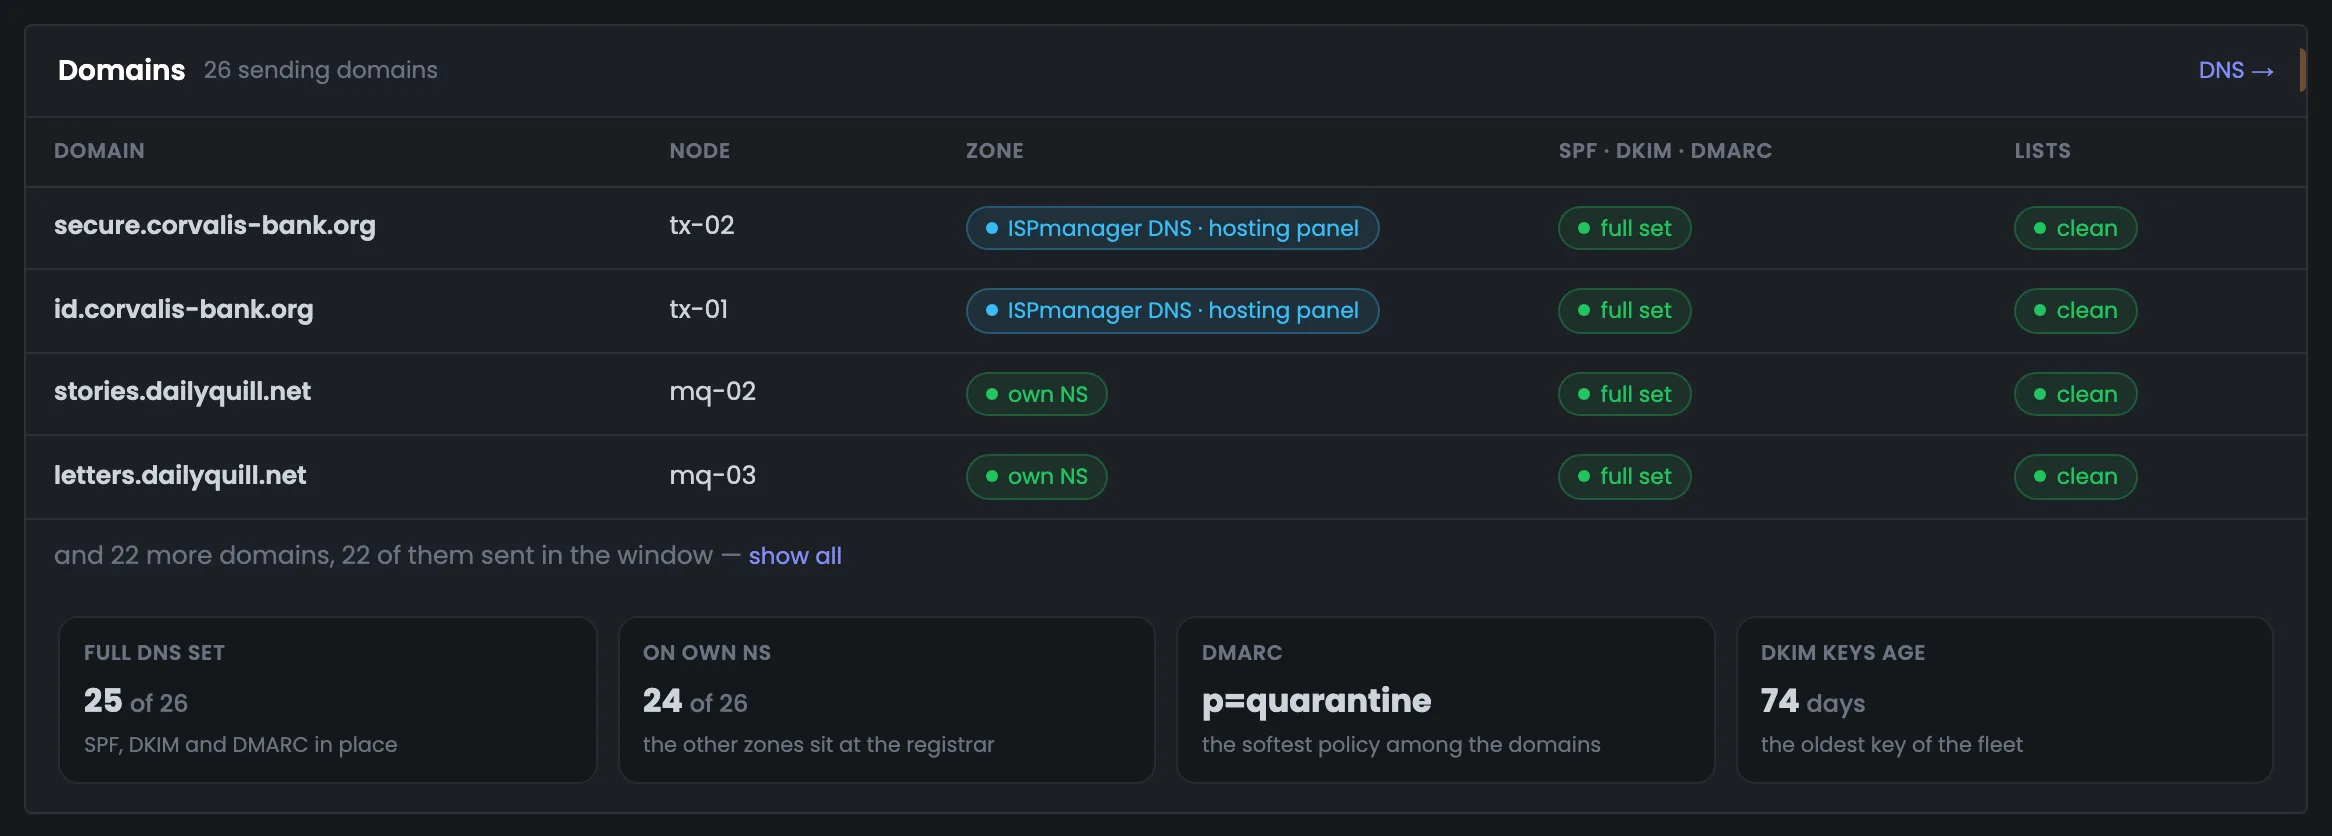
The domains block: a mailbox provider decides a message's fate before it even reads the text — it looks at the domain, the signature and blacklists. The table lists the most active domains for the period: which server, where the zone is kept, whether SPF, DKIM and DMARC are in place and whether the lists are clean. The summary at the bottom covers all domains: in the example, 25 of 26 have a full DNS set, the softest DMARC is p=quarantine, and the oldest DKIM key is 74 days old. A domain that hasn't been checked isn't shown as clean. The zone is either “own NS” — kept by the Hub itself, which changes records in minutes — or an account with a DNS provider. A domain with an incomplete SPF, DKIM and DMARC set also appears in the to-do list at the top.
EnlargeScreen 06 · Domains. An example from the MTA-Hub interface.
Zone — “own NS” or an account with a DNS provider.
Lists — “clean”, “listed” or “never checked”.
Summary — full DNS set on 25 of 26, on own NS — 24, softest DMARC — p=quarantine, oldest DKIM key — 74 days.
If there was no check, the domain isn't shown as clean.
Proxies, warm-up and bounces
3 screens
At the bottom are proxies, warm-up and bounces. Each block is short: a few numbers and the most important rows. The full breakdown is in the section each block links to. They show where proxies fall behind direct sending, whether warm-up is lagging, and which mailbox providers reject mail most often.
07
Proxies
Fitness and delivery through proxies
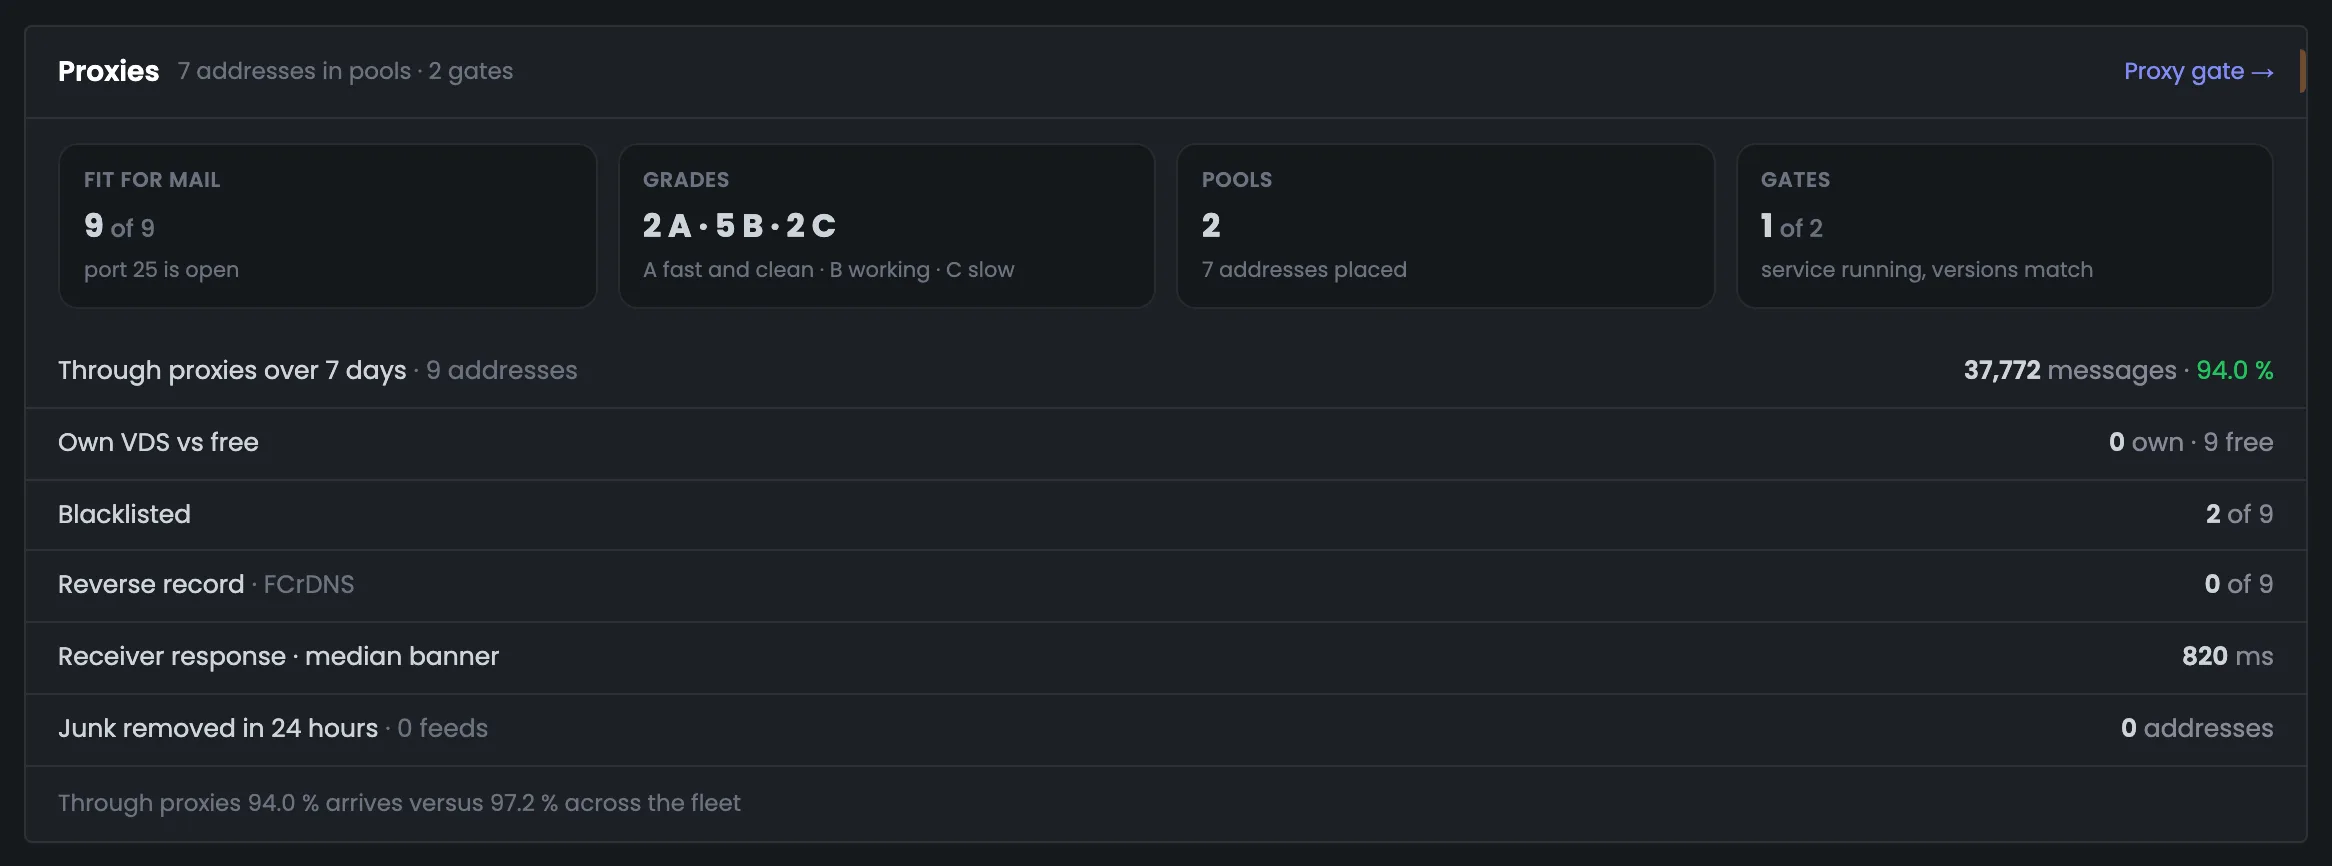
The proxy block answers two questions: are your proxies fit for sending, and does mail get through them better than directly? At the top: how many addresses are fit for mail, their grades, pools and gates; below: delivery through proxies, blacklists and reverse DNS. In the example all 9 proxies are fit, but none has a reverse DNS record, and delivery through them is 94.0% versus 97.2% across the whole fleet. A gap like that is a reason to look at the proxies more closely. Address grades mean: A — fast and clean, B — working, C — slow. A proxy is used for sending only through a pool assigned to a server.
EnlargeScreen 07 · Proxies. An example from the MTA-Hub interface.
Fit for mail — 9 of 9 — port 25 open.
Grades — 2 A · 5 B · 2 C.
Pools — 2, with 7 addresses assigned.
Gates — 1 of 2 in service.
Through proxies in 7 days — 37,772 messages, 94.0%.
Blacklists and reverse DNS — 2 of 9 listed, reverse DNS — 0 of 9.
The caption at the bottom compares: 94.0% gets through proxies versus 97.2% across the whole fleet.
08
Warm-up
All plans in one table
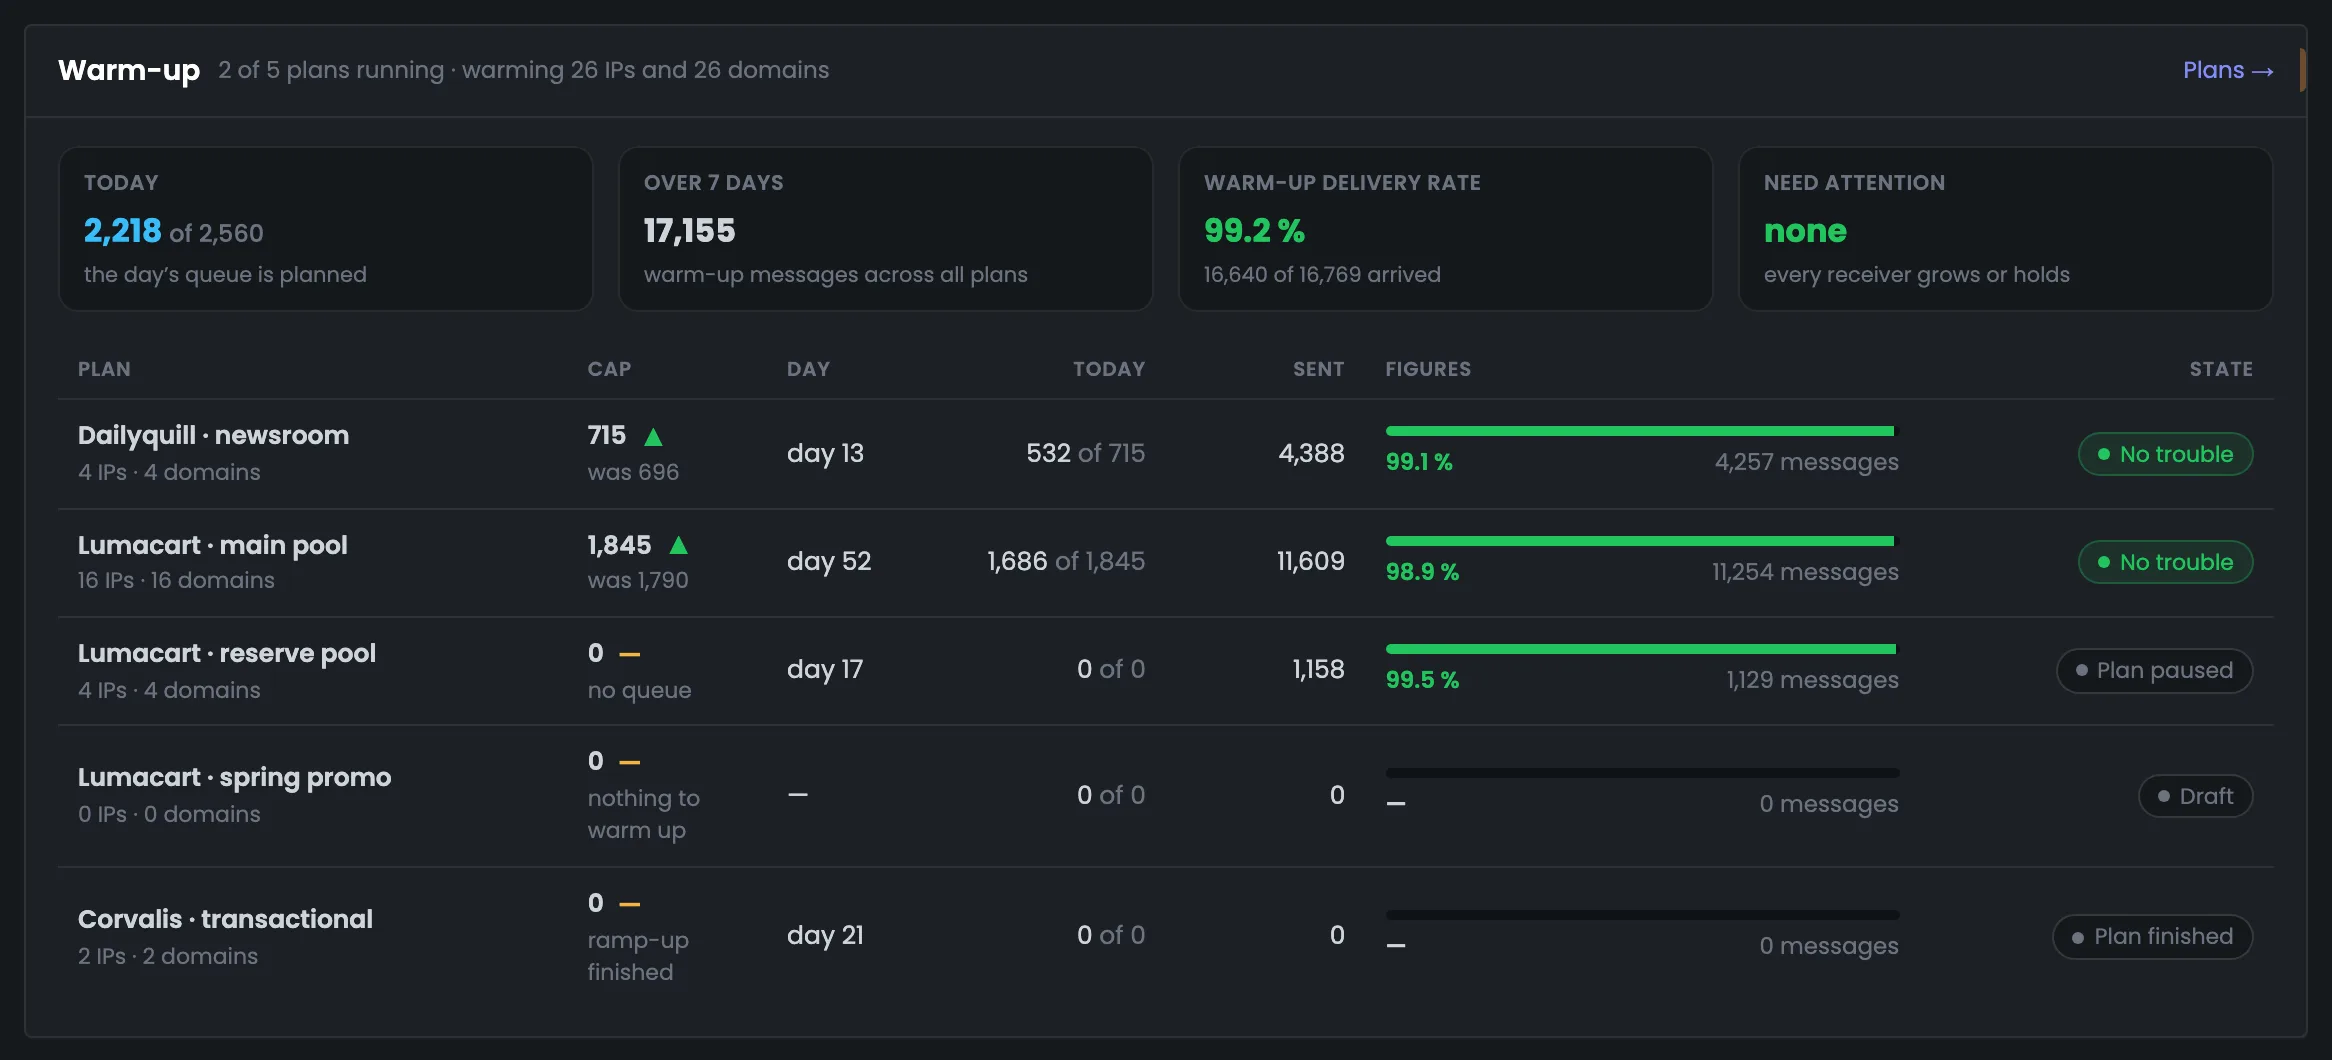
The warm-up block shows whether IP warm-up is on plan — across all plans at once. Four tiles: how many warm-up messages went out today and over the period, their delivery rate, and whether any mailbox providers have stalled. In the example 2,218 of 2,560 messages went out today, the delivery rate is 99.2%, and none need attention. Below is a table of plans with the daily limit and an arrow compared with yesterday: you see whether warm-up sped up or backed off. If a provider is under “Need attention”, warm-up has stalled for it, and the plan should be looked at in the “Warm-up” section. Running plans are at the top of the table.
EnlargeScreen 08 · Warm-up. An example from the MTA-Hub interface.
Today — 2,218 of 2,560.
In 7 days — 17,155 warm-up messages.
Warm-up delivery rate — 99.2% — 16,640 of 16,769 delivered.
Need attention — none — all providers are growing or holding pace.
Plans table — limit with an arrow vs. yesterday, day, today, sent, delivery and status.
Running plans at the top; below them — paused, draft and finished.
09
Bounces and returns
Who, why and from which addresses
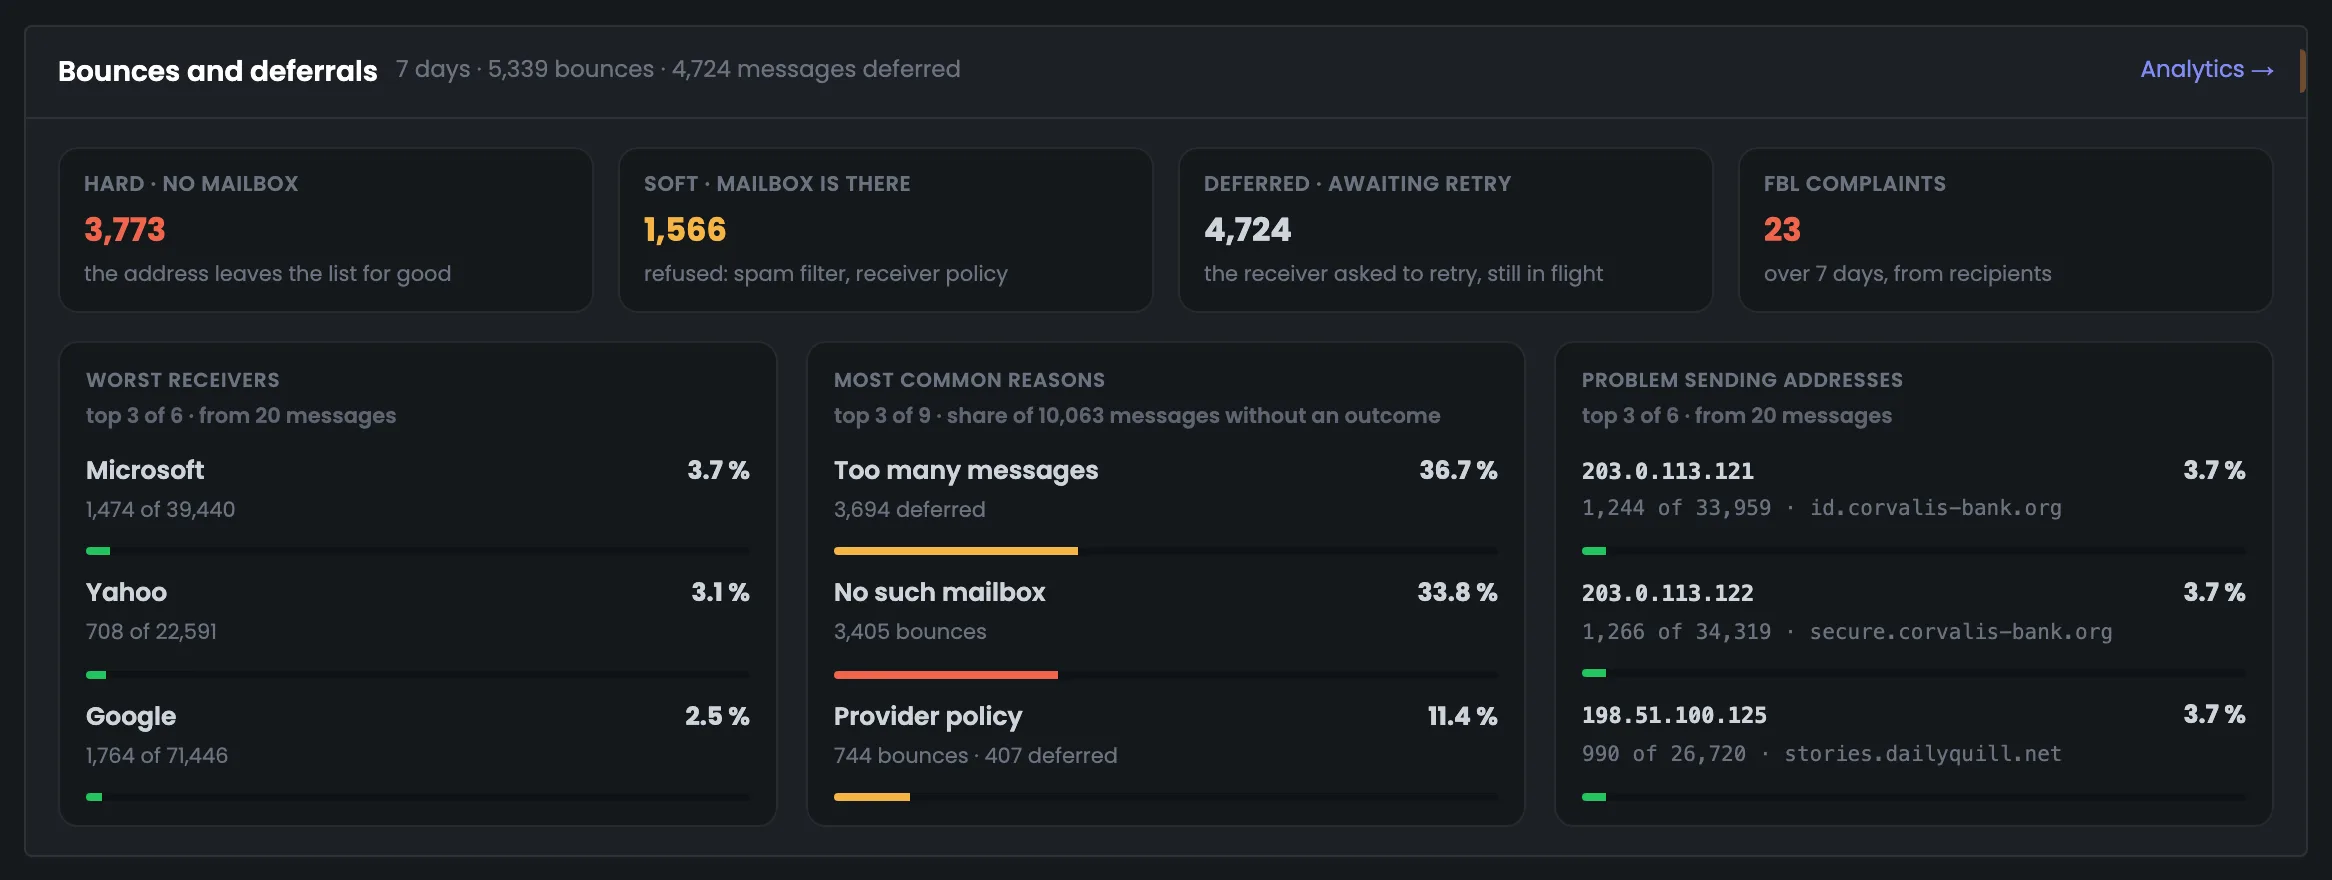
The bounce block briefly answers which mailbox providers reject mail, for what reasons and from which sending addresses. That's enough to tell whether the problem is general or limited to one provider, and to go straight to the right place. In the example, over 7 days there were 3,773 hard bounces (HARD), 1,566 soft ones (SOFT) and 23 complaints, and Microsoft accepts worst — 3.7% bounces. The full breakdown of reasons and addresses is in “Analytics”. Only providers and addresses with at least 20 messages make the lists. FBL complaints are recipients who clicked “this is spam”. SOFT bounces improve with work on the message content, reputation and sending speed.
EnlargeScreen 09 · Bounces and returns. An example from the MTA-Hub interface.
HARD — 3,773 — no mailbox, the address leaves the list.
SOFT — 1,566 — a spam filter or a provider rule.
Deferred — 4,724 — the provider asks to retry.
FBL complaints — 23.
Worst acceptance — Microsoft 3.7% bounced, Yahoo 3.1%, Google 2.5%.
Most common reasons — too many messages 36.7%, no such mailbox 33.8%, provider requirements 11.4%.
Only providers and addresses with at least 20 messages over the period make the lists.
06 / Questions about the Dashboard
Frequently asked questions about the email sending Dashboard.
In short: where the numbers come from, how to read the colors, and why some servers are left out of the totals.
On the left, sending by day and the delivered share; on the right, the same messages by the recipients' mailbox providers.
Where do the Dashboard numbers come from?
From the reports of PowerMTA and MailerQ themselves on your servers, not from your email platform.
What does a tile's color mean?
Green means all is well, yellow means there's something to look at. For mailbox providers: green from 90% delivery, yellow 70–90%, red below 70%.
Why was a server left out of the totals?
It stopped responding. The Hub doesn't pass off its old numbers as fresh: the server is left out of the totals, and the Dashboard says that nothing is known about it.
What is the to-do list?
The Hub puts it together itself from its own checks. A line appears only when something needs to be done, and disappears as soon as the cause is fixed.
How is HARD different from SOFT?
HARD means the mailbox doesn't exist and the address should be removed from your list. SOFT means the mailbox exists but the message wasn't accepted: a spam filter or a provider rule kicked in.
Do deferred messages hurt the delivery rate?
No. The provider asked to retry later — the message is still in progress, and the Hub will retry on its own.
Why is the last bar pale?
The current day isn't over yet. This way an unfinished day doesn't look like a failure.
Can I view just one infrastructure?
Yes, with the list next to the period. The period is 24 hours, 7 days or 30 days.
07 / Next step
Dig into your sending in Analytics.
The Dashboard tells you whether everything is fine and where exactly something is wrong. A detailed breakdown of the same sending by server, domain, mailbox provider and reason is in Analytics.
A single server in full — MTA status, queues and controls — is shown in Monitoring.