PowerMTA monitoring. Status, queues and deliverability.
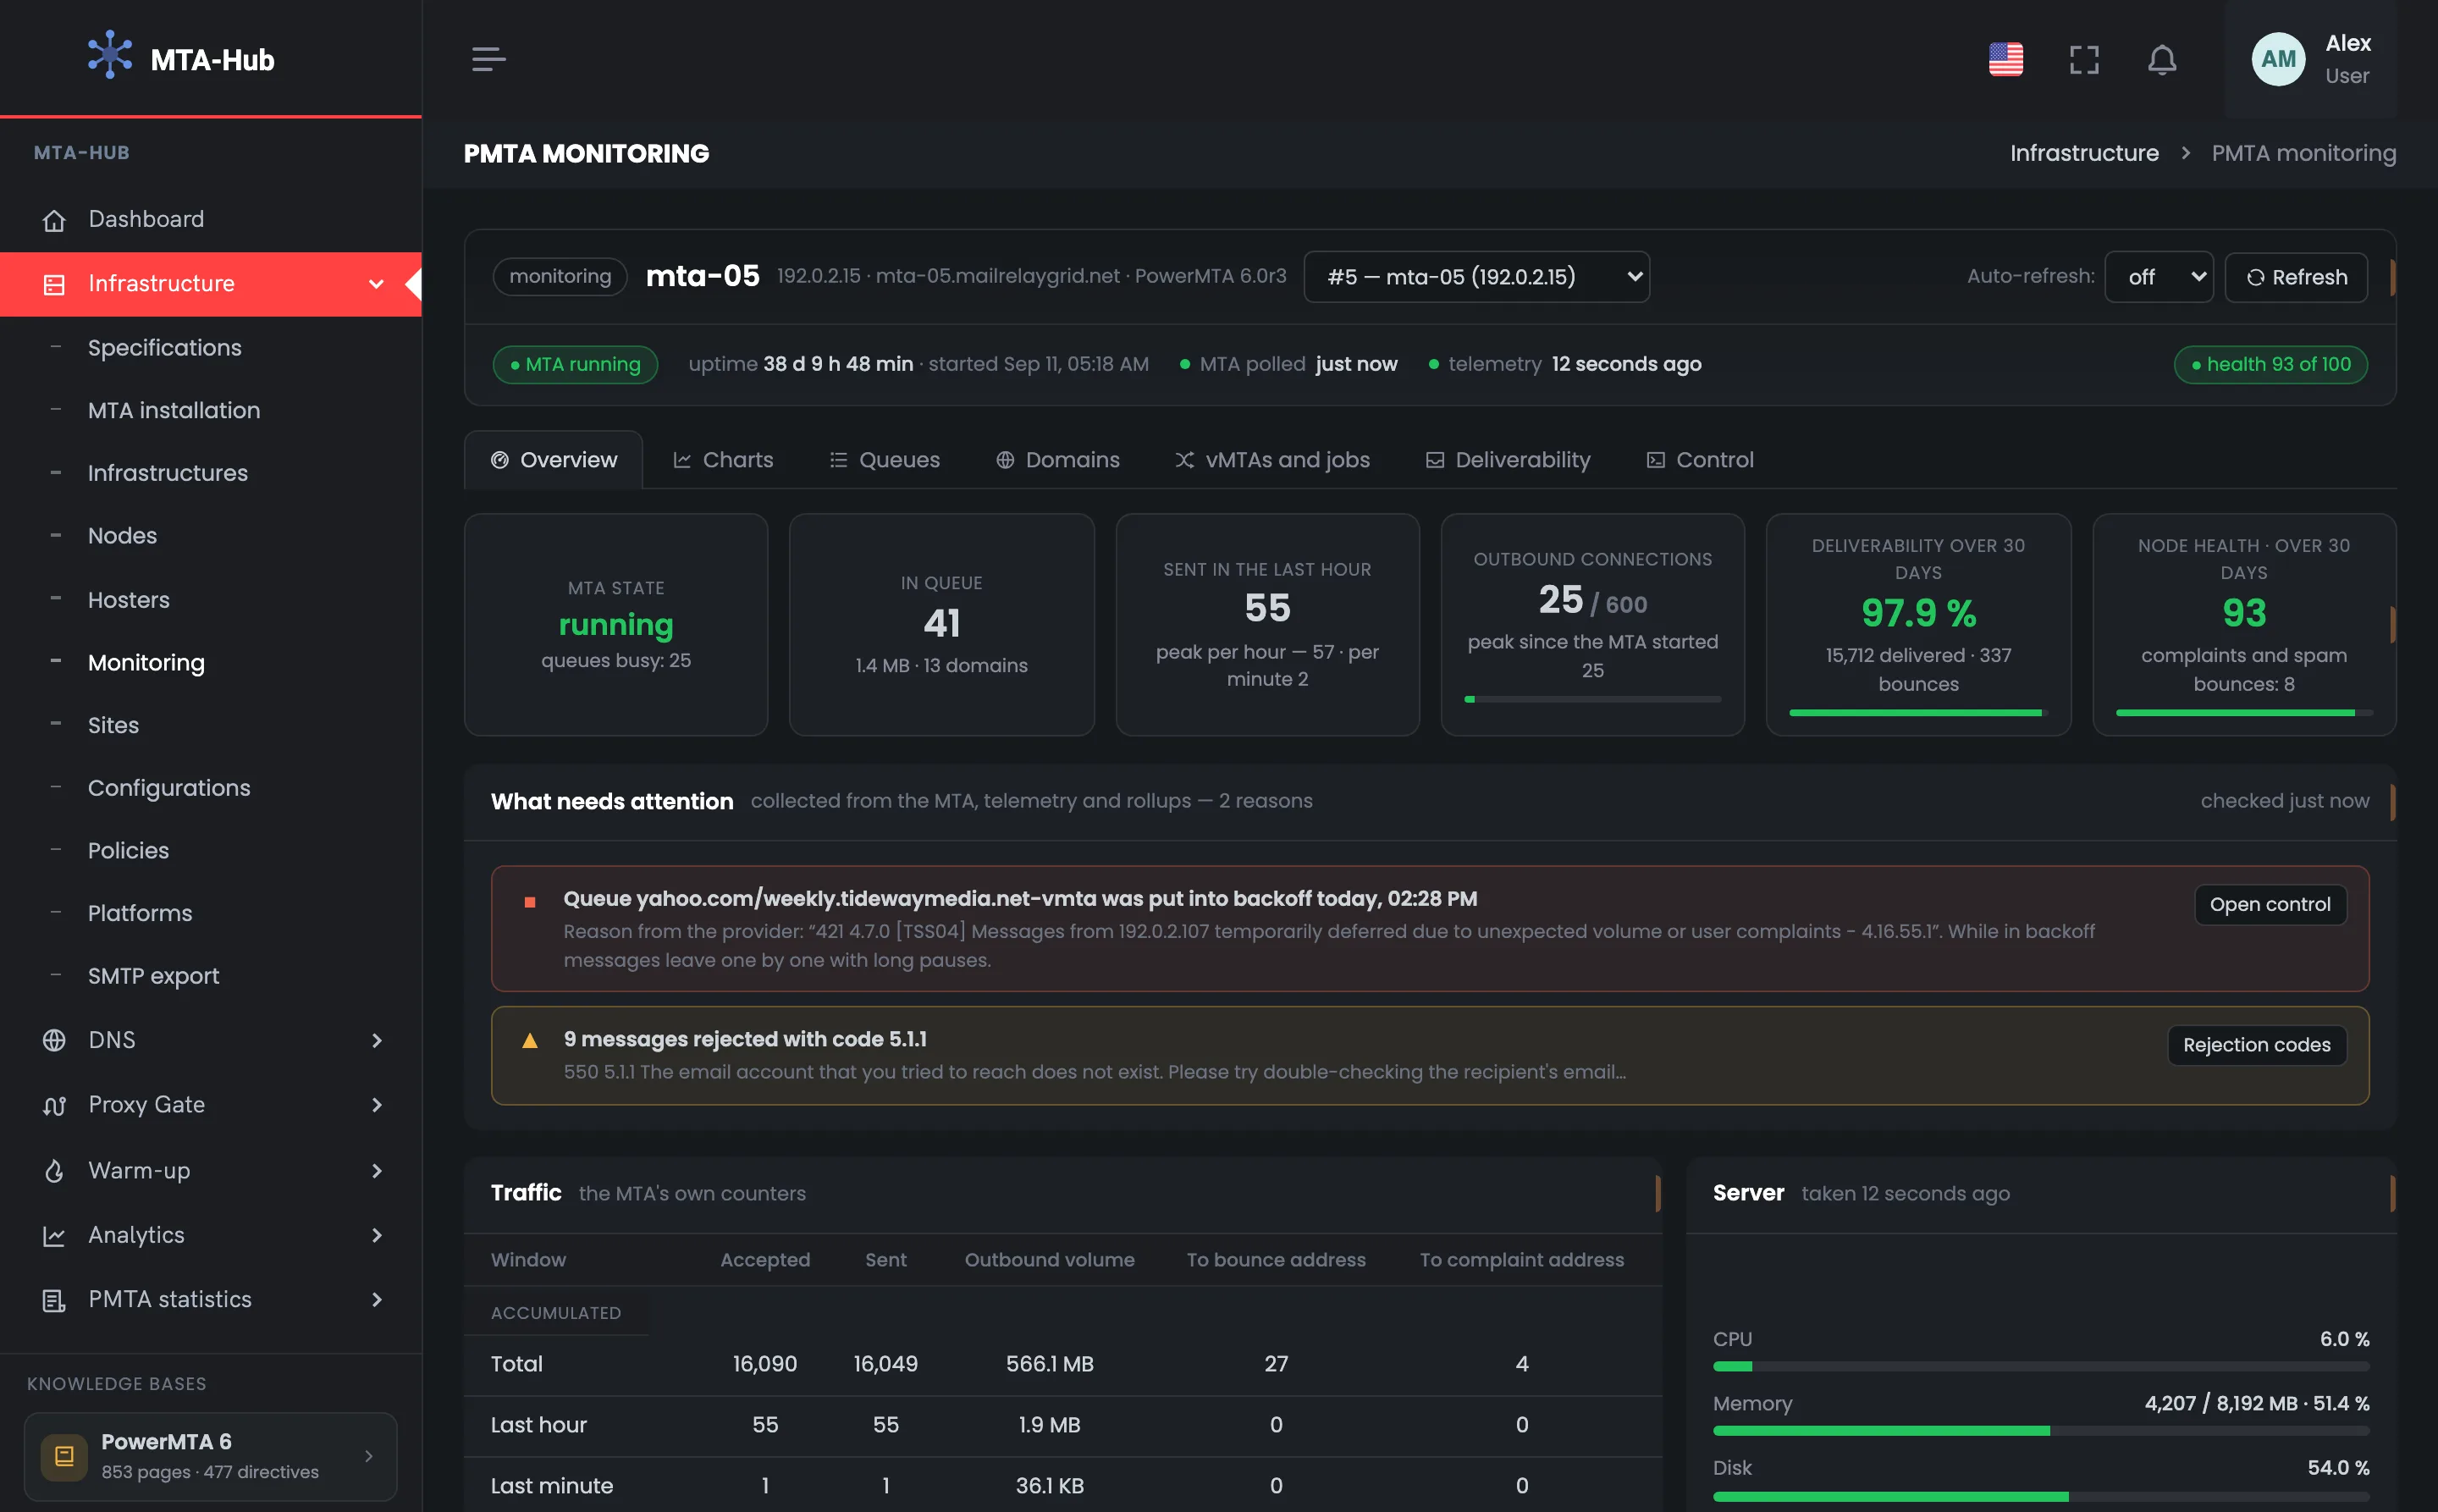
What is happening with the MTA right now, charts, queues, domains, vMTAs, deliverability and control: the Hub takes its data from PowerMTA itself and shows everything about one server in one window.
You can manage the queue right here: pause it, slow it down, bring it back to normal speed, take an address out of sending.
Whether the service is running, how many messages are in the PowerMTA queue, how many connections are open and how much went out in the last hour — PowerMTA itself answers that. The Hub does not guess from indirect signs: it asks the MTA, takes server measurements every minute and collects a record of every message.
Three sources, one window
01 · MTA responseRight now
02 · Server measurementEvery minute
03 · Message accountingA record of each
04 · One windowSeven tabs
State comes from the MTA response, load and queue over a period from measurements, delivery and bounces from message accounting
Right now
MTA response
The state of mta-05 is the answer of the PowerMTA management interface. The Hub asks it when the page opens, when you press “Refresh” and on auto-refresh — every 15, 30 or 60 seconds.
MPowerMTA
response
MTA stateRunning
41 messages in queue25 connections of 600
Over 30 days
Message accounting
The Hub collects sends, deliveries, bounces and deferrals from the MTA's accounting records and adds them up by hour and day: by mailbox provider, vMTA, domain and reason.
HMTA-Hub
accounting
Deliverability97.9%
15,712 delivered337 bounces
02 / Problem feed
What needs attention on your sending server.
A queue slowed down after a mailbox provider's response, a frequent bounce code, a full spool or disk, server metrics that have not arrived for a while — all of this is gathered automatically into a feed at the top. Each problem has a button that takes you to where you deal with it.
Queue to yahoo.com
Backoff
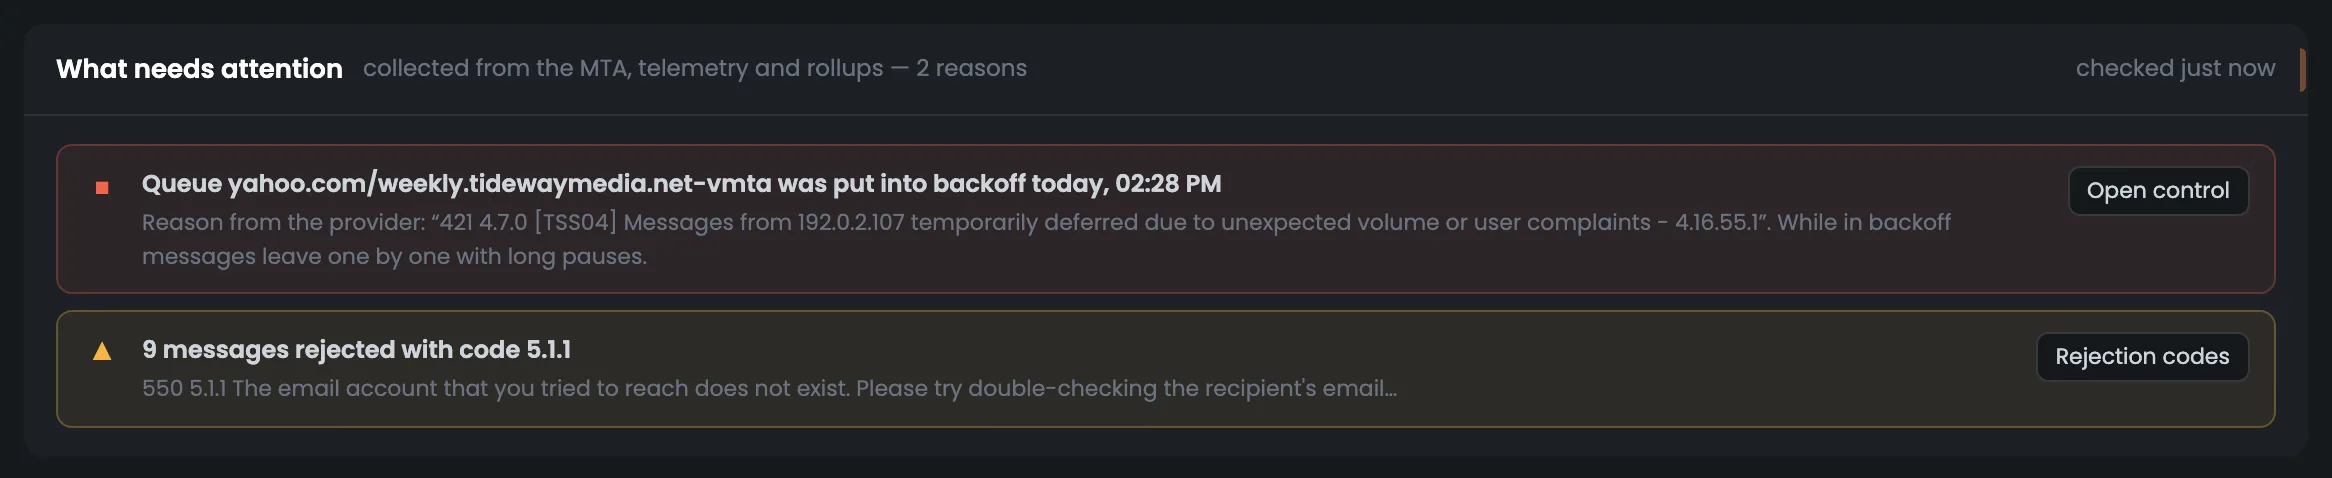
The mailbox provider answered “421 4.7.0 [TSS04] … temporarily deferred due to unexpected volume or user complaints”, and the queue was put into backoff mode. While it lasts, messages go out one at a time with long pauses.
YYahoo
421 4.7.0
yahoo.com queueIn backoff
since 14:28Open control
Frequent bounce code
5.1.1
The most frequent bounce code over eight days goes into the feed if it came up at least three times. Here — 9 messages with code 5.1.1: “no such mailbox”.
HMTA-Hub
log
Bounce code5.1.1 · 9 messages
no mailboxBounce codes
The feed also picks up: the MTA not answering or shutting down, a paused queue, a health score below 70, a spool 50% full or more, a disk at 80%, memory at 90%, or server metrics missing for more than 15 minutes.
03 / PowerMTA queue
The PowerMTA queue: where the jam is and why.
Each PowerMTA queue is a “recipient domain / sending vMTA” pair. It shows up as its own row with messages, connections and mode, and the breakdowns by domain and by vMTA point you straight to where to look for the cause.
mta-05 queues
01 · In queue41 messages · 1.4 MB
02 · Queues25 with mail
03 · Paused0
04 · In backoff1 · yahoo.com
One row, one queue: recipient domain and sending vMTA, recipients, volume, connections and state
Jam at one domain
The problem is outside
If mail piles up at one domain while all vMTAs run evenly, the issue is how that domain's mailbox provider accepts your mail.
DDomain
recipient
Largest queuegmail.com · 6
weekly.tidewaymedia.netall even
Jam at one vMTA
The problem is on your side
If the queue grows at one vMTA across different domains, the cause is on your side: warm-up, a speed limit or the address's reputation.
VvMTA
sending
By vMTA22 · 11 · 8
3 vMTAs25 queues
04 / Queue control
Queue control with confirmation and a log.
Pause, backoff, normal mode, retry, taking an address out, clearing — right where you see the problem. Before anything is sent, you see the command itself; a confirmation is required, there is an auto-lift timer, and a log where every operation can be undone.
Action on a queue
Word for word
The target is picked from lists, not typed: the operation, the recipient domain, the sending vMTA and when to lift it automatically — from 30 minutes to a day, or by hand. You see the command that will go to the MTA in advance.
HMTA-Hub
command
Goes to the MTA word for wordpmta pause queue */*
confirmationauto-lift timer
Operation log
Each one can be undone
Time, operation, target, who did it and how — by hand, by a policy or on a schedule — and the result. An address taken out has a “Bring the address back” button, a returned one — “Take it out again”.
JLog
undo
192.0.2.107Taken out and returned
policy at 03:47person at 07:20
Irreversible actions — clearing, stopping and restarting — are confirmed separately. Before clearing, the Hub asks the MTA how many messages would be deleted and names that number.
05 / The interface in detail
The PowerMTA monitoring interface has 35 screens.
Seven tabs for one server: overview, charts, queues, domains, vMTAs and jobs, deliverability and control. Above each screenshot: why the screen matters. Below it: what it shows.
Overview
8 screens
The “Overview” tab answers the main monitoring question — what is happening with the server right now. It shows the MTA status, six main numbers, the problem feed, traffic and hardware, the day by the hour, what is inside the MTA, its vMTAs and recent operations. This tab is usually enough to tell whether you need to dig deeper. The other tabs cover each topic in detail.
01
The node and its state
Server, version, uptime
The header of the PowerMTA monitoring page shows which server is open and what state it is in. Here it is mta-05 at 192.0.2.15 with PowerMTA 6.0r3: the status line says the MTA has been running for 38 days without a restart, was polled just now, server metrics arrived 12 seconds ago, and its health is 93 out of 100. On the right you switch servers, turn on auto-refresh every 15, 30 or 60 seconds and press “Refresh”. Below — seven tabs with the details. Open the page when you need to look into one specific server — for example, after an alert in the node list. Look at the status line first: if the MTA is not answering or server metrics have not arrived for a while, start there.
EnlargeScreen 01 · The node and its state. An example from the MTA-Hub interface.
Server — mta-05, 192.0.2.15, PowerMTA 6.0r3.
Server picker — lists every server with PowerMTA or MailerQ.
Auto-refresh — off, 15, 30 or 60 seconds.
Status line — MTA running, uptime 38 days, MTA polled just now, telemetry 12 seconds ago, health 93 out of 100.
MailerQ servers have their own page, with the broker's queues; a PowerMTA server is shown here.
02
Six main numbers
State, queue, sending
Six main numbers tell you in a few seconds whether your sending server is OK. MTA status, messages in the queue, sending over the last hour, outbound connections, deliverability and node health over 30 days sit in one row, and each number has a caption saying where it comes from and what it means. In the screenshot, the MTA is running, there are 41 messages in the queue, 25 of 600 connections are open, and 97.9% is delivered. If a number looks worrying, the feed below shows where to look. Check the MTA state and connections first: if the connections are close to the allowed maximum, sending is hitting the limit.
EnlargeScreen 02 · Six main numbers. An example from the MTA-Hub interface.
MTA state — running; busy queues — 25.
In queue — 41 messages, 1.4 MB, 13 domains.
Sent in the last hour — 55, hourly peak — 57, per minute — 2.
Outbound connections — 25 of 600, peak since start — 25.
Deliverability over 30 days — 97.9% — 15,712 delivered, 337 bounces.
Node health — 93 — complaints and spam bounces: 8.
The MTA state is one of four: running, shutting down, stopped or not answering.
03
What needs attention
Problem feed
The “What needs attention” feed gathers problems the Hub has found in the MTA response, in server metrics and in statistics — you do not need to scroll through charts to find them. There are two lines here. Red: the queue to yahoo.com was put into backoff mode, with the mailbox provider's “421 4.7.0” response quoted word for word. Yellow: 9 messages rejected with code 5.1.1 — “no such mailbox”. Each line has its own button that leads to where the problem is dealt with. The feed is the first thing to check after a delivery complaint: a queue in backoff explains why mail to one provider goes out slowly, and a frequent bounce code shows which addresses it is time to remove from your list.
EnlargeScreen 03 · What needs attention. An example from the MTA-Hub interface.
Red — the yahoo.com/weekly.tidewaymedia.net-vmta queue in backoff since 14:28, with the mailbox provider's response word for word.
“Open control” button — leads to the control tab.
Yellow — 9 messages rejected with code 5.1.1 — “no such mailbox”.
“Bounce codes” button — leads to the mailbox providers' responses.
A bounce code goes into the feed if it came up at least three times over eight days.
04
Traffic and server
MTA counters and server measurement
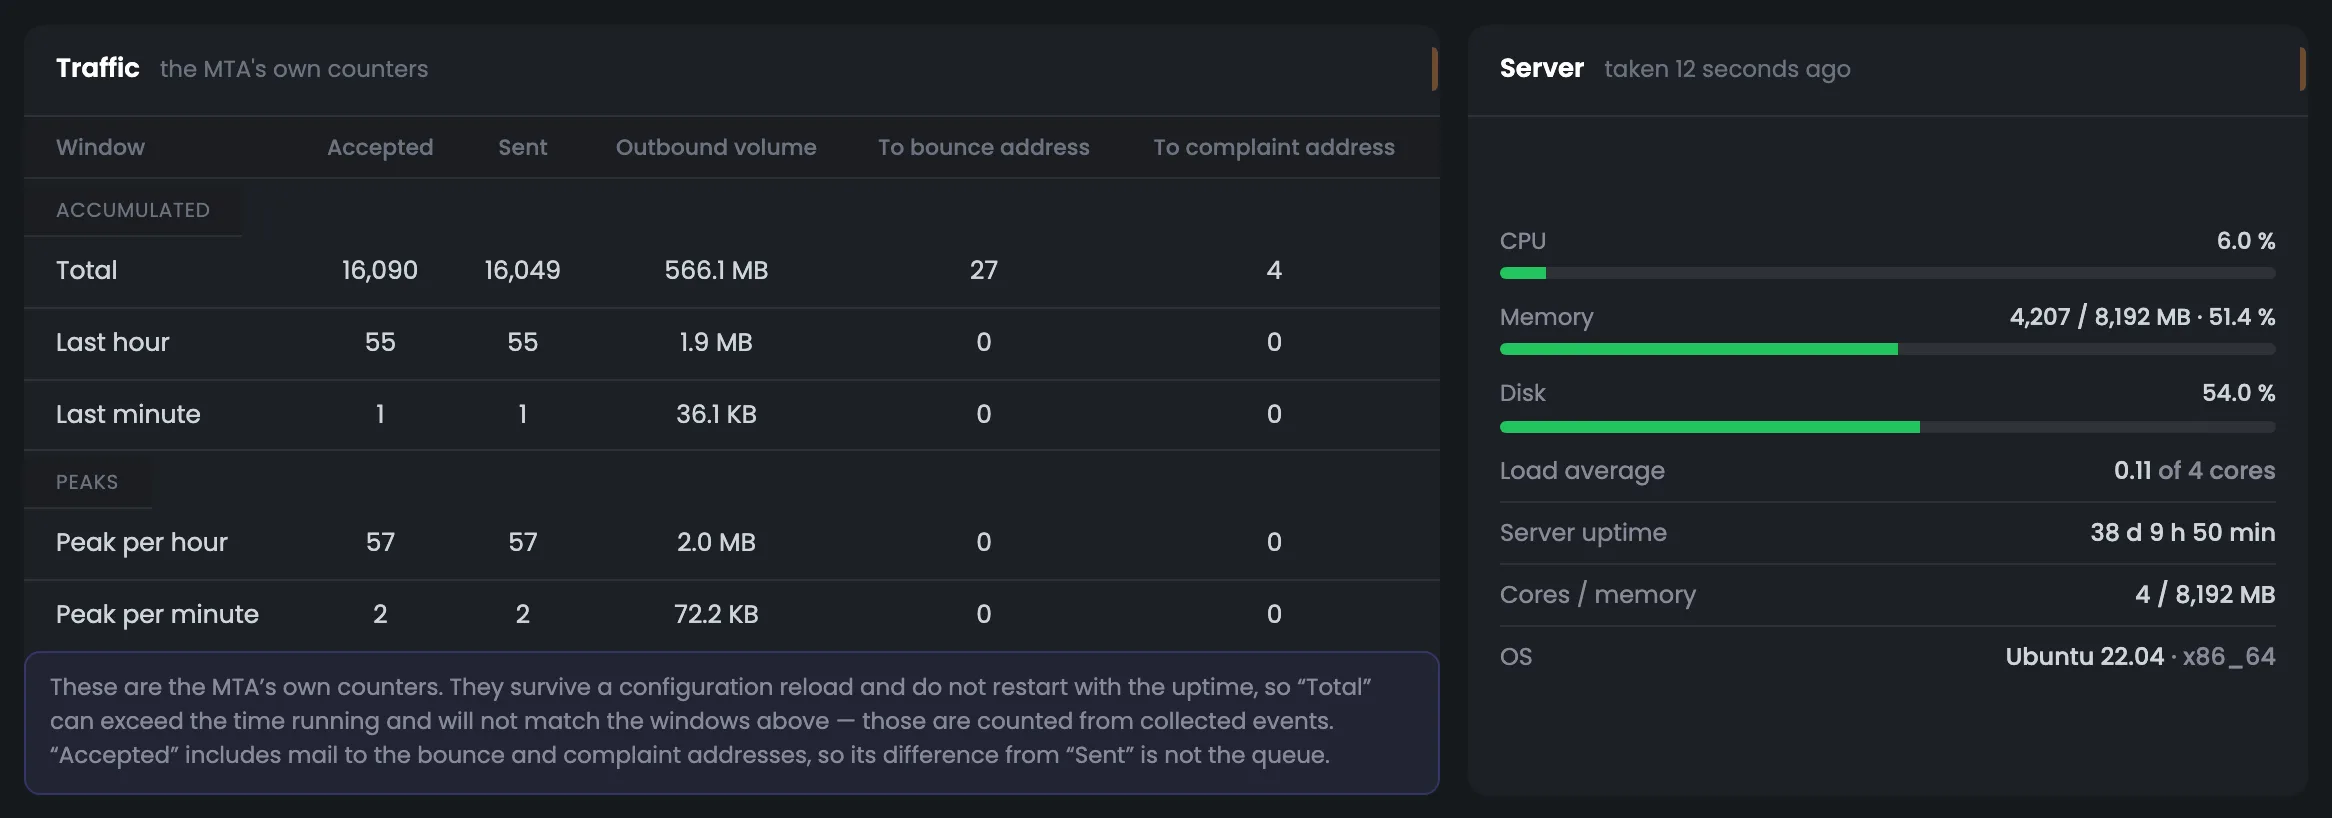
This screen compares two sides of the server's work: on the left, PowerMTA's own counters; on the right, the hardware by its last measurement. The counters show how many messages were received and sent, the volume, and mail to the bounce and complaint addresses — in total, over the last hour and minute, and at peak. On the right — CPU, memory, disk, load average and uptime. You can see at once whether sending is held back by server resources or the server has room to spare. The screen is useful when sending suddenly slows down: if CPU and memory are fine, look for the cause in the queues and mailbox provider responses, not in the hardware.
EnlargeScreen 04 · Traffic and server. An example from the MTA-Hub interface.
MTA counters — received, sent, volume, mail to the bounce and complaint addresses — in total, per hour and minute, and peaks.
Server — CPU, memory, disk, load average, uptime, cores and system.
The MTA's counters are not reset when it reloads its settings, so “Total” may not match the Hub's numbers — the caption under the table warns about this.
05
The node's day
Sending and queue by the hour
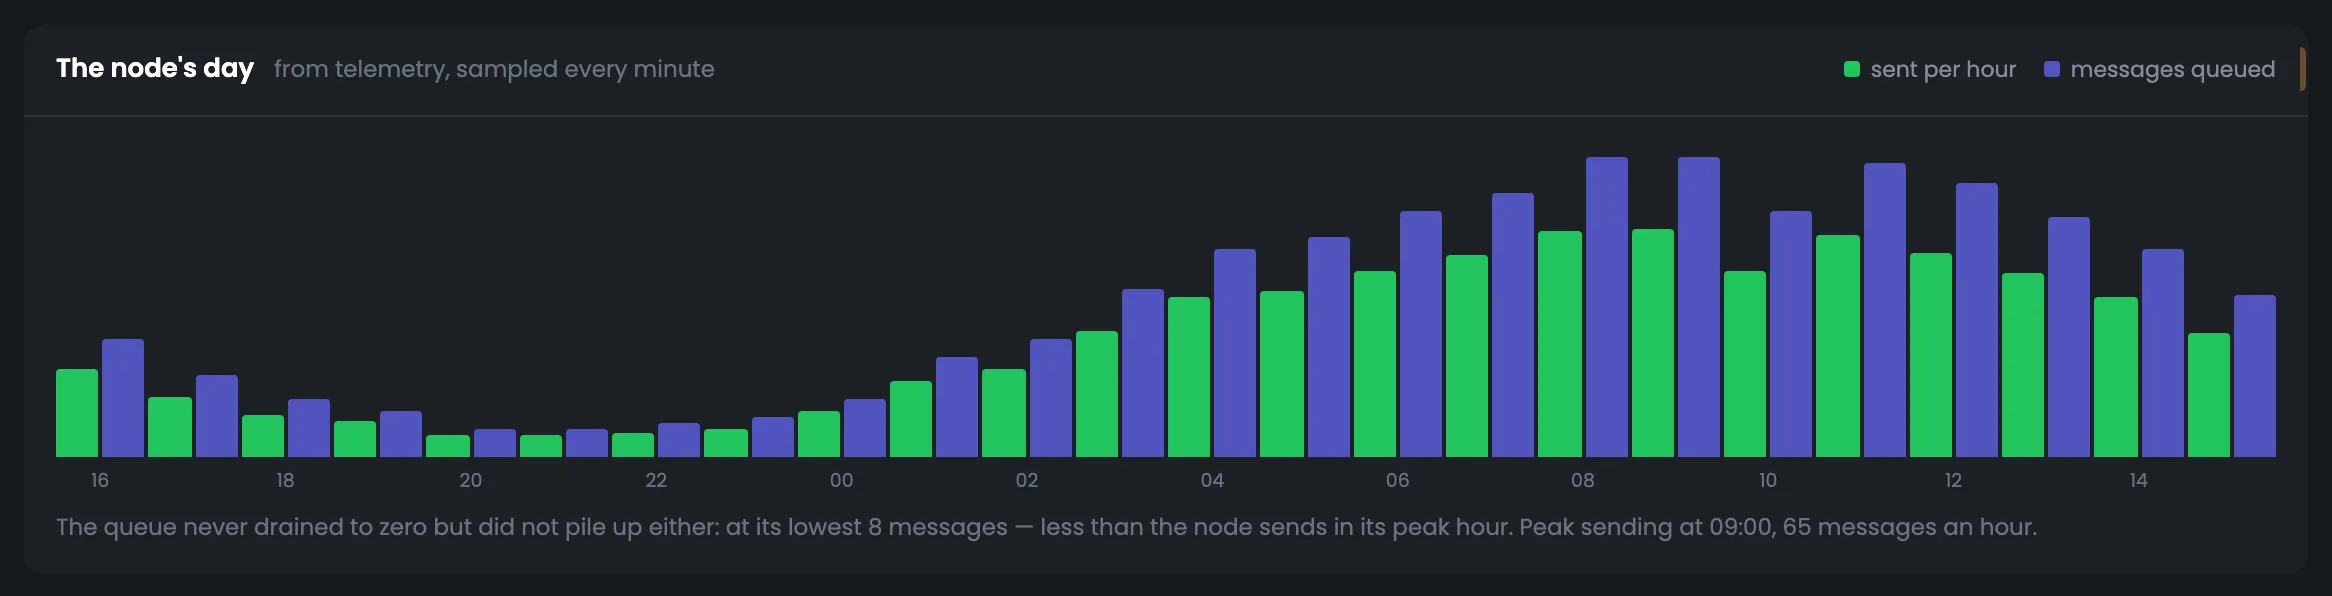
The server's last 24 hours in hourly bars: how many messages were sent and how many stood in the PowerMTA queue. The key thing on the screen is the caption: it draws the conclusion itself — did the queue empty out at least once, and if not, did it pile up — and names the peak sending hour. It is a quick answer to whether the server keeps up with everything it is given. If the caption says the queue piled up, open the “Queues” tab and find the jam. Check this screen after a big campaign: it shows whether the server cleared the queue and in which hours sending went fastest.
EnlargeScreen 05 · The node's day. An example from the MTA-Hub interface.
Bars — sent and queued, by the hour.
Conclusion — did the queue empty out at least once, and if not, did it pile up.
Peak hour — the caption names the hour with the most sending.
If even in the quietest hour the queue holds more messages than the server sends in its peak hour, mail is waiting for over an hour. Here it is just mail in progress.
06
Inside the MTA
Queues by delivery method and limits
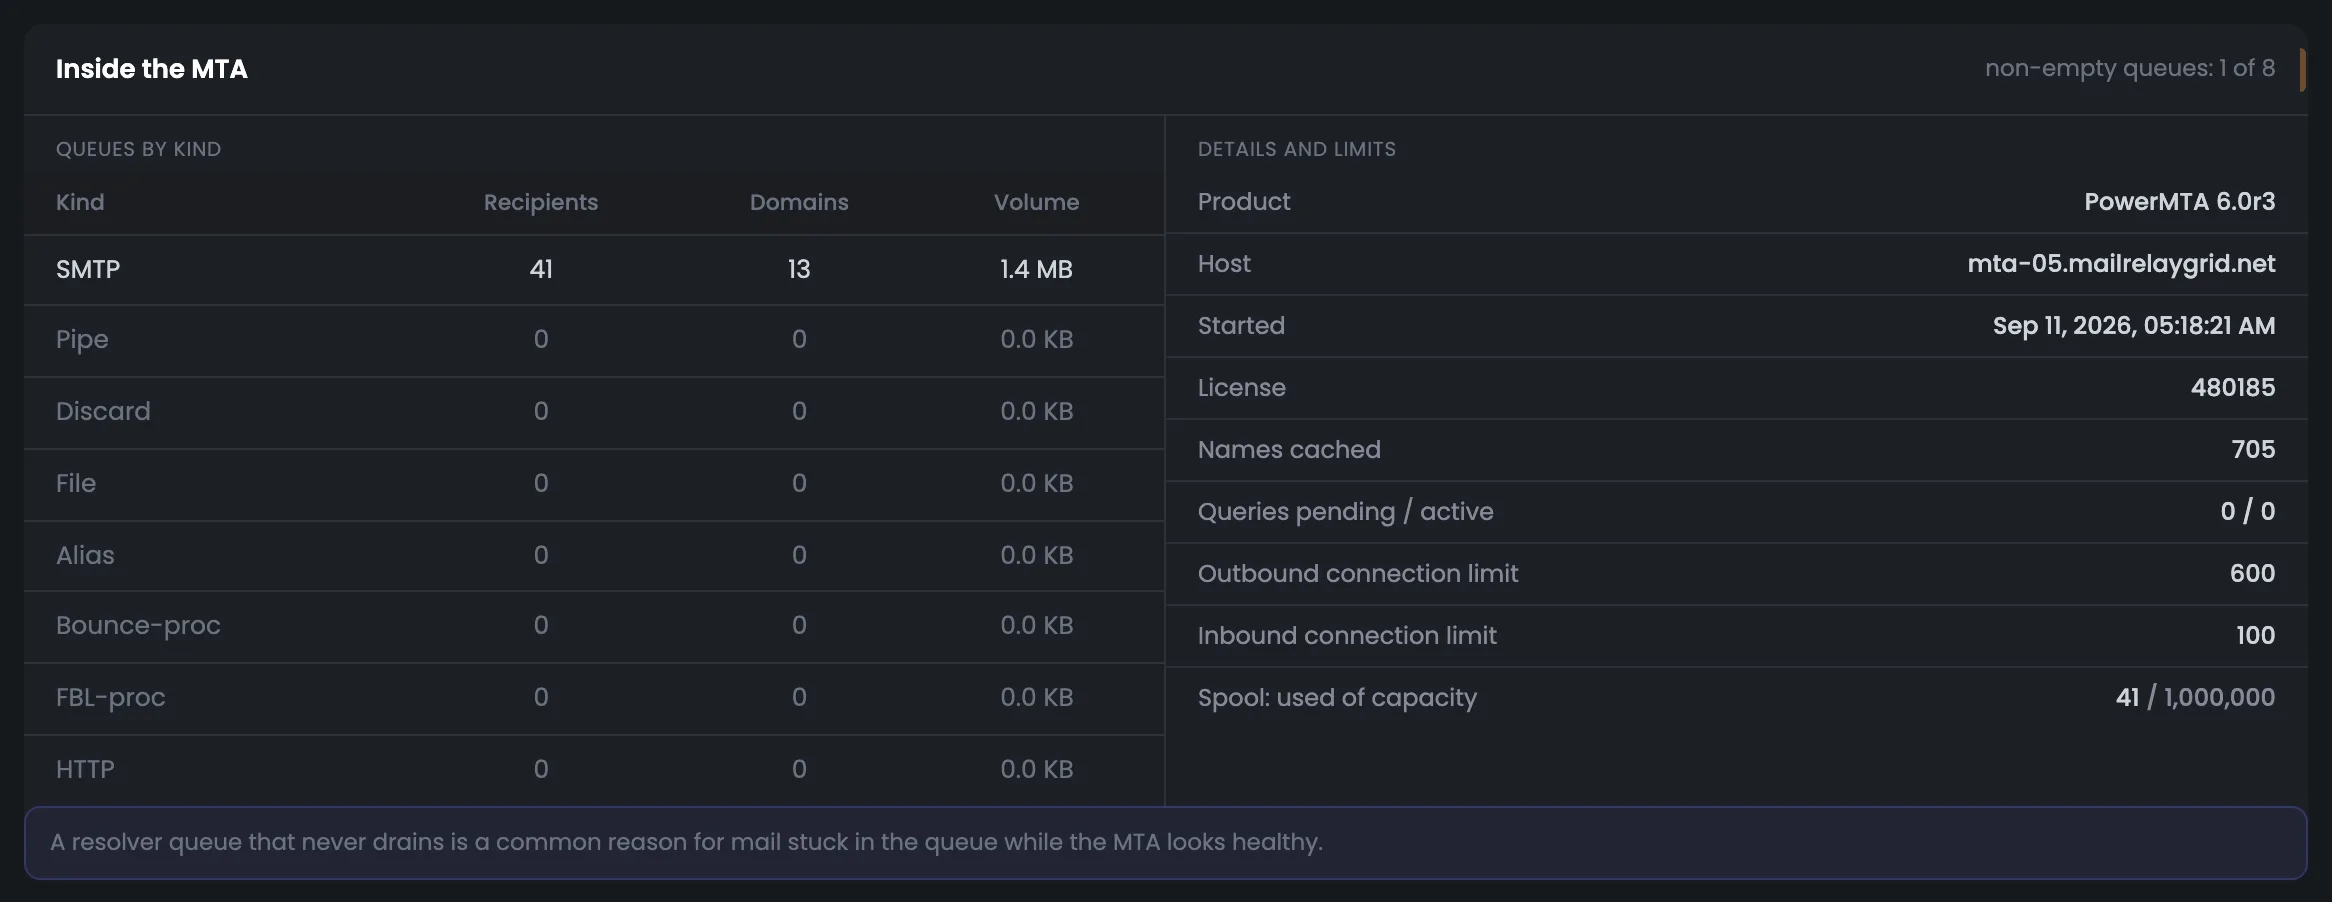
The “Inside the MTA” screen shows what PowerMTA is busy with internally. On the left — queues by delivery method: SMTP, pipe, discard, file, alias, bounce and complaint processing, HTTP — with the number of recipients, domains and volume. On the right — details about the MTA itself and its limits: product, host, start time, license, DNS cache and queries, outbound and inbound connection limits, spool space used. If a value is close to its limit, sending may be held back by exactly that. You need this screen less often than the others — usually when the MTA is running but mail goes out slower than expected. Then compare the connections and spool in use with their limits.
EnlargeScreen 06 · Inside the MTA. An example from the MTA-Hub interface.
Limits — DNS cache, DNS queries, outbound and inbound connections, spool space used.
DNS queries waiting for an answer also go into the “What needs attention” feed.
07
vMTAs on this node
What the Hub configured and what is queued
The vMTA table for this node puts two things side by side: what the Hub configured on the server and what is in the queue right now. For each of the three vMTAs you see the sending domain and its address, whether there is a reverse DNS (PTR) record, whether the DKIM key is active, which warm-up stage the address is at, how many messages are waiting and what mode the queue is in. One of them shows “backoff to yahoo.com”. This way you can tie a problem at a mailbox provider straight to a specific sending address. Open the table when a problem queue appears in the feed: if its vMTA has no PTR or an inactive DKIM key, start with DNS, not with queue commands.
EnlargeScreen 07 · vMTAs on this node. An example from the MTA-Hub interface.
vMTA — the sending domain and its address.
Reverse DNS and DKIM — whether there is a PTR and whether the signing key is active.
Warm-up — the address's ramp-up stage.
Queue and mode — one shows “backoff to yahoo.com”.
A vMTA is a virtual sending point: the address and domain a message is sent from.
08
Recent operations on the node
Three log entries
Recent operations on the node is a short excerpt from the control log, right on the overview. Three entries show when and what was done, to which address or queue, who did it and how it ended. Here a rule took an address out of sending, and then a person brought it back. The excerpt helps you understand why the server behaves differently from yesterday, and the full log with undo buttons opens on the “Control” tab with all entries. If you do not recognize an operation, open the full log: it shows whether a rule fired automatically or someone stepped in by hand.
EnlargeScreen 08 · Recent operations on the node. An example from the MTA-Hub interface.
Address taken out — a rule took the address out of sending.
Returned — a person brought it back.
Full log — on the “Control” tab.
The log shows who made the decision — an automatic mechanism or a person.
Charts
7 screens
The “Charts” tab shows the chosen period — 24 hours, 7 or 30 days. It has totals, delivery by interval, breakdowns by mailbox provider and vMTA, bounce reasons, the queue and server load. The charts answer the question of when a problem started and who it is related to. You can export volumes and delivery by interval to CSV.
09
Period and totals
24 hours, 7 or 30 days
The “Charts” tab starts with choosing a period and the totals for it. The period is 24 hours, 7 or 30 days; the screenshot has 7 days selected, Oct 13–19, with a one-day step. Badges say where the charts come from: the Hub's rollups and the node's telemetry. Six totals give the week's picture in one row: 3,896 messages sent, 97.8% delivered, 2.2% bounced, queue peak 86. The “Export CSV” button downloads volumes and delivery by interval as a file. The queue peak and the connection peak next to its limit tell you whether there was a moment in the period when the server was working at its edge. A week is handy for spotting trends: 24 hours is too short, and 30 days smooths out a recent problem.
EnlargeScreen 09 · Period and totals. An example from the MTA-Hub interface.
Period — 24 hours, 7 or 30 days; here 7 days, Oct 13–19, one-day step.
There can be more deferrals than messages: one message may be deferred more than once.
10
Sending and deliverability
By interval
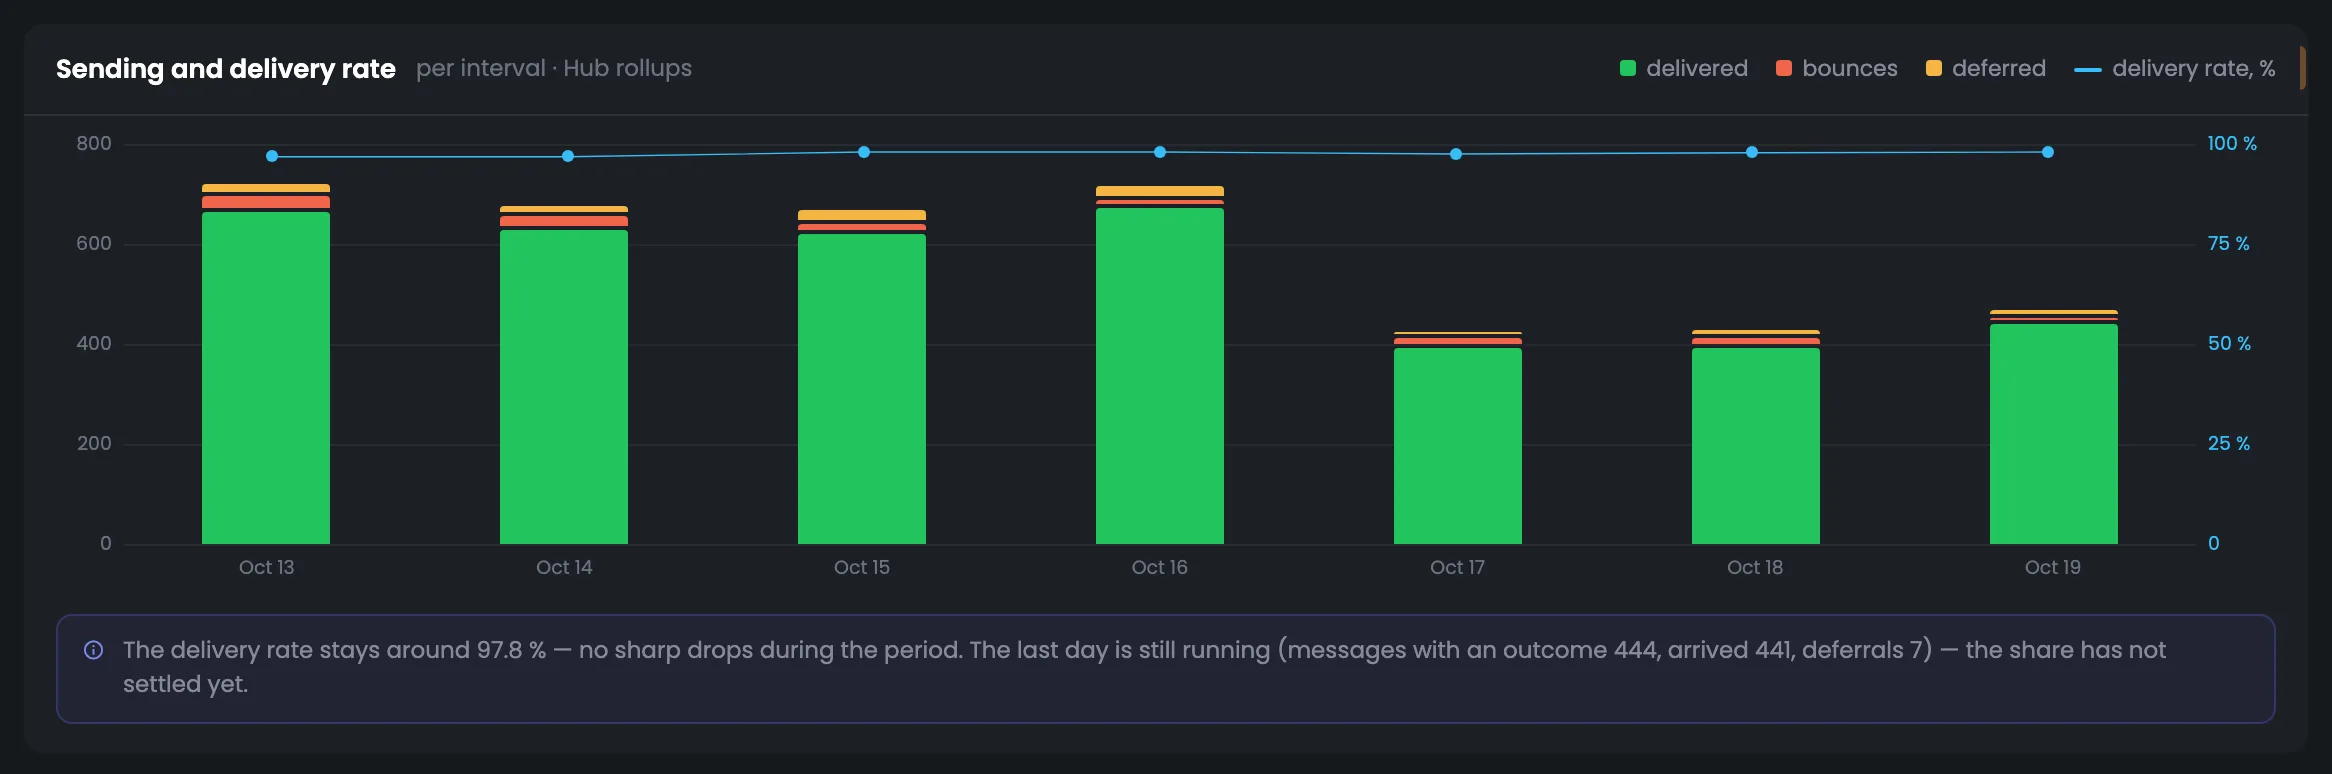
The sending and deliverability chart shows how results changed across the intervals of the chosen period. Bars split messages into delivered, bounced and deferred, and the line on top is the delivered share. If delivery changed sharply in some interval, the caption under the chart names that turning point — that is where to start digging. The shape of the line shows whether a drop was a one-off or delivery is sagging gradually. You need this screen when deliverability in the header is lower than usual: the chart shows in which interval the drop started, and the next screens — at which mailbox provider and for what reason.
EnlargeScreen 10 · Sending and deliverability. An example from the MTA-Hub interface.
Bars — delivered, bounces and deferred.
Line — the delivered share.
Caption — names a sharp turning point, if there was one.
The last day is still in progress — the caption warns that its share is not final yet.
11
Who accepts the mail
Breakdown by mailbox provider
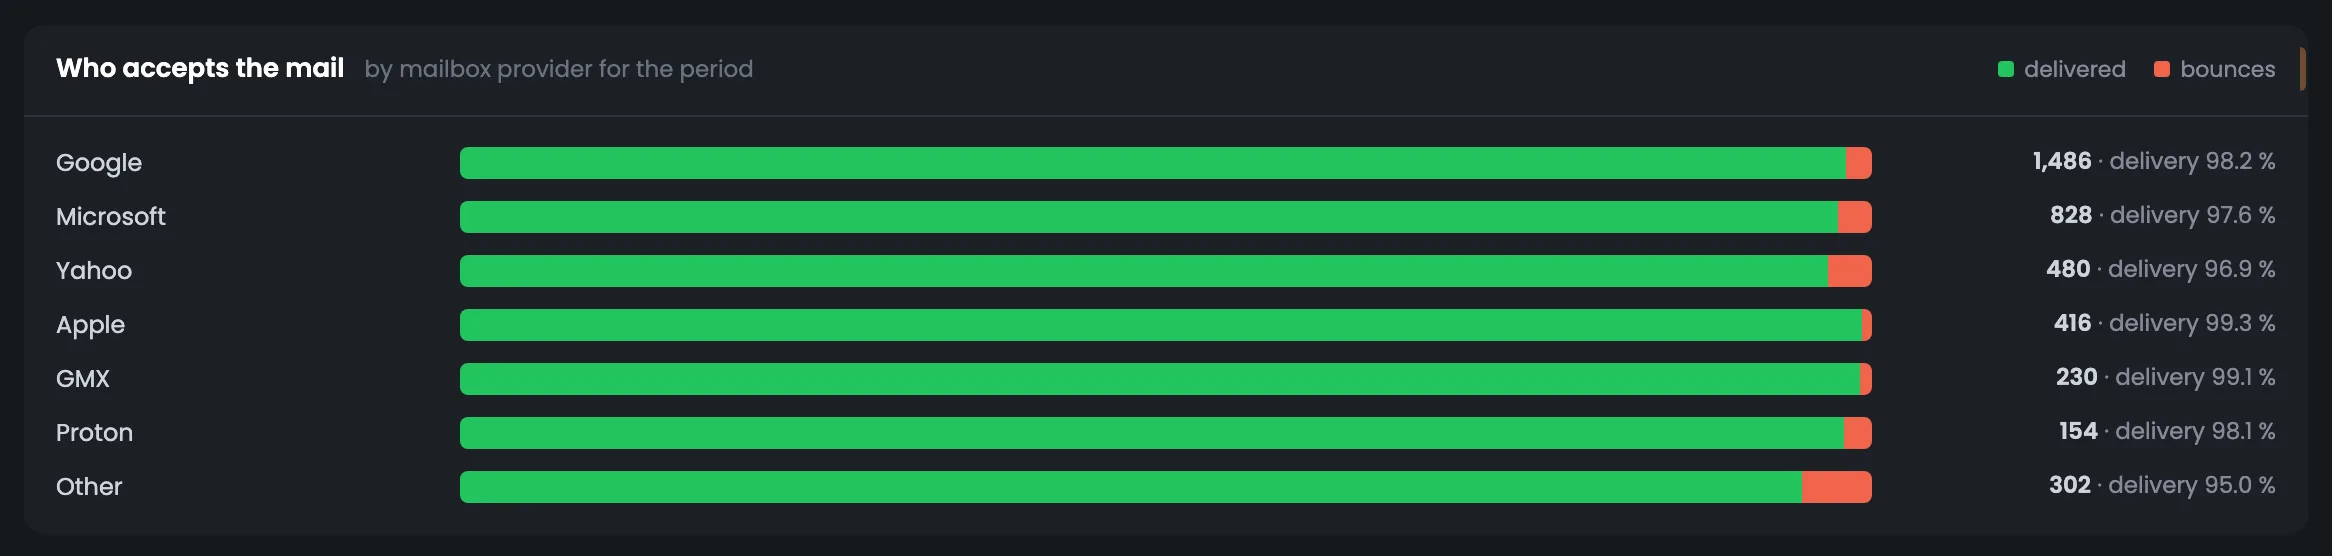
The breakdown by mailbox provider answers which of the big providers accepts your mail worse than the others. For Google, Microsoft, Yahoo, Apple, GMX and Proton it shows how many messages went out in the period and what share was delivered; all other domains are gathered in an “Other” row that always stays at the bottom. If one provider's share is noticeably lower, the problem is with that provider, not the whole server — its responses, word for word, are on the “Deliverability” tab. Compare shares across periods: if Microsoft or Yahoo suddenly started accepting worse while the others did not, look at that provider's responses.
EnlargeScreen 11 · Who accepts the mail. An example from the MTA-Hub interface.
Other — all remaining domains together — always at the bottom.
This breakdown shows which mailbox provider accepts mail worse than the others.
12
Which vMTAs sent it
Breakdown by sending address
The same period, broken down by vMTA — sending address and domain. For each vMTA you see how many messages it sent and what share was delivered; vMTAs that have been removed stay in the list too, so their history is not lost. The screen helps you tell a problem with one address from a problem with the whole server, so you do not rebuild all your sending when only one point is doing badly. If one vMTA delivers poorly, open the “vMTAs and jobs” tab: it shows whether it has a PTR, whether DKIM is active and which warm-up stage it is at. If the share dropped for all vMTAs at once, the cause is more likely the mailbox provider or your list.
EnlargeScreen 12 · Which vMTAs sent it. An example from the MTA-Hub interface.
vMTA row — how many messages and what share was delivered.
Removed vMTAs — also in the list — their history is not lost.
If one vMTA delivers noticeably worse than the rest, the problem is with it, not the whole server.
13
Bounce reasons
By interval and reason
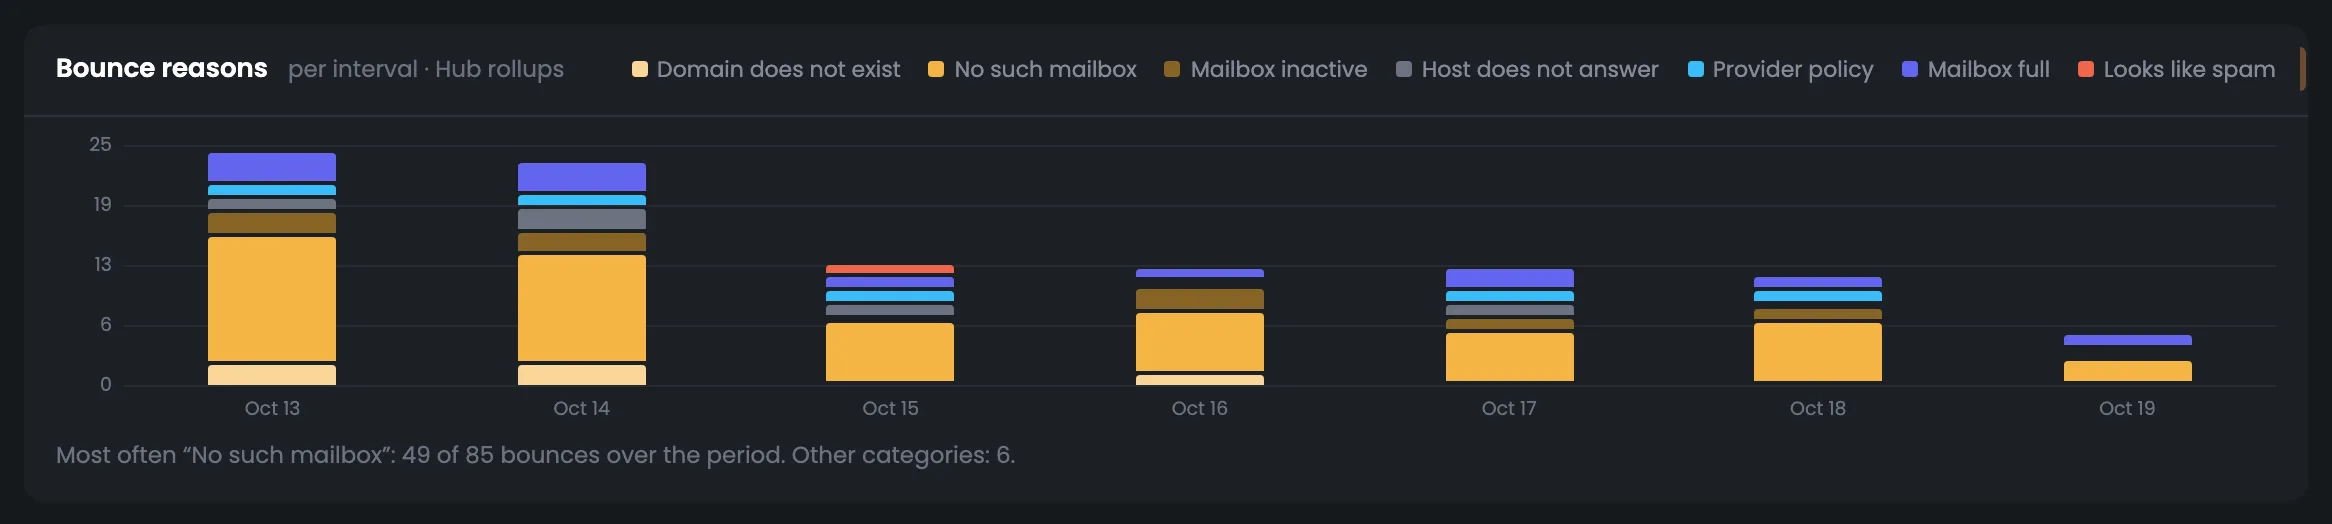
The bounce reasons chart breaks bounces down by interval and by meaning: no such mailbox, mailbox abandoned or full, domain does not exist, server not responding, mailbox provider requirements, looks like spam. Each reason has its own color, and the caption under the chart names the most frequent one. The screen answers the key question: is mail not arriving because of a dirty list or because of the sender's reputation? If the yellow reasons are growing, clean your list; if the red ones are, work on your email content and address reputation, starting with the mailbox provider responses on the “Deliverability” tab.
EnlargeScreen 13 · Bounce reasons. An example from the MTA-Hub interface.
Reasons — no such mailbox, mailbox abandoned or full, domain does not exist, server not responding, mailbox provider requirements, looks like spam.
Color — red for spam, yellow for bad addresses.
This shows where the problem lies: in the list or in reputation.
14
Queue, connections and throughput
From server measurements
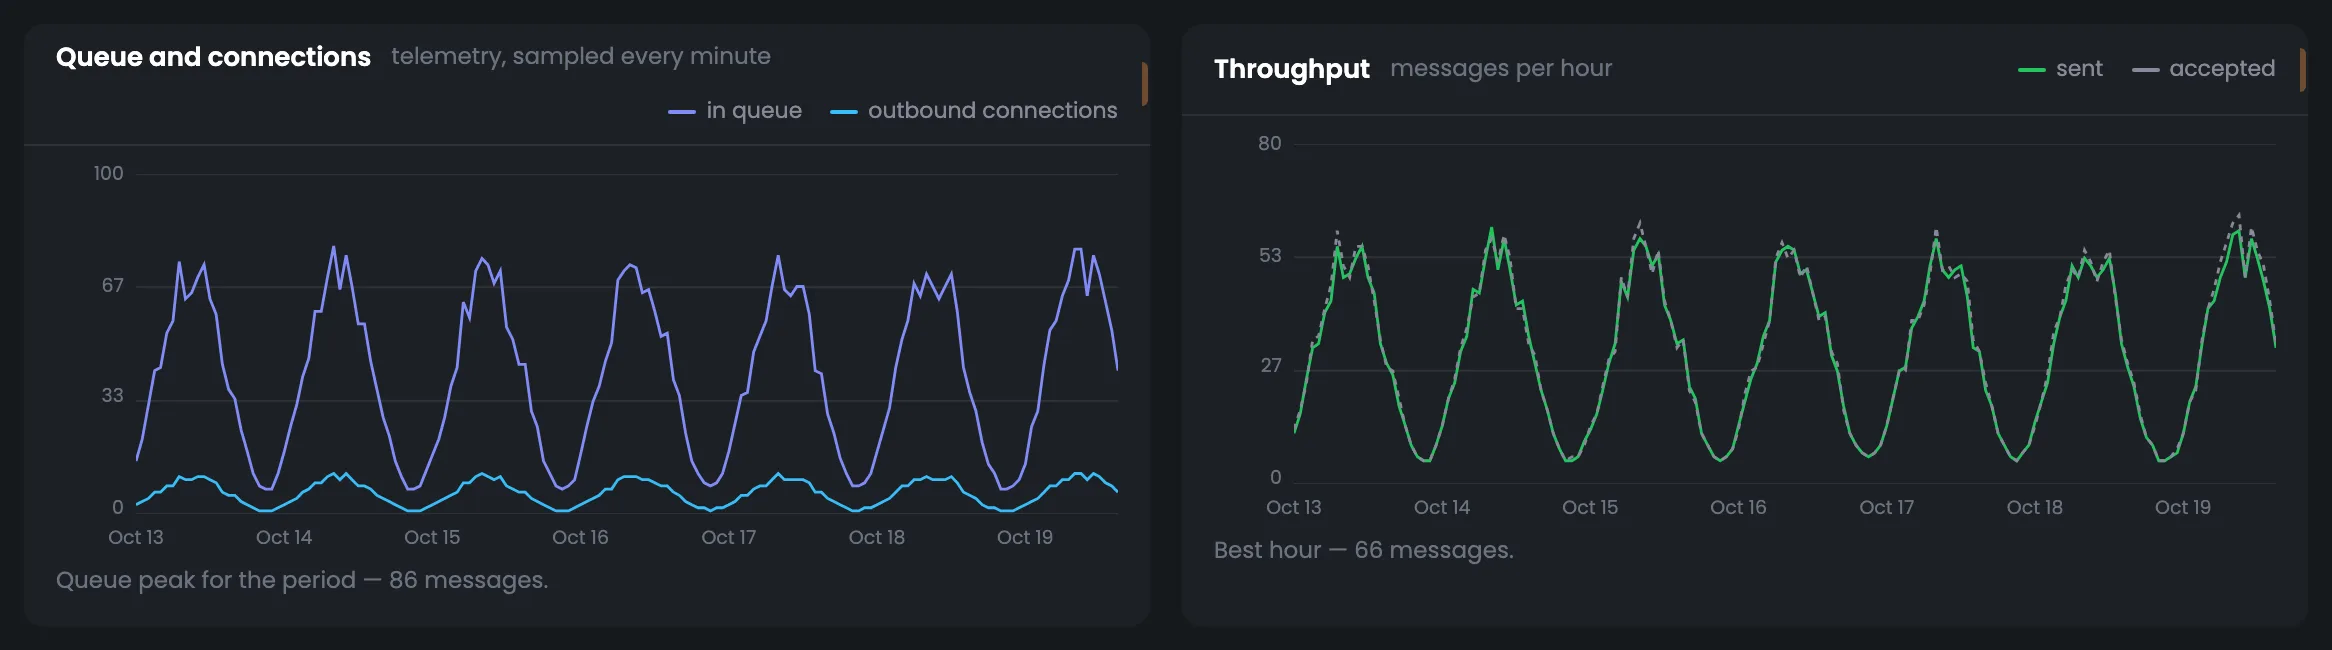
Charts of the queue, connections and throughput for the chosen period. On the left you see how many messages stood in the PowerMTA queue and how many outbound connections the MTA held; on the right — how many messages per hour were sent and received. If the queue grows but hourly sending does not grow with it, the server cannot keep up with the incoming flow, and it is time to look for a jam on the “Queues” tab. It is useful to compare the connection peak with the MTA's limit: if it hits the ceiling, sending is held back by the limit, not by mailbox providers. Choose the period of a slow-delivery complaint — the charts show whether the queue was piling up then.
EnlargeScreen 14 · Queue, connections and throughput. An example from the MTA-Hub interface.
Queue — how many messages stood in the queue.
Connections — how many outbound connections the MTA held.
Throughput — how many messages per hour were sent and received.
These charts are built from server measurements every minute, not from message accounting.
15
Load, memory and disk
The server over the period
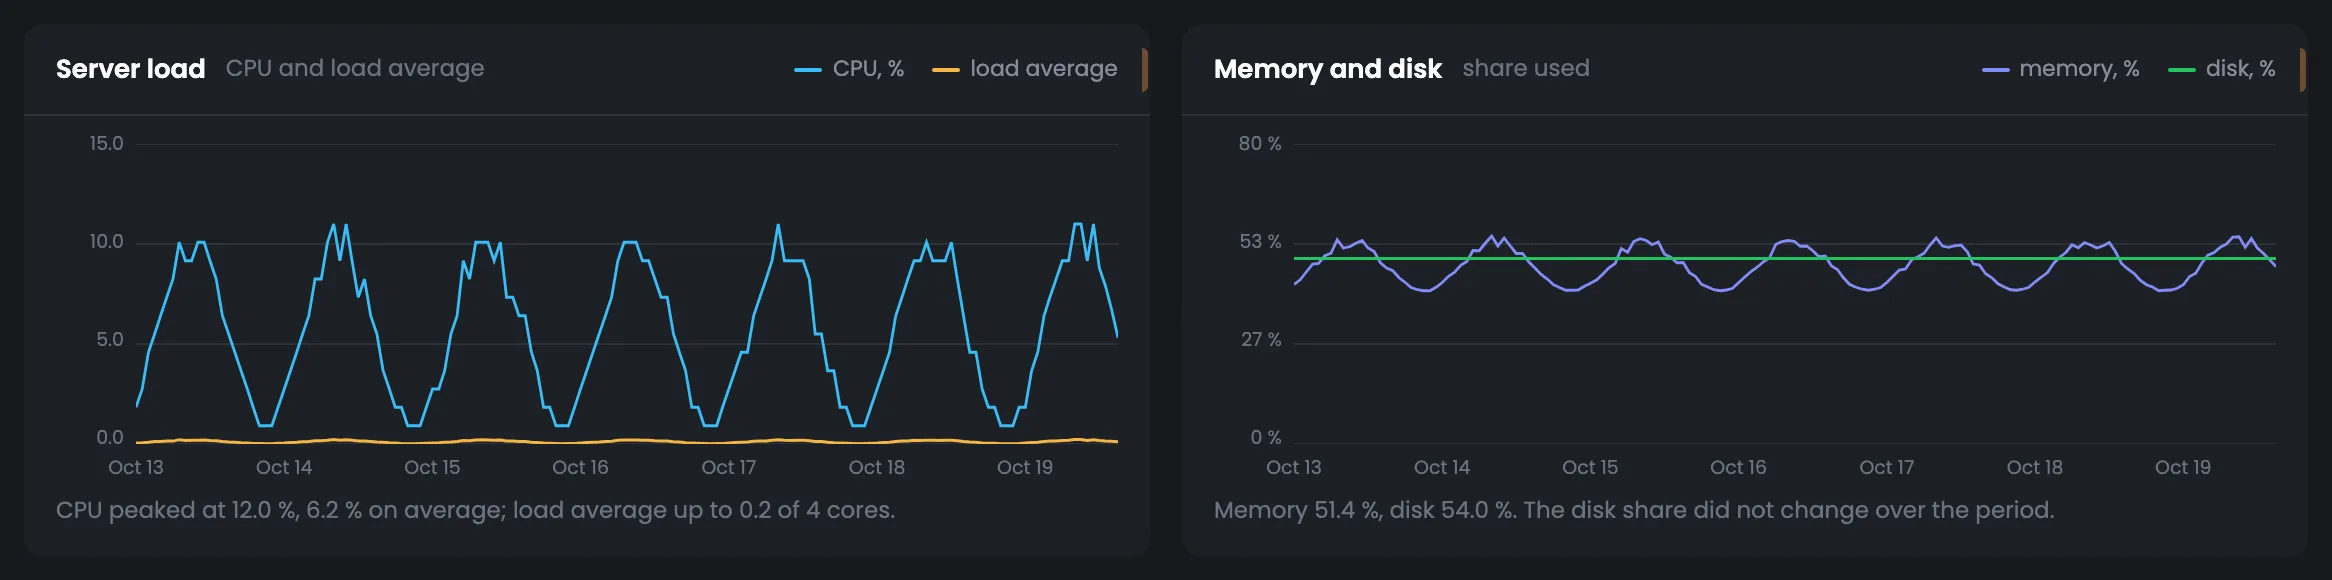
Load, memory and disk for the chosen period — what mail server monitoring shows next to the mail itself. The charts of CPU and load average, used memory and disk come with captions that put them into words: the CPU peak and average, whether disk usage changed. You do not need to study the curves to see whether the server has enough resources. If resources are at their limit, slow sending may be down to the server itself, not mailbox providers. If a disk or memory warning appears in the feed, look here: the chart shows whether usage is growing gradually or in a jump.
EnlargeScreen 15 · Load, memory and disk. An example from the MTA-Hub interface.
CPU — peak and average — the caption puts it into words.
Memory — used over the period.
Disk — whether usage changed.
A disk 80% full and memory at 90% go into the “What needs attention” feed.
Queues
4 screens
The “Queues” tab shows each PowerMTA queue as a separate row, plus two breakdowns: by recipient domain and by sending vMTA. They show where the jam is — at the mailbox provider or on your side. Right from the table you can pause a queue, slow it down or bring it back to normal pace. Clearing is the only irreversible action, and the Hub tells you in advance how many messages will be deleted.
16
Queues in six numbers
Queue totals
The “Queues” tab starts with six numbers — the totals for the whole PowerMTA queue. There are 41 messages totaling 1.4 MB in 25 queues, none paused, one in backoff — yahoo.com since 14:28. The last number names the largest queue along with its recipient domain and vMTA. This row tells you whether there is a jam and where it is biggest, even before you open the queue table. 25 connections are open right now. If a queue is in backoff, turn on the “in backoff” filter in the table below — it shows what the mailbox provider answered and since when. A “Paused” number above zero without a command from you is a reason to check the log on the “Control” tab.
EnlargeScreen 16 · Queues in six numbers. An example from the MTA-Hub interface.
Messages in queue — 41, 1.4 MB.
Queues with mail — 25 of 25.
Paused — 0 — nobody paused anything.
In backoff — 1 — yahoo.com since 14:28.
Connections — 25.
Largest — 6 messages — gmail.com · weekly.tidewaymedia.net-vmta.
The largest queue is visible at once — with its recipient domain and vMTA.
17
Queues
Recipient domain and vMTA
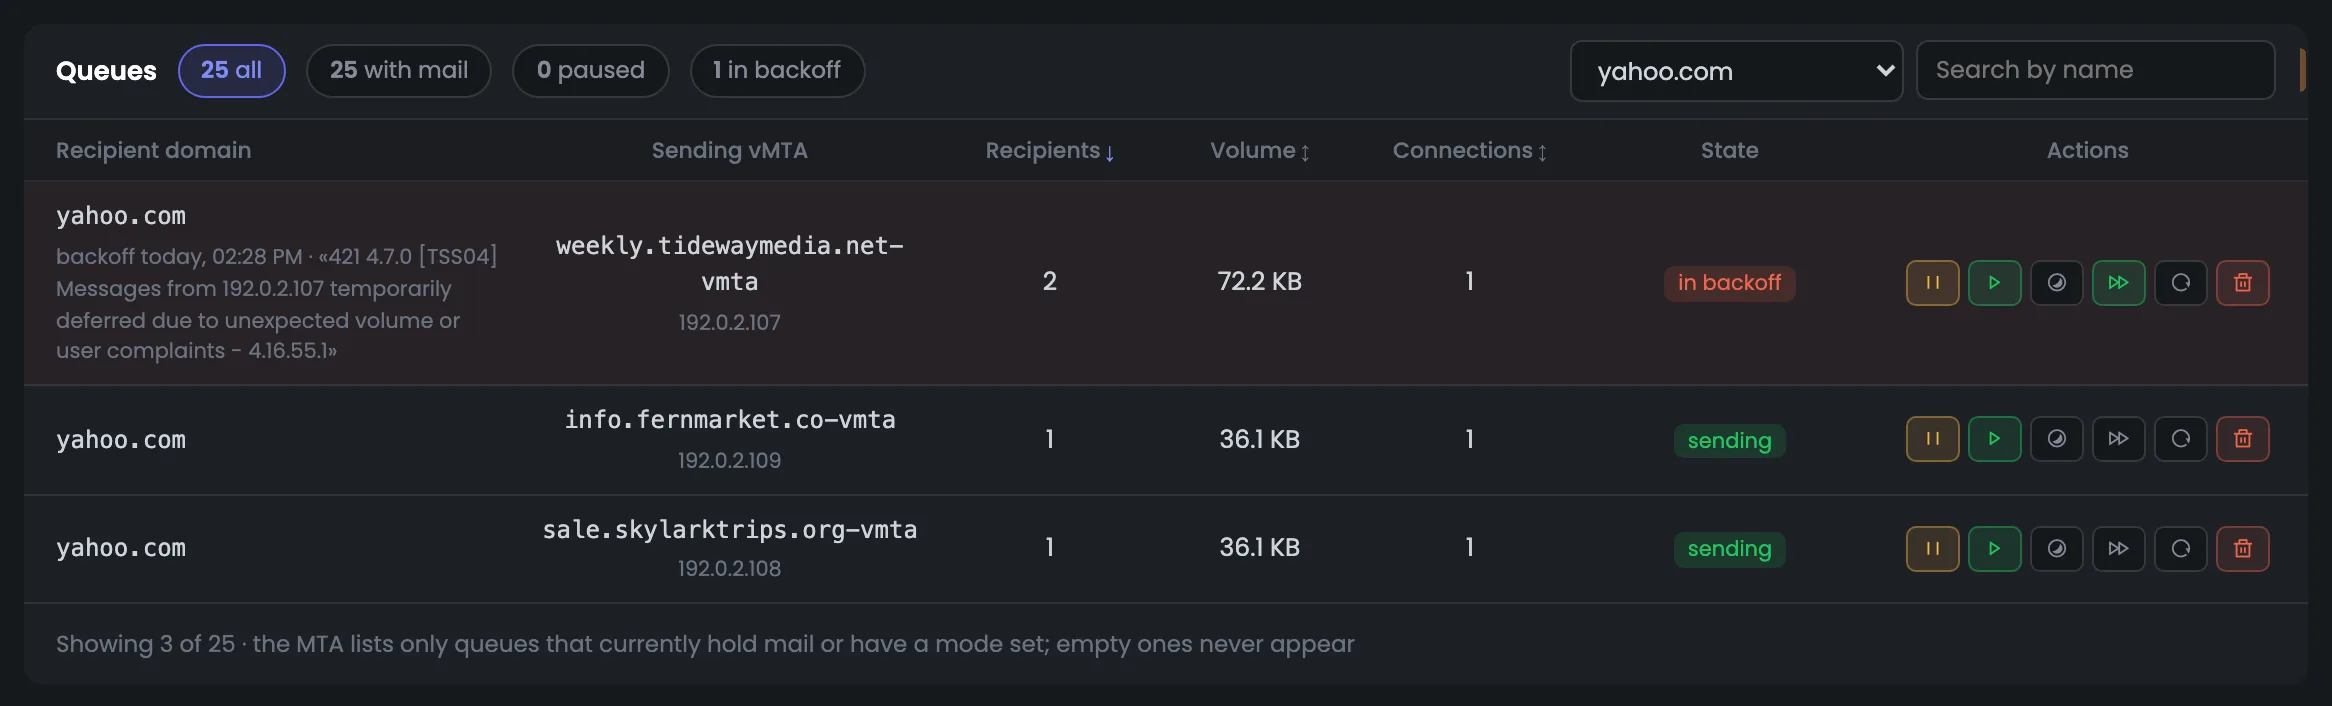
The queue table is the main screen of the tab: one row is one PowerMTA queue, that is, a “recipient domain / sending vMTA” pair, with recipients, volume, connections and state. Here yahoo.com is selected: one of its three queues is in backoff, and under the domain you see since when and what the mailbox provider answered. The buttons in a row pause, resume, put into backoff, restore normal pace or retry sending — reversible actions work at once, and the MTA's answer appears above the table. Before a command, check that the right domain and vMTA pair is selected: an action in a row affects only that queue.
EnlargeScreen 17 · Queues. An example from the MTA-Hub interface.
Filters — all, with mail, paused, in backoff; domain picker and search.
Row — recipients, volume, connections and state; for a queue in backoff — since when and what the mailbox provider answered.
Six buttons — pause, resume, backoff, normal pace, retry now, clear.
Clearing is the only irreversible action on the tab: the Hub first asks the MTA how many messages would be deleted and names that number in the confirmation.
18
Who it is addressed to
Queue by domain
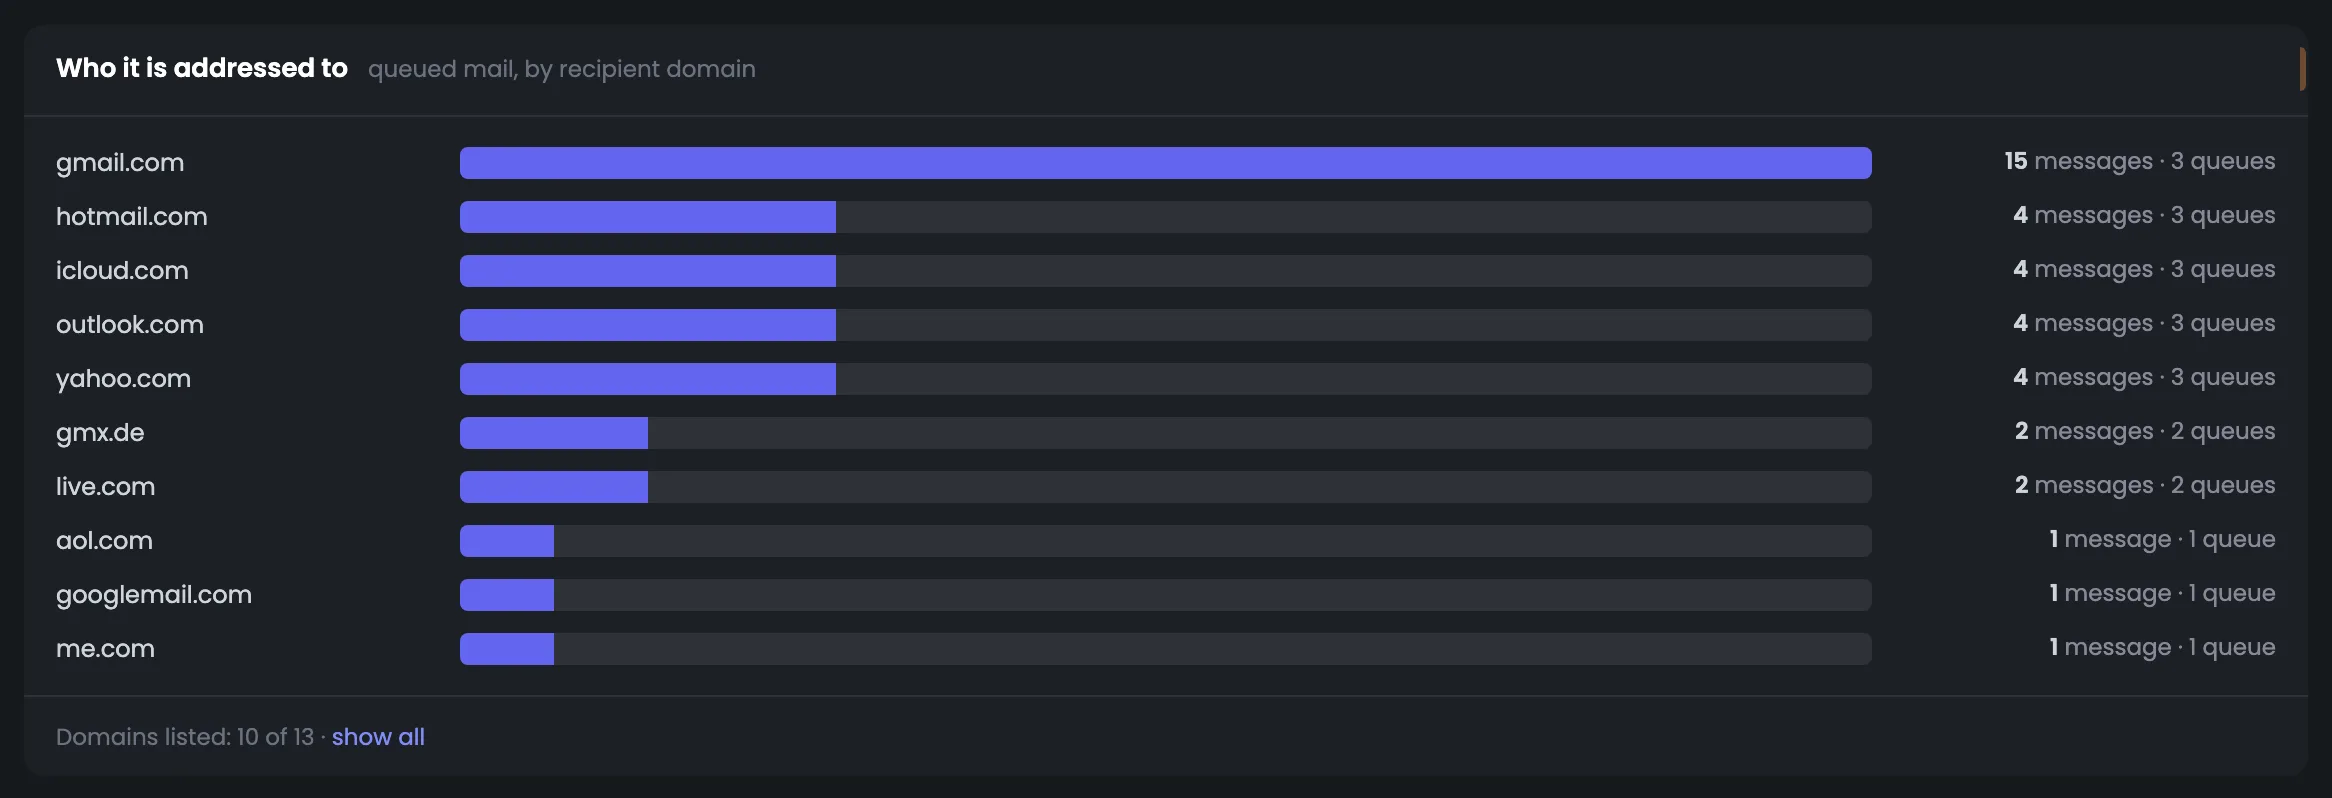
The “Who it is addressed to” breakdown adds up the queue by recipient domain: how many messages each domain is waiting for and across how many queues, with a bar showing the domain's share. The screen lets you quickly see whether mail has piled up at one provider. If most of the queue is for one domain while the rest go out evenly, the server is fine — you need to deal with that mailbox provider and its responses on the “Domains” tab. The breakdown comes in handy when the overall queue has grown and you need to know who the mail is for: the share bar shows the main recipient at once.
EnlargeScreen 18 · Who it is addressed to. An example from the MTA-Hub interface.
Domain — messages and number of queues.
Bar — the domain's share of the queue.
If mail has piled up at one domain, the problem is how its mailbox provider accepts your mail.
19
Which vMTAs
Queue by sending point
The breakdown by sending point shows the same queue from the other side: how many messages and across how many queues for each vMTA. In the screenshot, messages are spread across three vMTAs roughly in proportion to their number of queues — no noticeable jam at any single point. Compare this screen with the domain breakdown: together they quickly show whose side the jam is on. If one vMTA holds noticeably more messages than the others, check it on the “vMTAs and jobs” tab: its warm-up stage and daily cap may explain the jam. An empty queue at a vMTA is not a problem: it just means there is no mail for it right now.
EnlargeScreen 19 · Which vMTAs. An example from the MTA-Hub interface.
A jam at one vMTA across different domains means the problem is on your side: warm-up, a speed limit or the address's reputation.
Domains
4 screens
The “Domains” tab looks at sending from two sides. Recipient domains — who mail is going to right now and what those domains have answered over eight days, with mailbox provider codes and words. Your sending domains — how much was sent over 30 days, the delivered share, bounces, complaints and the DKIM signature. This is where you find which provider or which of your domains has delivery problems.
20
Domains in five numbers
Domain totals
The “Domains” tab opens with five numbers that tell you at once whether there is anything to worry about with your domains. They show how many recipient domains are waiting for mail right now, how many of them gave bounces, deferrals or complaints over eight days, how many sending domains you have, which one delivers worst and how many bounces there were in the period. If the number of problem domains grows, the next screens show which ones and what they answer. Come here after a delivery complaint about a specific provider or when bounces have grown in the page header.
EnlargeScreen 20 · Domains in five numbers. An example from the MTA-Hub interface.
Domains in queue — how many recipient domains are waiting for mail.
With problems — gave bounces, deferrals or complaints over eight days.
Sending domains — all signed with DKIM.
Worst sending domain — by delivered share.
Bounces over the period — out of all sends.
The top row shows whether there is anything to worry about at all.
21
Who it goes to right now
Domains in the queue
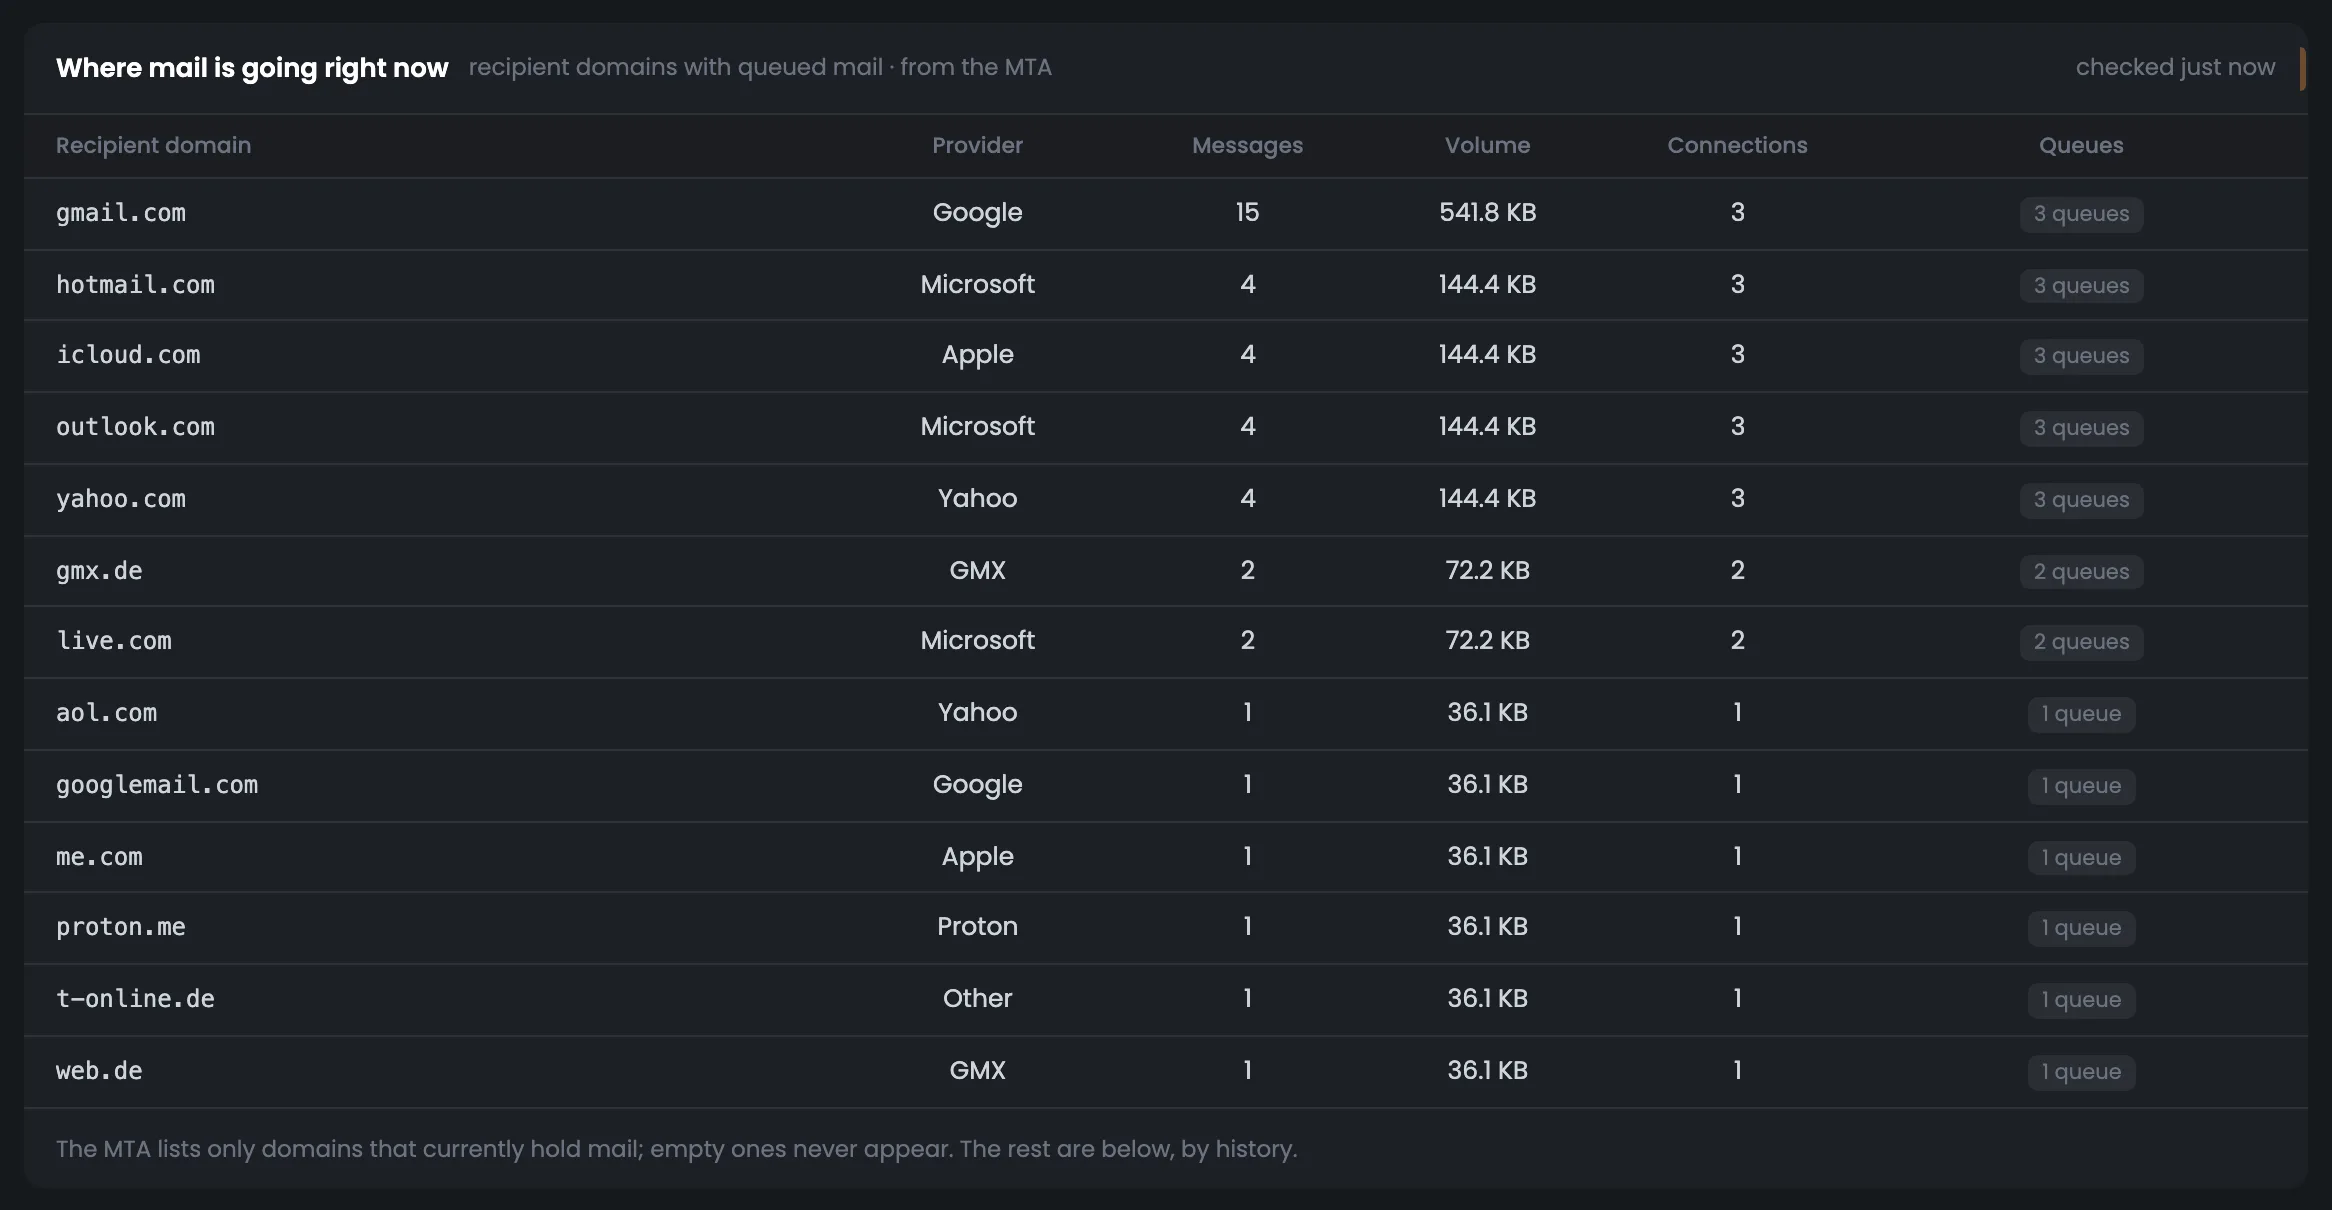
The “Who it goes to right now” screen lists recipient domains whose mail is in the queue right now, from the live MTA response. For each domain you see the mailbox provider, the number of messages, volume, connections and how many queues are open to it; the busiest come first. This is the current picture of sending: which providers are getting the main flow this minute. If an unexpected domain is at the top, check which campaign is loading it. Compare this screen with the response log below: a domain with a big queue and fresh bounces needs attention first. The number of connections to a domain shows how actively the MTA is trying to deliver right now.
EnlargeScreen 21 · Who it goes to right now. An example from the MTA-Hub interface.
Domain row — mailbox provider, messages, volume, connections and number of queues.
Order — busiest first.
The MTA does not show domains with no mail; the others are below, by history.
22
What recipient domains answer
Eight-day log
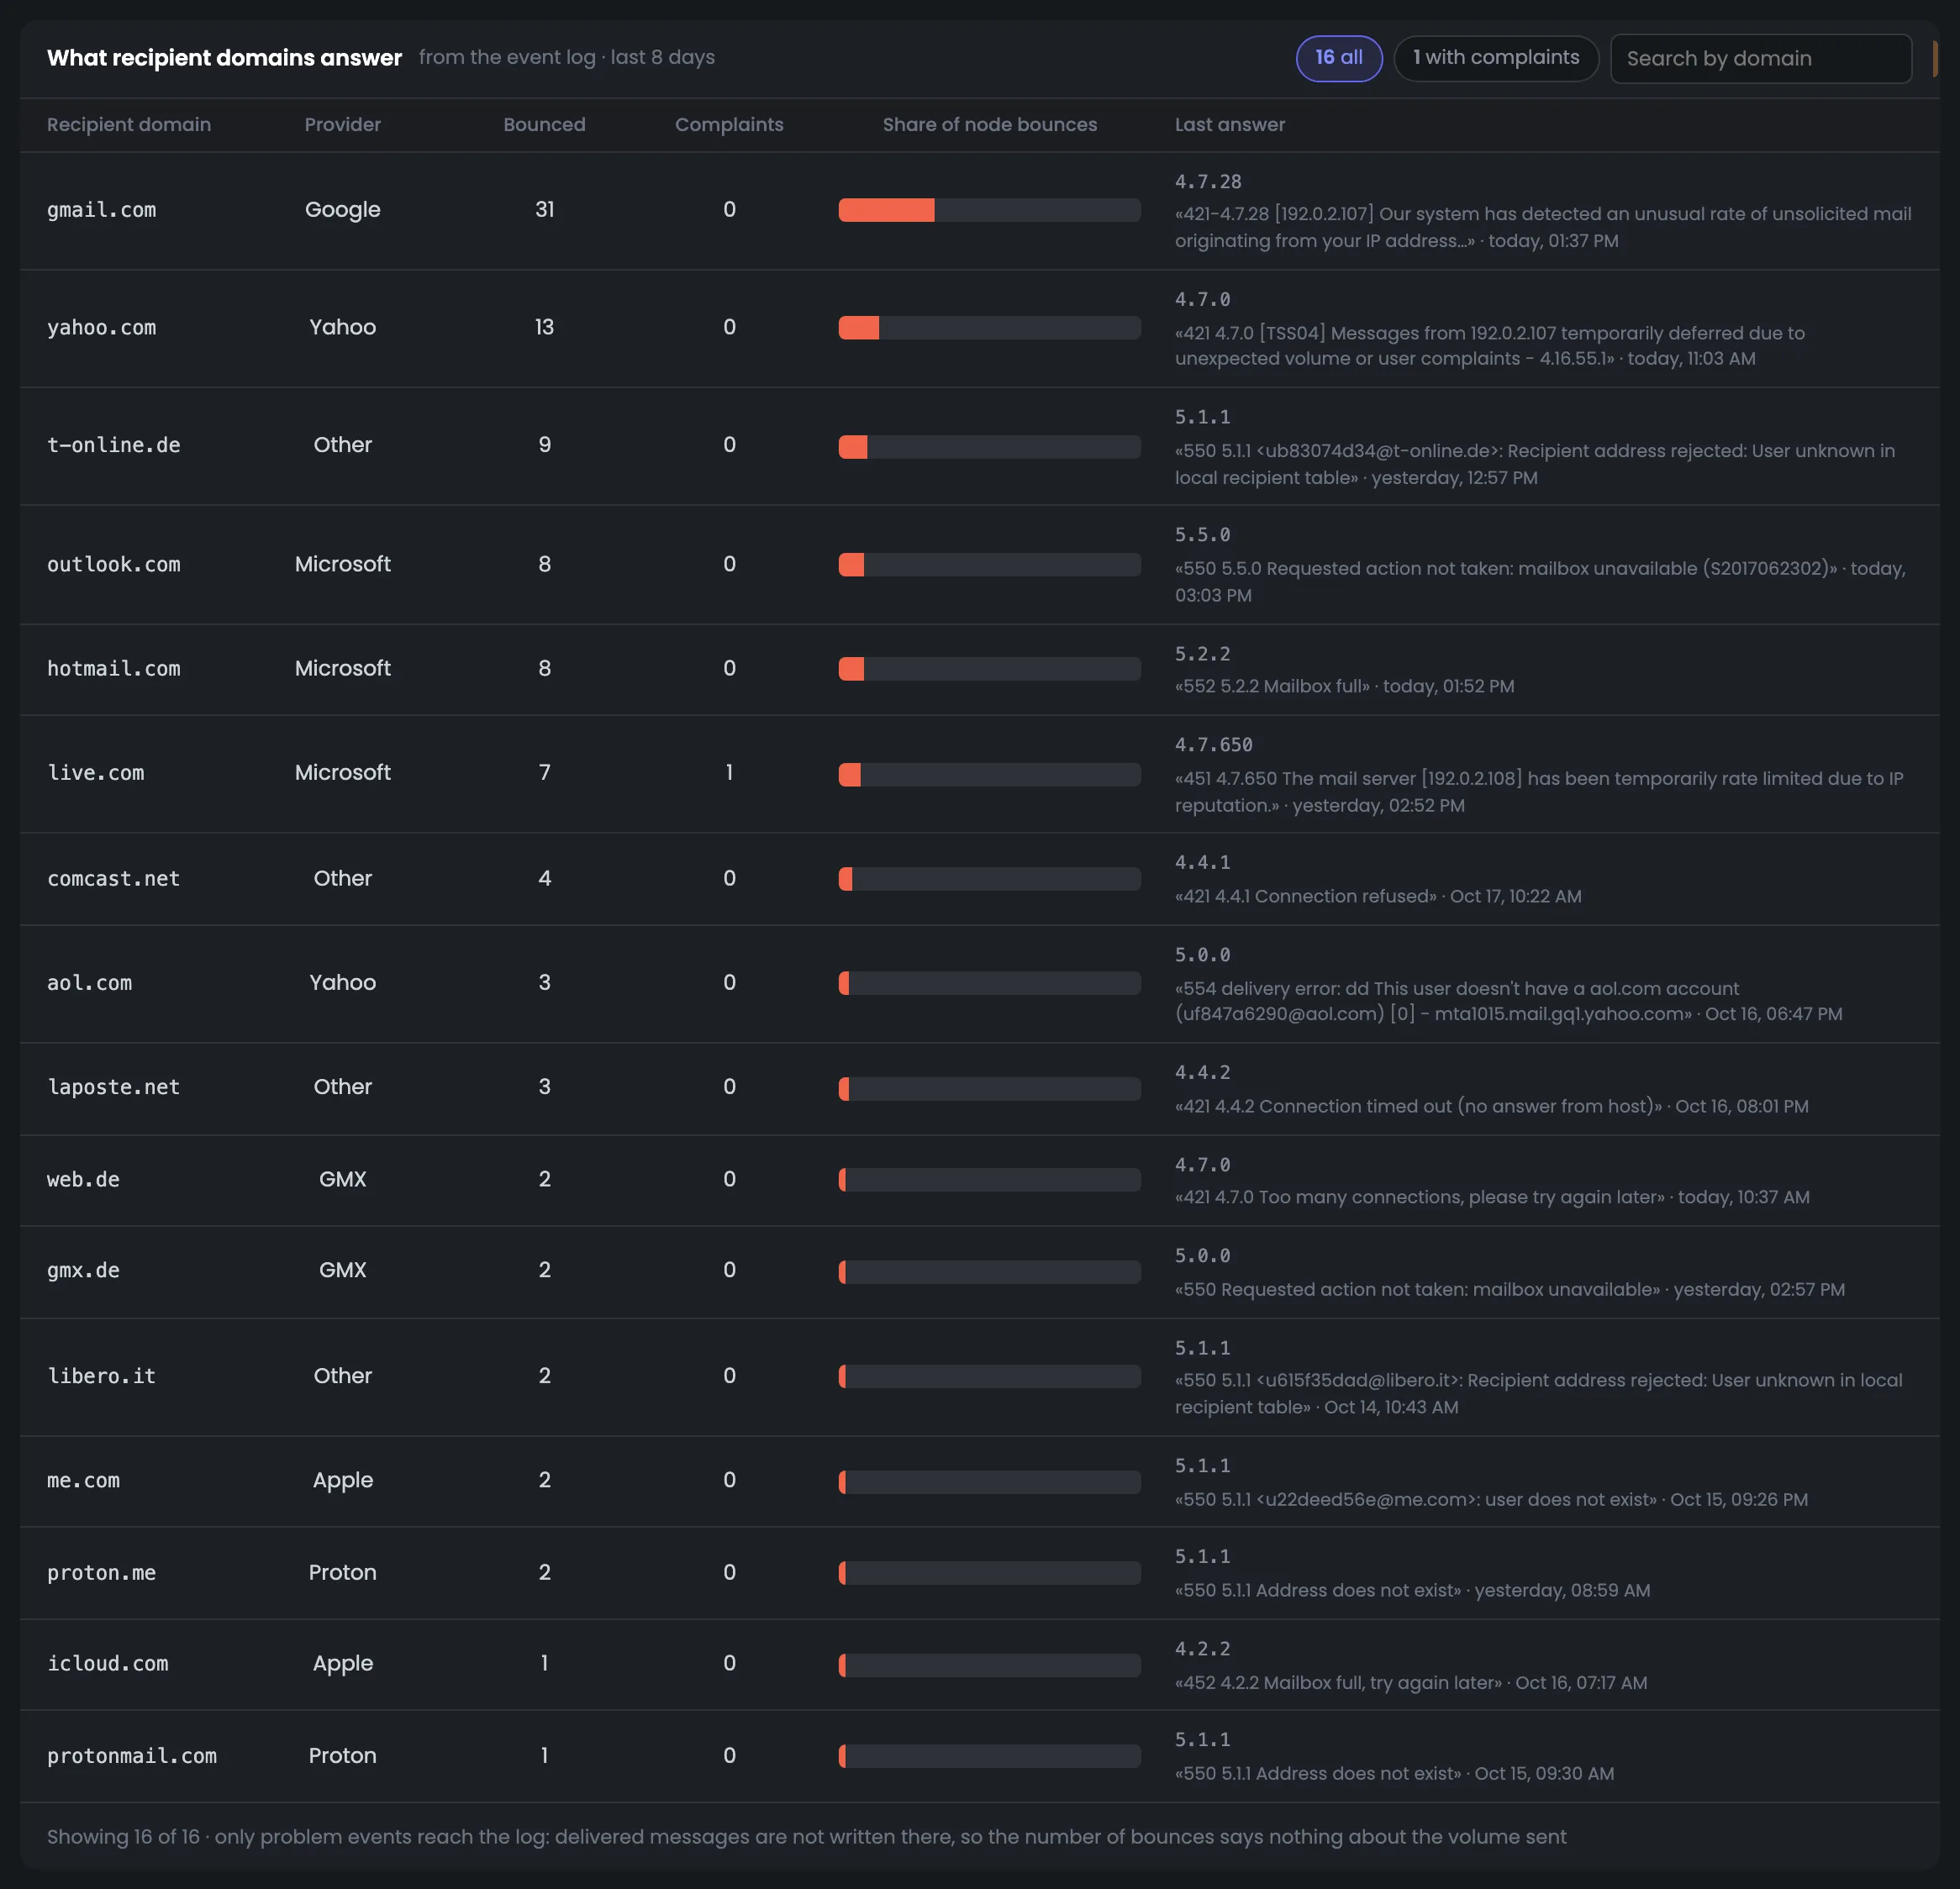
The eight-day log of recipient domain responses is the main tool when mail is being rejected. For each domain you see the number of bounces and complaints, its share of all the server's bounces and the mailbox provider's last response: the code, the words and the time. The “with complaints” filter leaves only domains where recipients complained, and search finds the domain you need. Start with the domains that have the largest share of bounces: the provider's last response usually names the reason outright. You can then dig into the bounce code you found on the “Deliverability” tab, which shows which vMTA the message went from and whether the response affects the score.
EnlargeScreen 22 · What recipient domains answer. An example from the MTA-Hub interface.
Bounces and complaints — for each recipient domain.
Share — the domain's share of all the server's bounces.
Last response — code, the mailbox provider's words and time.
Filters — “with complaints” and search.
Delivered messages are not written to this log, so the bounce count here says nothing about overall volume — shares of all messages are on the “Charts” tab.
23
Sending domains
Your domains over 30 days
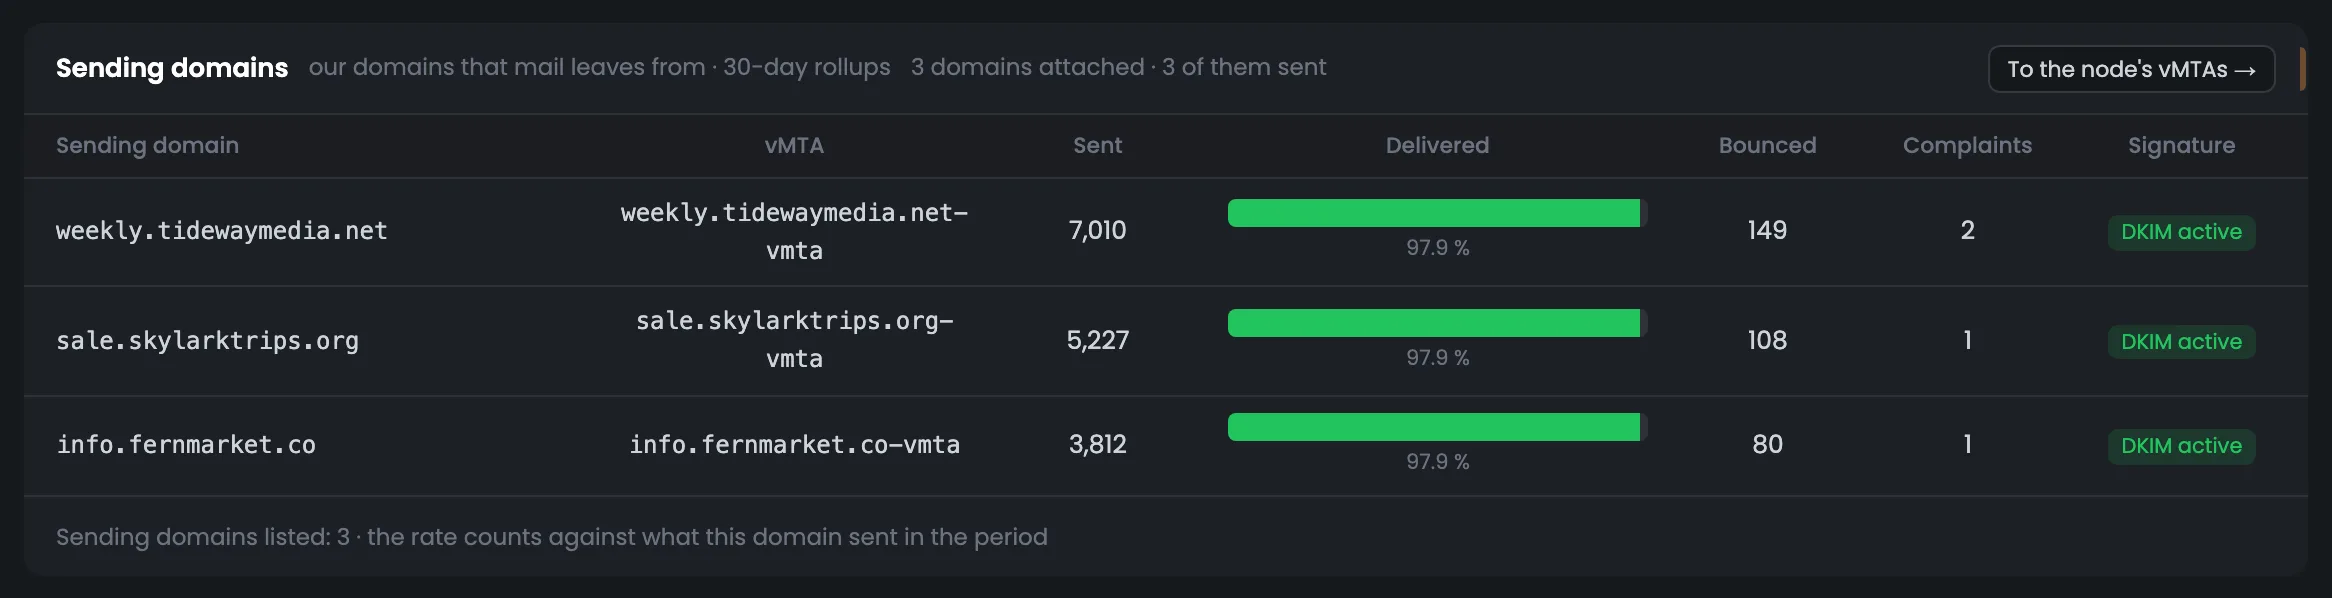
Sending domains are your own domains over 30 days; they show how mailbox providers accept each of them. For each domain you see the vMTA, how many messages were sent, the delivered share, bounces, complaints and whether it is signed with DKIM. The screen lets you compare domains with each other: if one delivers noticeably worse than the rest, look into it separately. A domain without a signature stands out at once in the DKIM column. The screen helps when you have added a new domain or are deciding which domain to load more: the delivered share and complaints over 30 days show which domain mailbox providers accept better.
EnlargeScreen 23 · Sending domains. An example from the MTA-Hub interface.
If one domain delivers worse than the rest, the cause is its reputation.
vMTAs and jobs
4 screens
The “vMTAs and jobs” tab shows the server's virtual sending points from three sources at once: the Hub's settings, the MTA's response and 30 days of history. Next to them — address ramp-up under the warm-up plan with daily caps, and campaigns sent with a job name. The tab shows how each IP address sends, warms up and delivers.
24
vMTAs in five numbers
vMTA totals
The “vMTAs and jobs” tab starts with five numbers about the server's sending points. The node has 3 vMTAs, all from the Hub's configuration, and all three are ramping up across two warm-up stages; there are 41 messages in the queue, and the MTA is running 3 jobs. Instead of the worst vMTA by delivery there is a dash — meaning there is no noticeable difference between the addresses. This row shows how many addresses are still warming up and how busy the server is with campaigns right now. Open the tab when new addresses are going through warm-up or you need to know which campaign is occupying the server; if the worst vMTA is named, start with it.
EnlargeScreen 24 · vMTAs in five numbers. An example from the MTA-Hub interface.
vMTAs on the node — 3 — all from the Hub's configuration.
Ramping up — 3, stages — 2.
Messages in queue — 41 across 3 vMTAs.
Worst by delivery — a dash — no differences.
Jobs running — 3 — the MTA is running campaigns.
A dash instead of the worst vMTA is an honest answer: there is no noticeable difference between them.
25
Node vMTAs
Three sources in one table
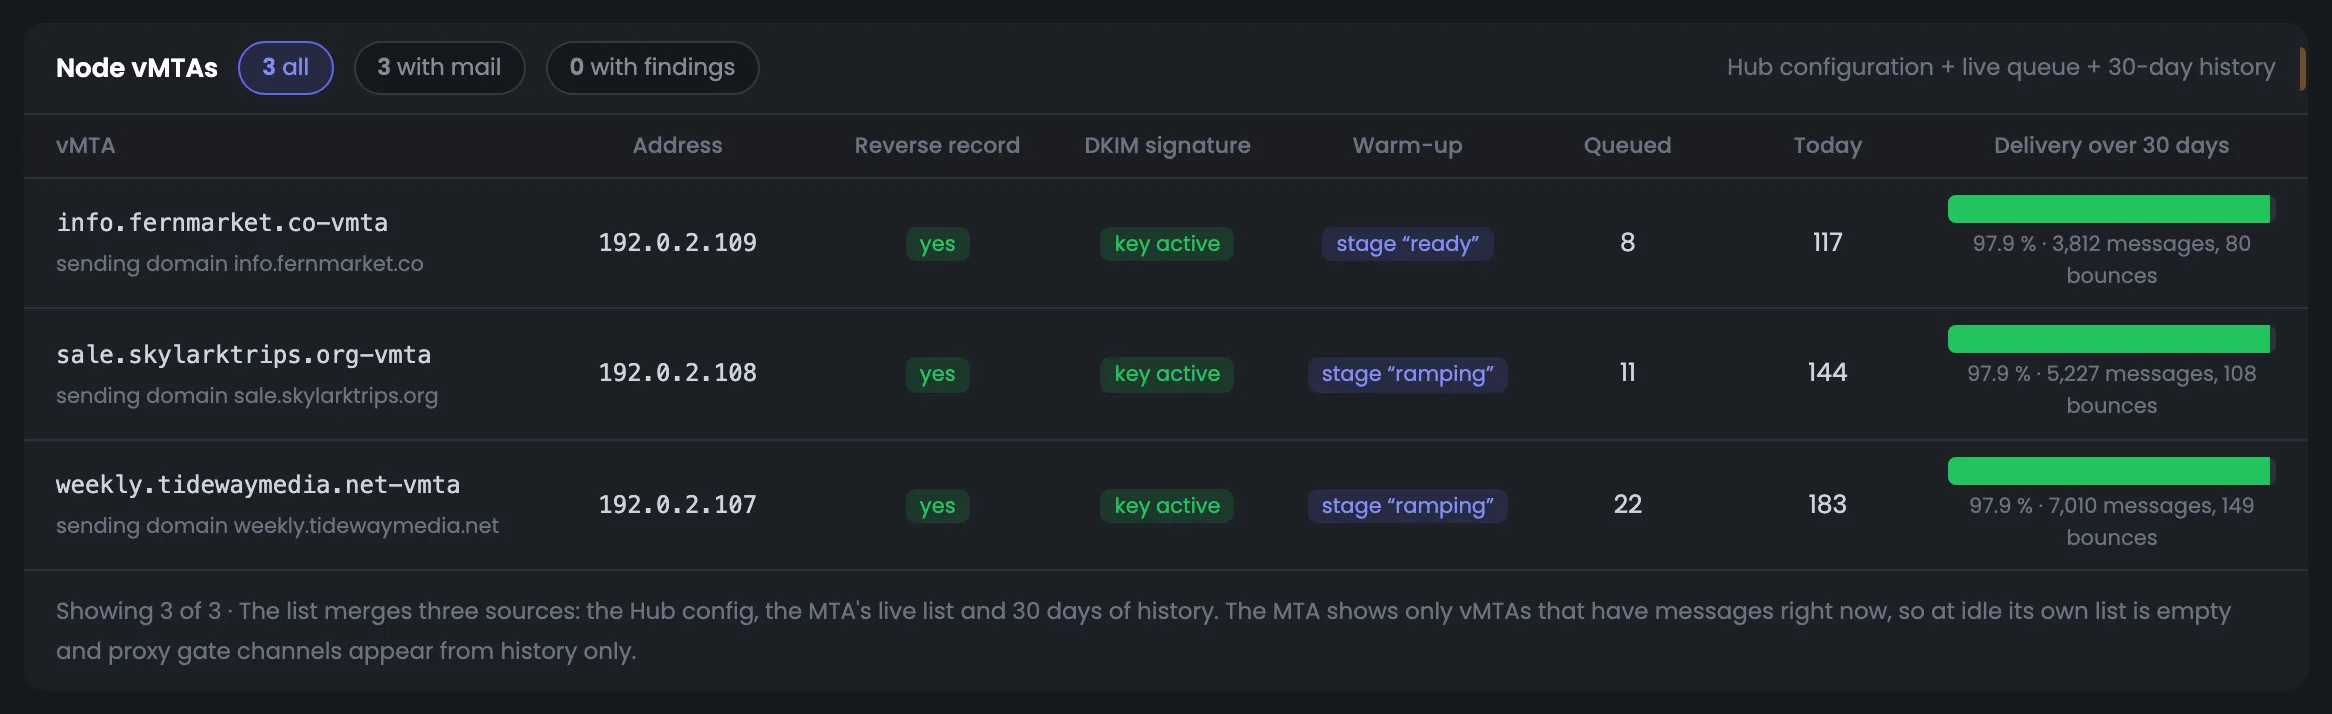
The node's vMTA table brings three sources together: the Hub's settings, the current list from the MTA and 30 days of delivery history. For each address you see whether it has a reverse DNS (PTR) record, whether the DKIM key is active, which warm-up stage it is at, how many messages are waiting, how many went out today and how mail was delivered over the month. The “with findings” filter leaves only the vMTAs worth fixing before the next campaign. This is the main screen for checking addresses before a launch: every vMTA should have a PTR and an active DKIM key. If one address delivers worse over 30 days, check its warm-up stage on the next screen.
EnlargeScreen 25 · Node vMTAs. An example from the MTA-Hub interface.
Address and PTR — the address and whether there is a reverse DNS record.
DKIM — whether the signing key is active.
Warm-up — the ramp-up stage.
Queue and sending — queued, sent today, delivery over 30 days.
Filters — all, with mail, with findings.
“With findings” — vMTAs without a reverse DNS record or with an inactive signing key.
26
Address ramp-up
The warm-up plan's daily cap
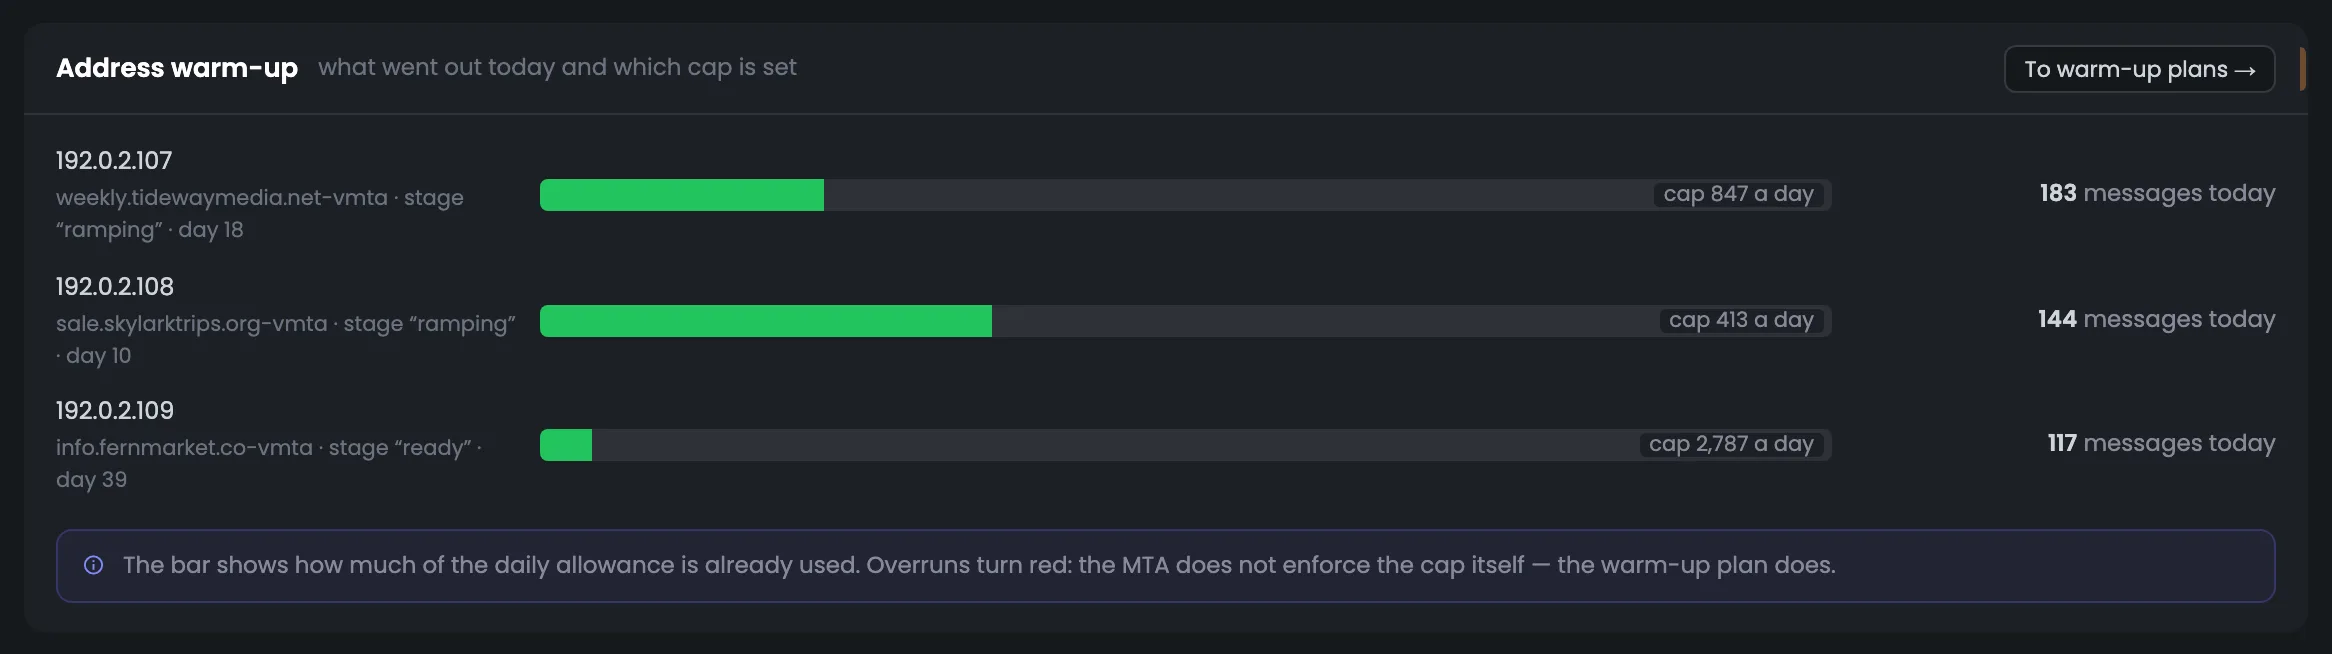
The “Address ramp-up” screen shows how each IP address is progressing through its warm-up plan. For each address you see how many messages went out today, what daily cap the plan set, and which warm-up stage and day the address is on. If today's sending exceeded the cap, the row is highlighted in red — easy to spot. The screen answers whether a campaign is loading young addresses too early. If a row is red, check the plan in the “Warm-up” section and the campaign sending from that address. The warm-up stage and day show how much of the plan the address still has left.
EnlargeScreen 26 · Address ramp-up. An example from the MTA-Hub interface.
Today — how many messages went out from the address.
Cap — the warm-up plan's daily cap.
Stage and day — which step the address is on.
This cap is enforced by the warm-up plan, not by the MTA itself, so going over it is highlighted in red.
27
Jobs
Campaigns with a job name
The “Jobs” screen shows campaigns sent with a job name, from the live MTA response. For each job you see how many recipients are still waiting in the queue, how much volume it takes up and how many connections it holds; in the screenshot, the MTA is running three jobs. This helps you link server load to a specific campaign: if the queue has grown, you see right away which job created it and how much it still has to send. Open the screen after launching a big campaign to make sure the MTA has accepted it and is sending. If the server is overloaded and you do not recognize a job, look it up by name in your email platform.
EnlargeScreen 27 · Jobs. An example from the MTA-Hub interface.
Job — the campaign name.
Waiting — how many recipients are still in the queue.
Volume and connections — for each job.
This shows which campaign is loading the server right now.
Deliverability
4 screens
The “Deliverability” tab is the server's score over 30 days and a detailed breakdown of what it is made of. It has five components with weights, bounce reasons and the mailbox providers' responses with codes, word for word. The calculation is the same as in “Analytics”, so one server's score matches the overall picture.
28
Deliverability in five numbers
Score and shares
The “Deliverability” tab starts with five numbers over 30 days — the overall score of the sending server. The node score is 93, normal; 97.9% delivered, that is, 15,712 messages out of 16,049; spam and complaints below 0.1%, and this share only turns red from 0.3%. The last number says whether enough messages were sent for a fair score — here there are. If the score is below normal, the next screen shows exactly what drags it down. Check the tab after changes in your sending — a new list, a new domain, a new address. Look at the spam and complaint share first: only it and a major blacklist turn the score red.
EnlargeScreen 28 · Deliverability in five numbers. An example from the MTA-Hub interface.
Node score — 93 — normal.
Delivered — 97.9% — 15,712 of 16,049.
Spam and complaints — below 0.1% — 8 events, red from 0.3%.
Total bounces — 337 — 4 “spam” and 333 other.
Sent — 16,049 — enough volume for a score.
If there are too few messages, the tile says so: not enough volume for a score.
29
How the score adds up
Five components with weights
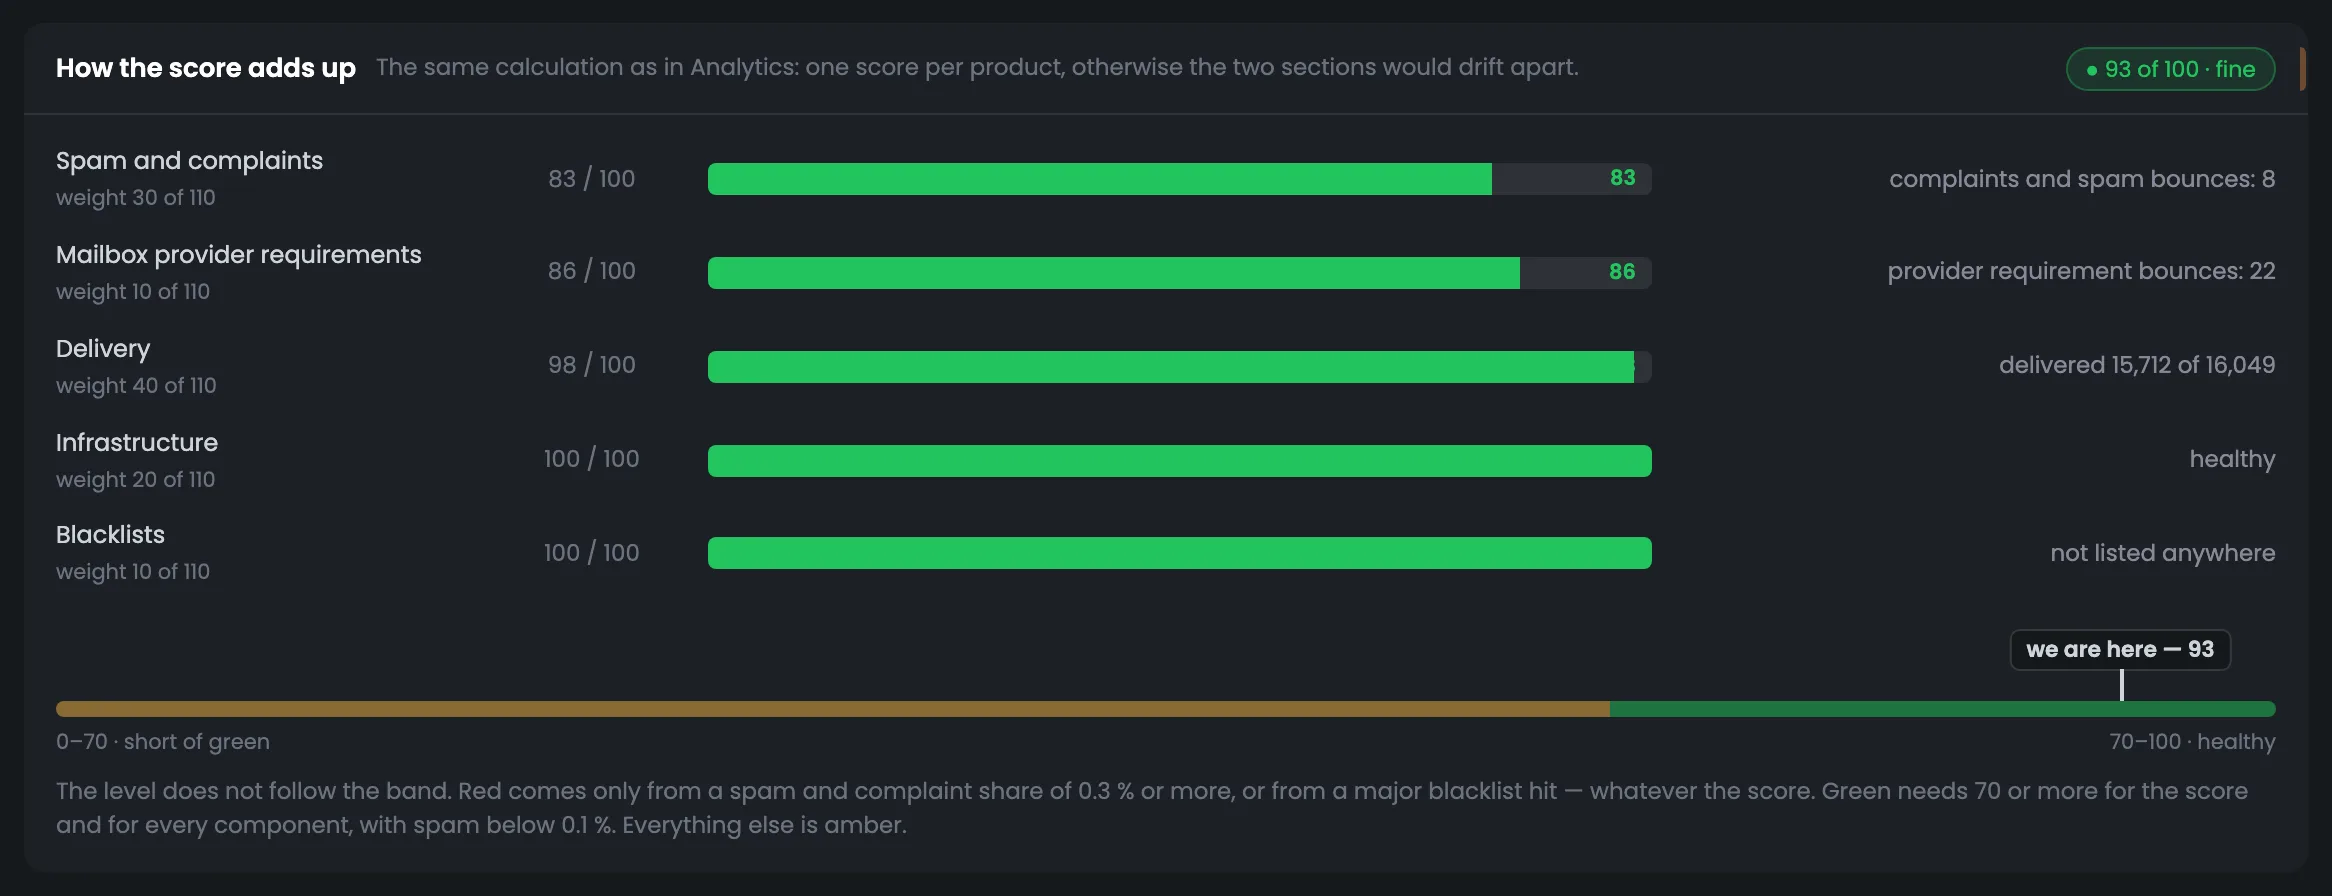
This screen explains what the server's score is made of — no “black box”. Five components with weights: deliverability, spam and complaints, infrastructure, mailbox provider requirements and blacklists; each has its own score, and the total here is 93 out of 100. Below — a scale with a “we are here” mark and the color rule in words. If there is something to fix — spam above the green threshold or delivery below 95% — a “What drags it down and what to do” block appears; there is none here. Start with the component with the lowest score: here it is spam and complaints — 83 out of 100 at a weight of 30, and improving it will raise the total the most.
EnlargeScreen 29 · How the score adds up. An example from the MTA-Hub interface.
Spam and complaints — weight 30 — 83 out of 100.
Mailbox provider requirements — weight 10 — 86.
Deliverability — weight 40 — 98.
Infrastructure — weight 20 — 100.
Blacklists — weight 10 — 100.
Total — 93 out of 100 — normal.
Only two things turn it red: a spam and complaint share of 0.3% or more, or a major blacklist; green is when both the score and every component are 70 or above and spam is below 0.1%. The calculation is the same as in “Analytics”.
30
Bounce reasons
Over 30 days
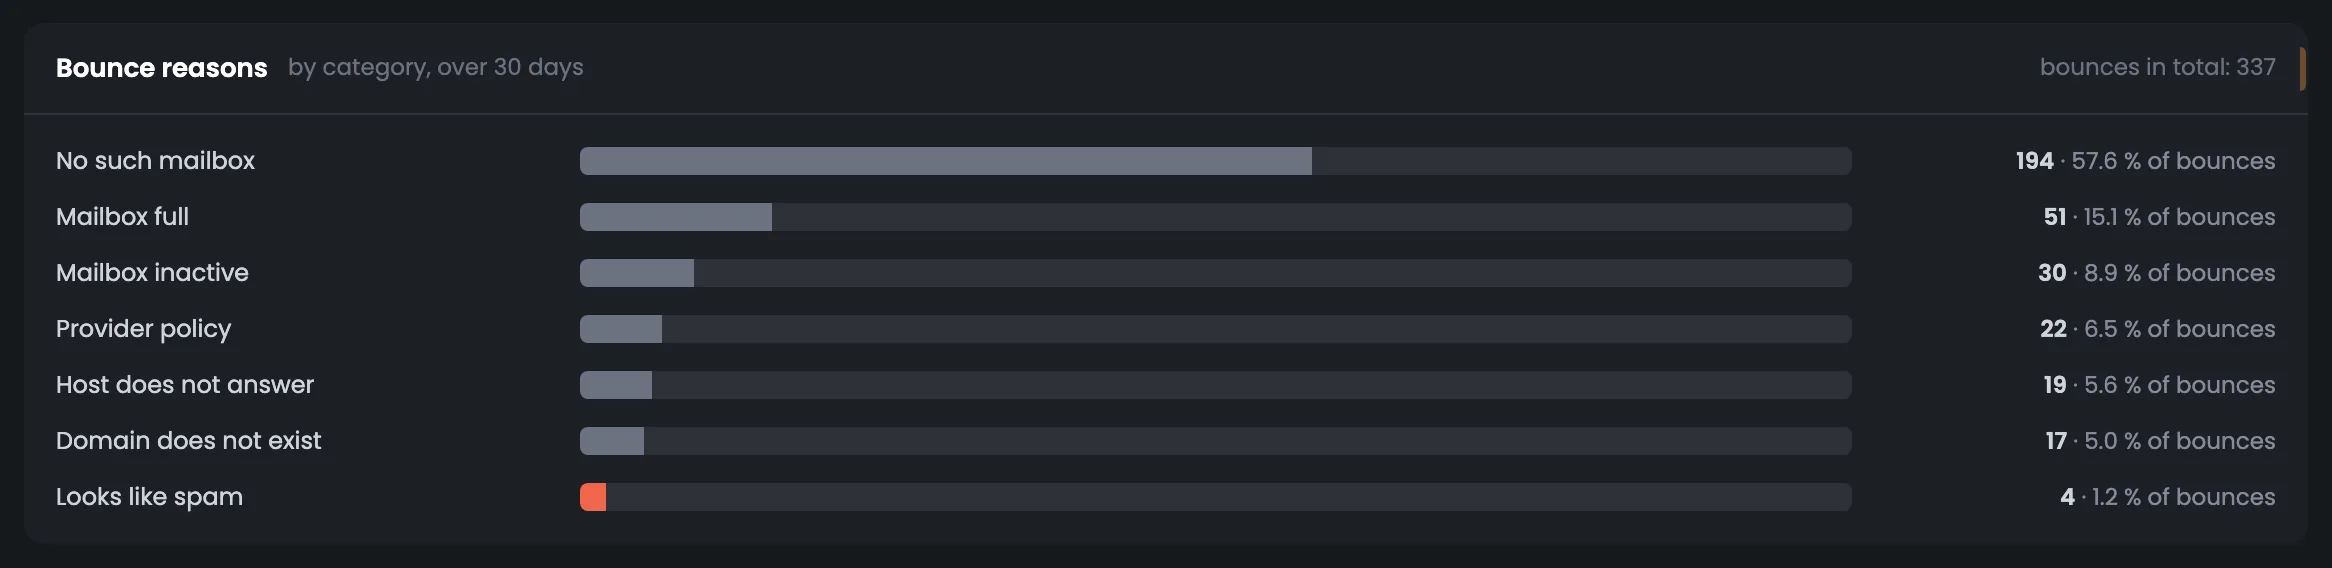
Bounce reasons over 30 days — the same breakdown as on the charts, but as a monthly total with the share of each reason. Spam-related reasons are highlighted in red because they are the ones that affect the server's score. The screen helps you decide what to tackle first: bad addresses in your list or spam bounces. If “no such mailbox” is a big reason, it is time to clean your list — that will raise the delivered share. Specific codes and mailbox provider words are on the next screen. It is handy to look at this screen together with the five numbers at the top of the tab: it explains what the bounce count in the tile is made of.
EnlargeScreen 30 · Bounce reasons. An example from the MTA-Hub interface.
Reasons — from “no such mailbox” to “looks like spam”.
Red — spam-related reasons — they are the ones that affect the score.
Bad addresses drag down the delivered share, and spam drags down the score.
31
Receiver response codes
The mailbox provider's words, verbatim
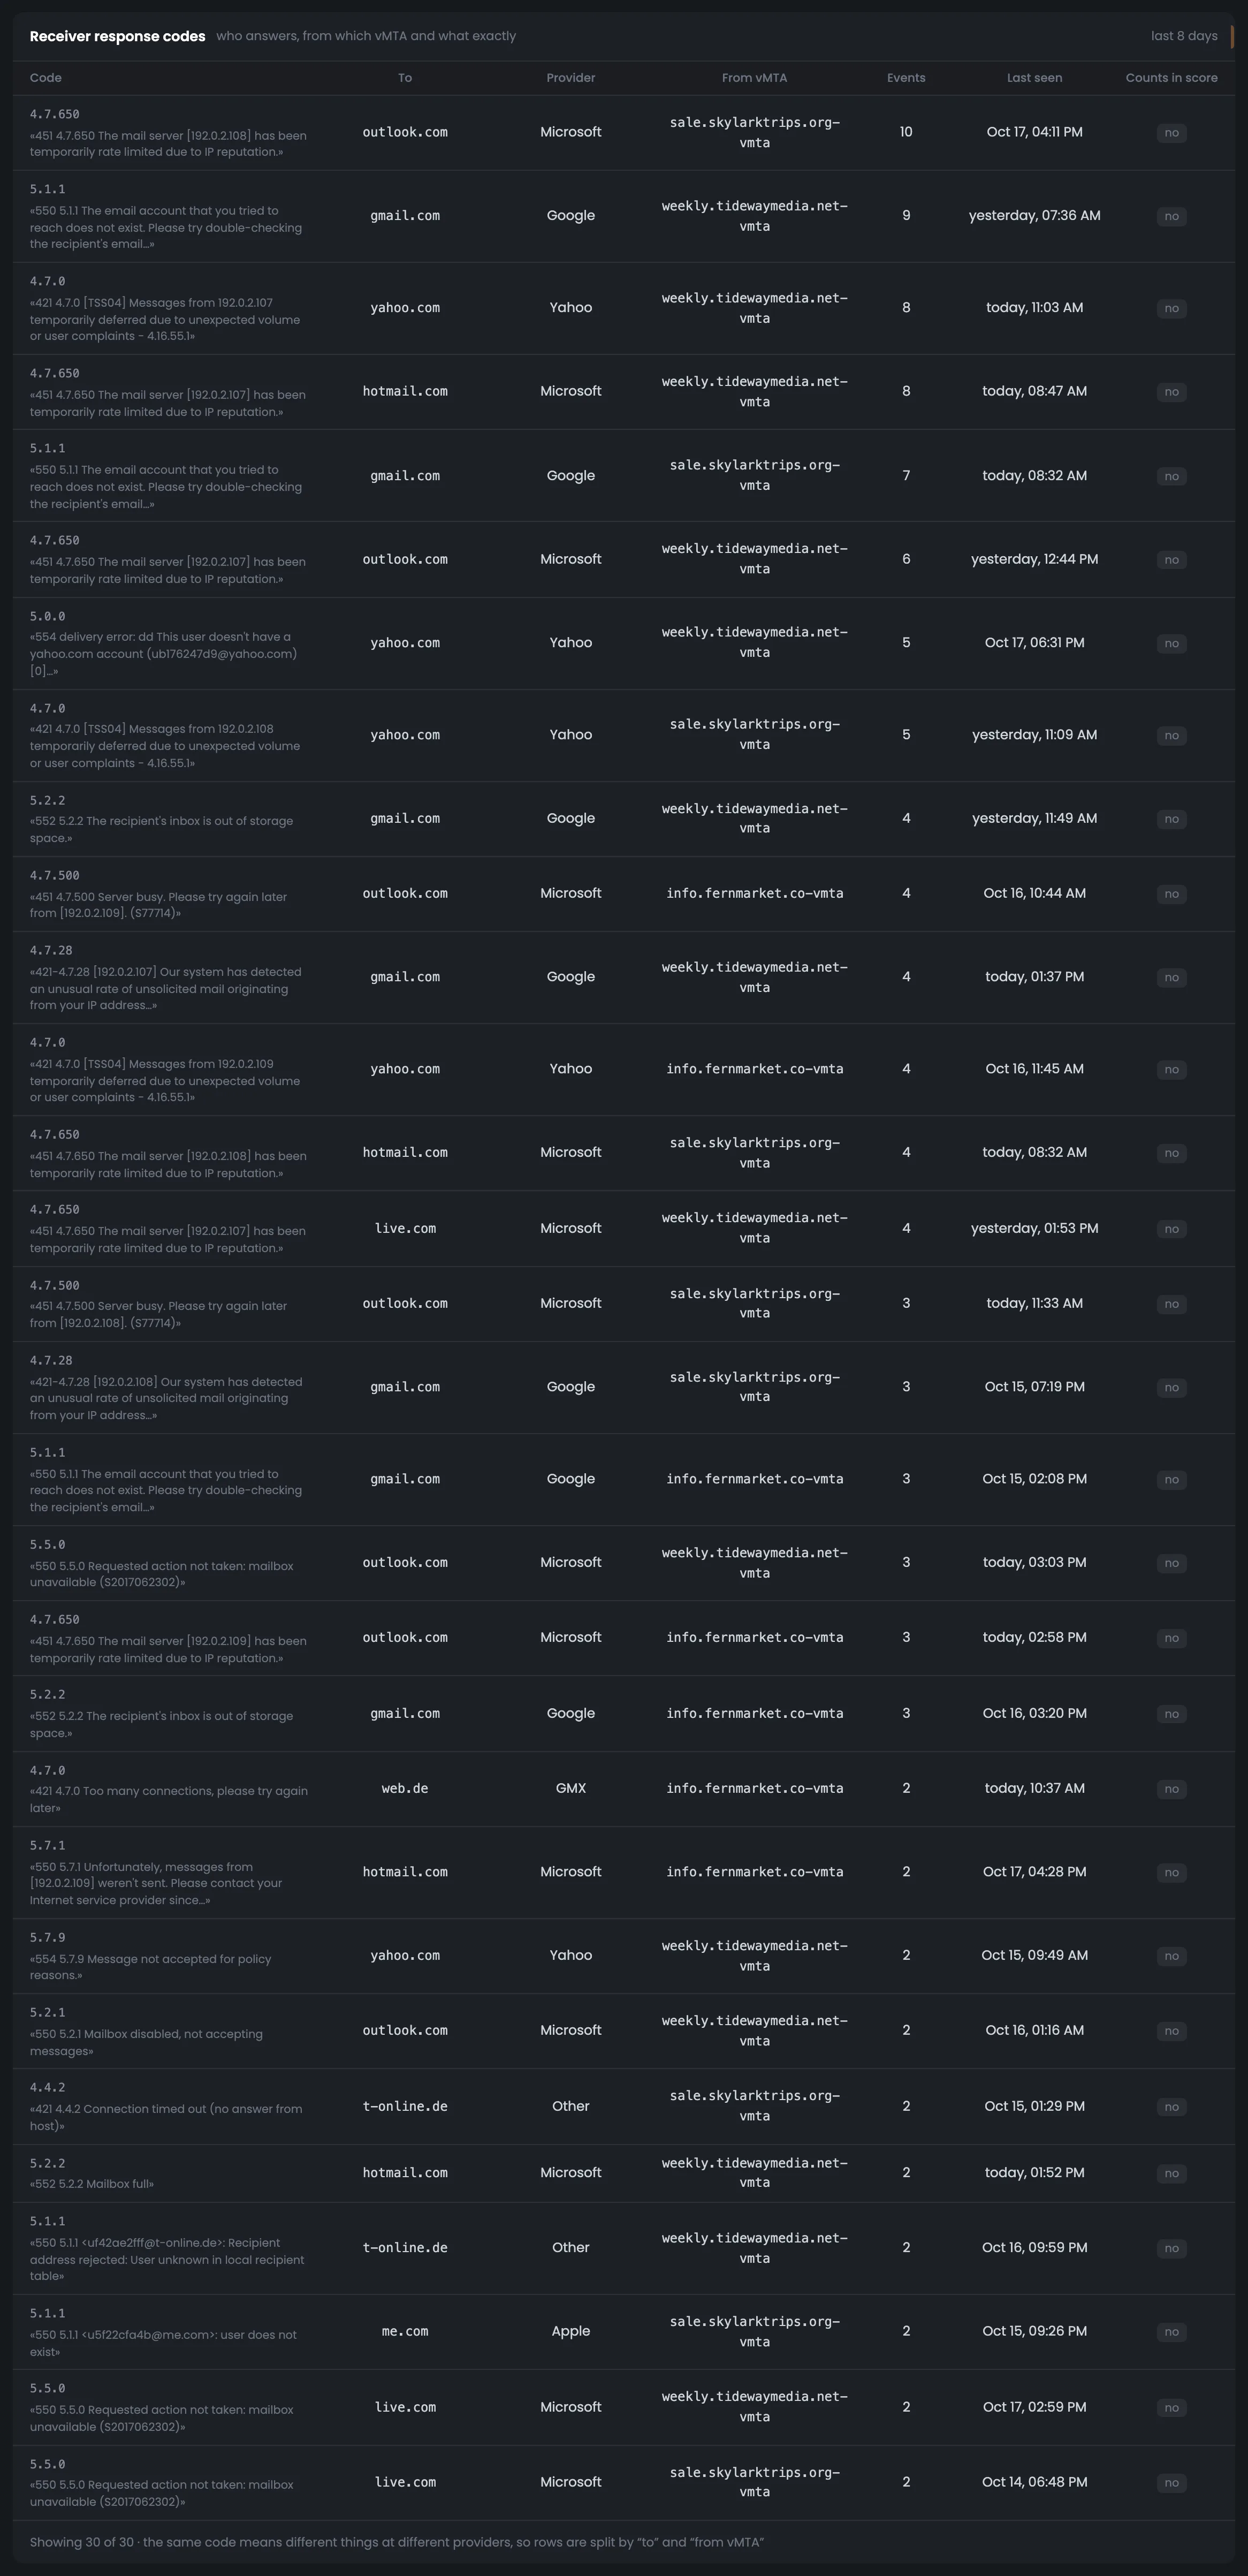
Receiver response codes are the most detailed level of monitoring: up to 30 rows over eight days with the SMTP response code and the mailbox provider's words, verbatim. Each row shows who the message was for, which provider answered, which vMTA the message went from, how many such events there were, when the last one was and whether the response affects the score. This is where you find the exact reason for a bounce — for example, 5.1.1 or 4.7.0 — and understand what to fix: your list, the sending address or the volume. When a frequent bounce code appears in the feed or a queue goes into backoff, the row with the same code shows at which provider and from which vMTA it is happening.
EnlargeScreen 31 · Receiver response codes. An example from the MTA-Hub interface.
Code and text — a long response is cut at a whole word.
To whom and from which vMTA — recipient domain, mailbox provider, sending address.
How many and when — number of events and the last time.
Affects the score — yes or no.
The same code means different things at different mailbox providers, so the rows are split by “to whom” and “from which vMTA”.
Control
4 screens
The “Control” tab holds commands for the whole server and targeted operations on a PowerMTA queue. Next to them — the current MTA state, queues where you should step in, and an operation log with undo. Every command is shown word for word before it is sent and needs confirmation, and irreversible actions are confirmed separately.
32
Quick commands and an action on a queue
The whole server or a target
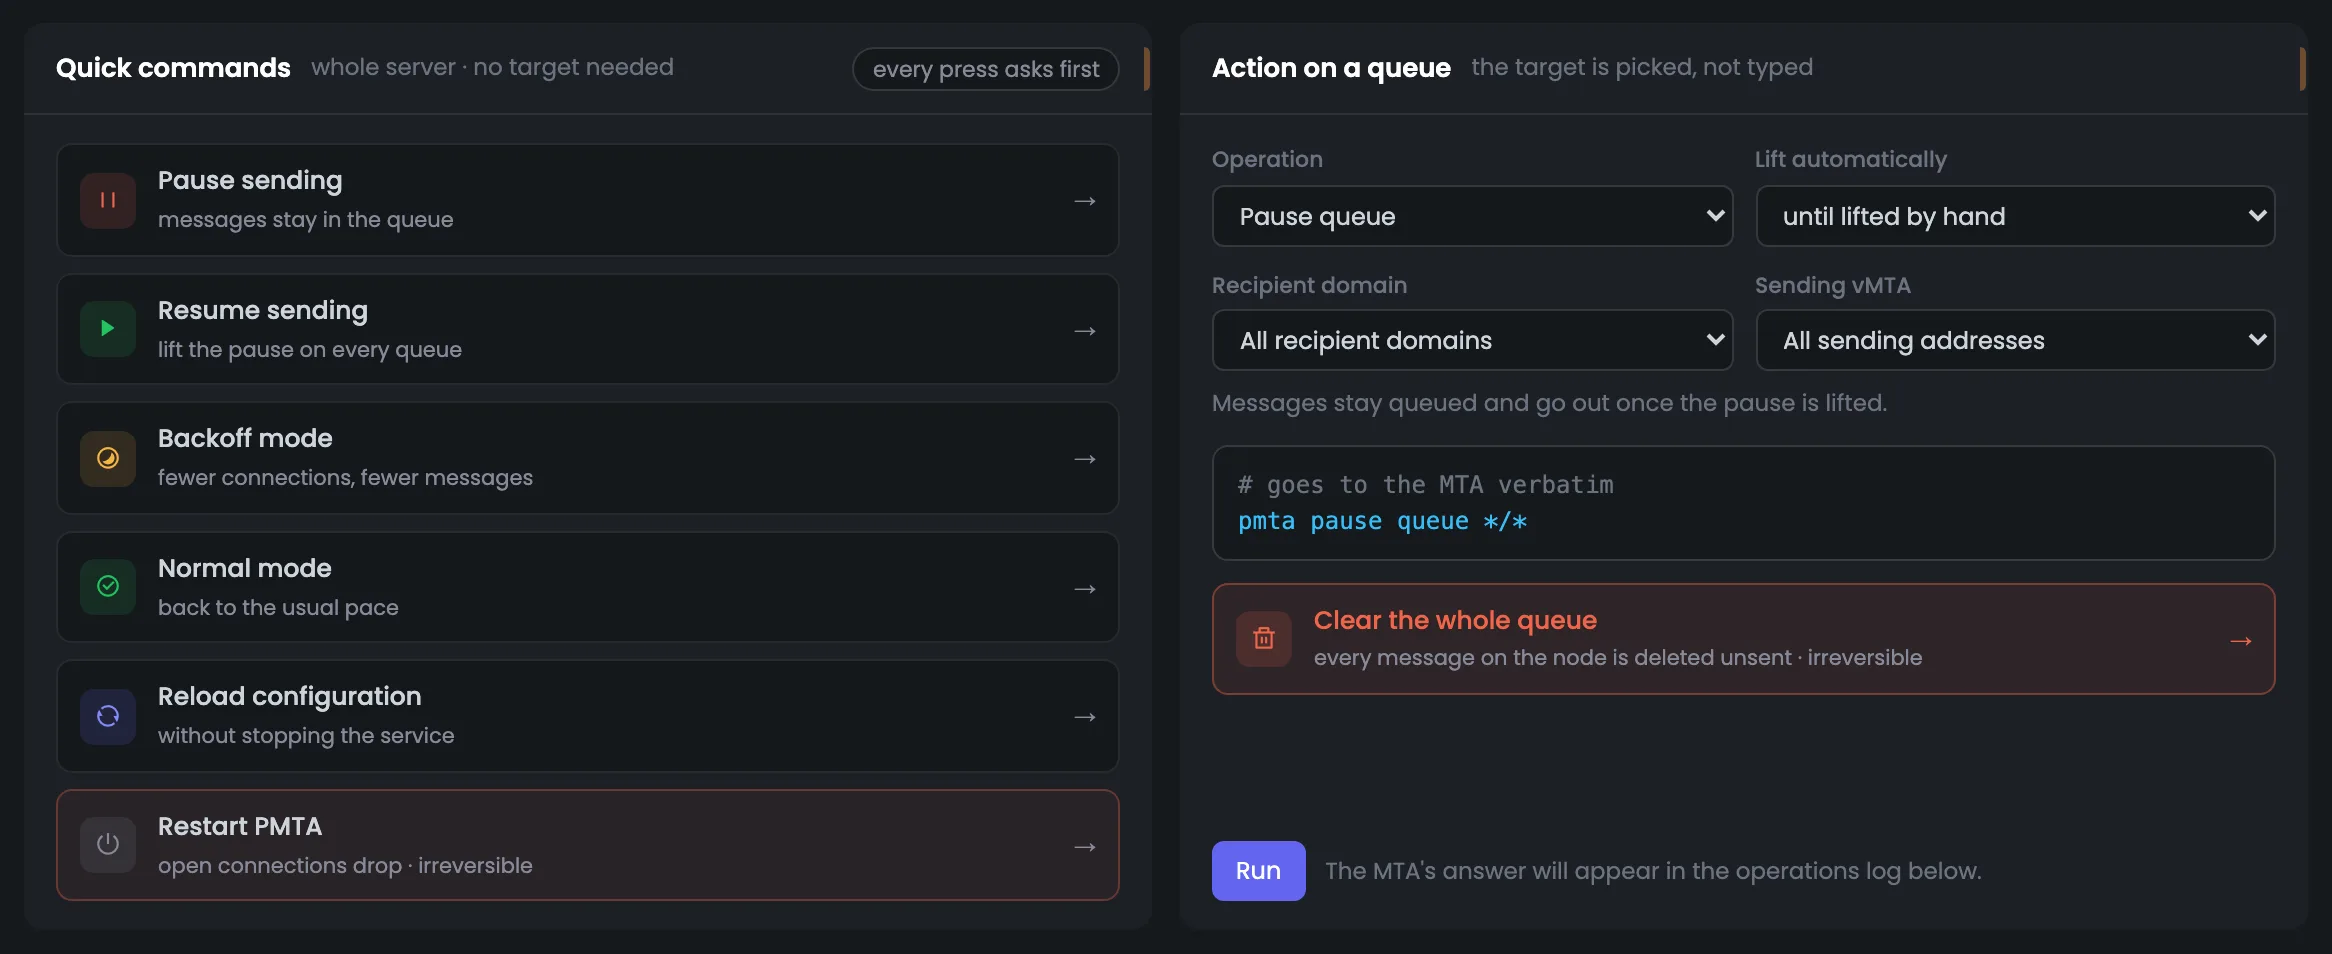
The “Control” tab starts with commands: on the left, for the whole server; on the right, a targeted operation on a PowerMTA queue. Quick commands pause and resume sending, turn on backoff or normal mode, reload the configuration and restart PMTA. On the right you choose the operation, the recipient domain, the vMTA and the auto-lift time — from 30 minutes to a day, or by hand only. The command that will go to the MTA is shown word for word before you press anything, so it is hard to pick the wrong target. Try a targeted operation on one queue first, and keep the whole-server commands for when the problem is general.
EnlargeScreen 32 · Quick commands and an action on a queue. An example from the MTA-Hub interface.
Action on a queue — operation, recipient domain, vMTA and auto-lift — from 30 minutes to a day, or by hand.
Command word for word — for example, pmta pause queue */*.
Clear the whole queue — a separate button, irreversible.
Every press asks for confirmation first, and clearing, stopping and restarting are confirmed separately.
33
State
MTA and queue modes
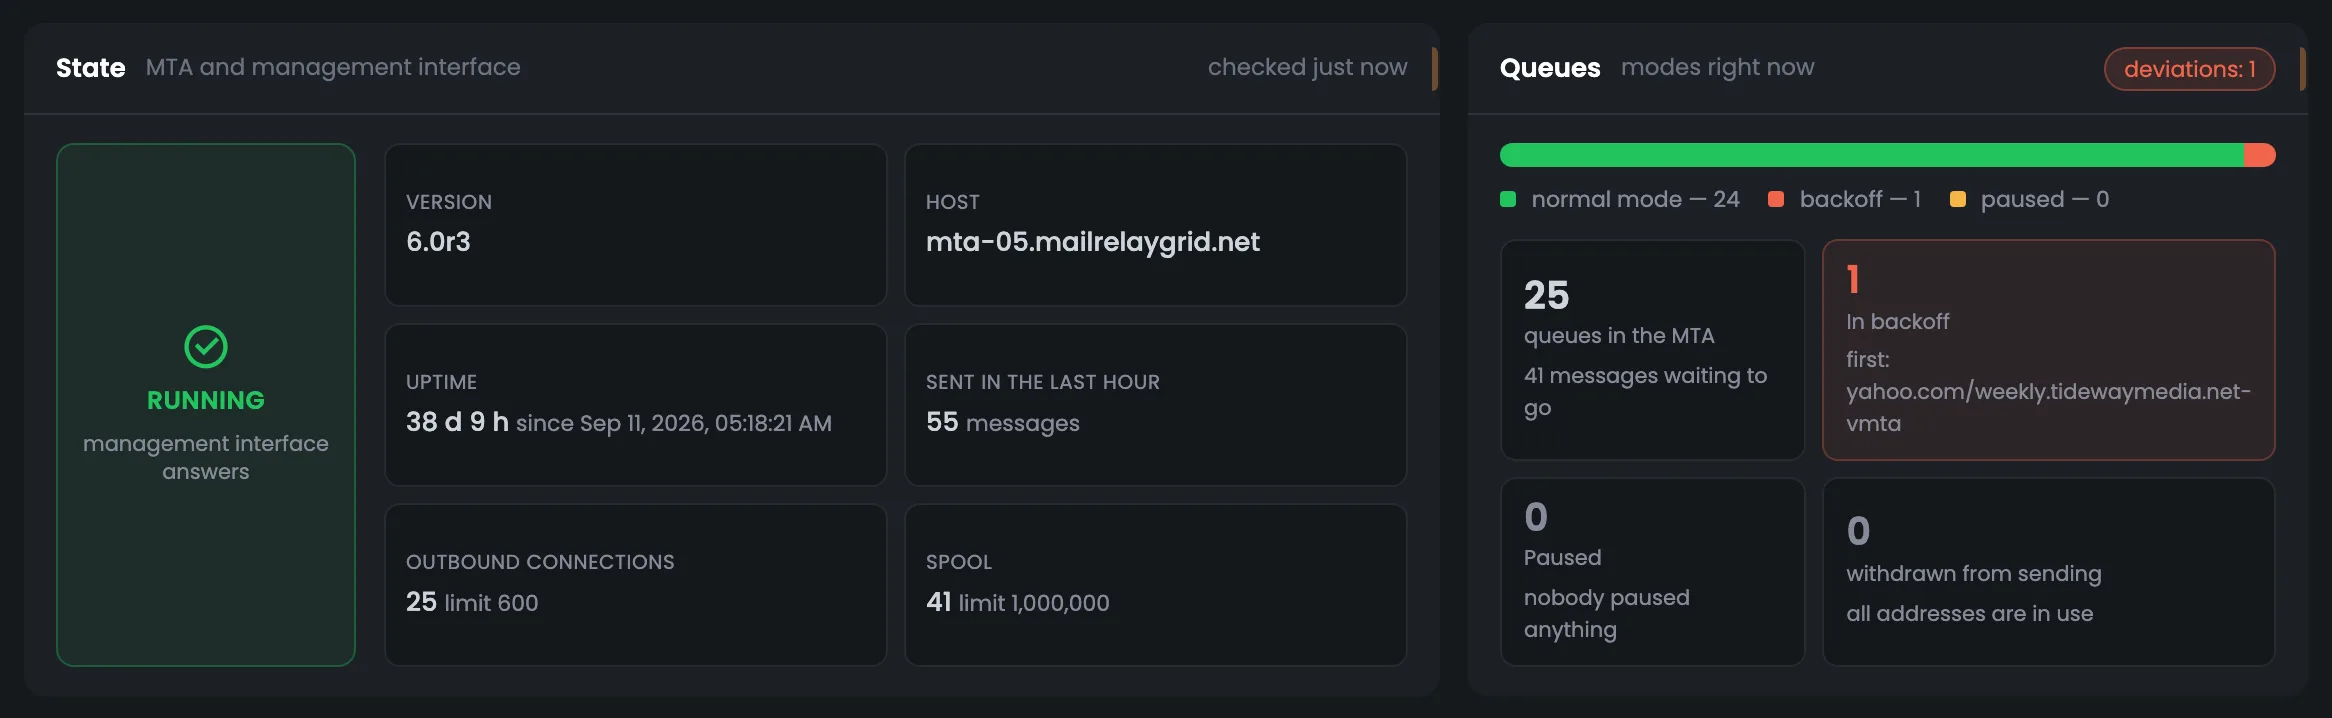
The “State” screen shows where the server stands right before you give a command. On the left — the MTA and its management interface: whether it is running, version, host, uptime, sent in the last hour, connections and spool next to their limits. On the right — queue modes: how many are in normal mode, in backoff and paused, the first of the slowed-down ones and how many addresses are taken out of sending. This shows whether a pause is already set or the address you need is already taken out. Open the screen before and after any command: changed queue modes confirm the command worked.
EnlargeScreen 33 · State. An example from the MTA-Hub interface.
MTA — whether it is running, version, host, uptime, sent in the last hour.
Limits — connections and spool next to their limits.
Queue modes — how many are in normal mode, in backoff and paused.
Taken out — how many addresses are taken out of sending.
Before a command, you see what state the server is in now.
34
Where to step in
Queues that need action
The “Where to step in” list picks out the queues that need action by itself: paused, in backoff and those where mail is piling up. For each, it suggests a fitting action — for example, “Back to pace” for one in backoff — plus “Pause” and “Pick as target”, which puts the queue into the form above. It is a short path from a problem to a command: no need to search the table for the queue and pick its domain and vMTA by hand. Deal first with queues where mail is piling up: the server cannot send it fast enough. After an action, check the operation log below — an entry with the result will appear there.
EnlargeScreen 34 · Where to step in. An example from the MTA-Hub interface.
Fitting action — for example, “Back to pace” for a queue in backoff.
Pause — for any queue in the list.
Pick as target — puts the queue into the form above.
Piling up means more messages than the server sends in 10 minutes of its peak hour. You will still be asked to confirm.
35
Recent operations
Log with undo
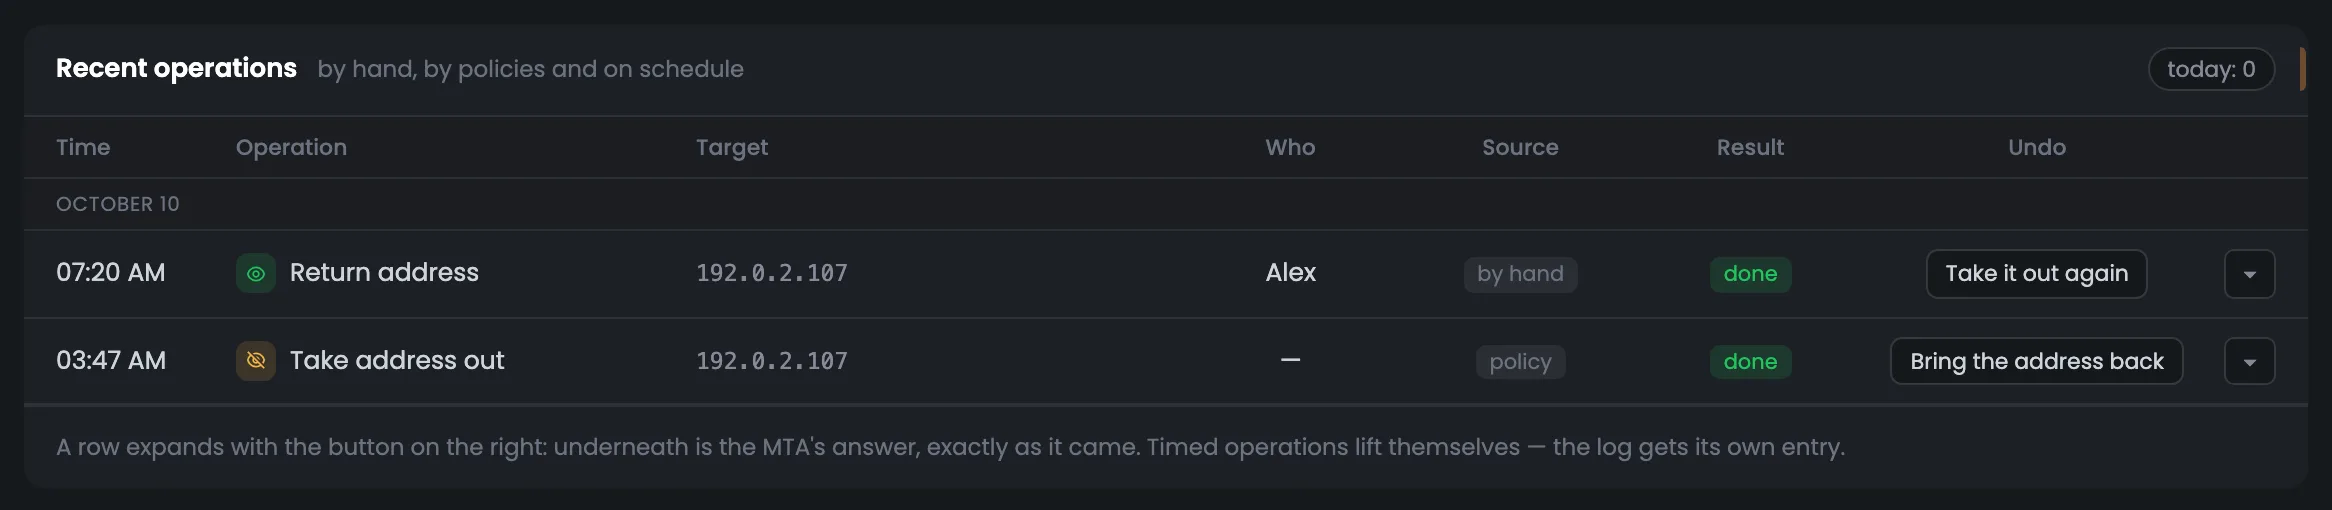
The operation log keeps every action on queues and addresses, by day: time, operation, target, who started it, result. The source shows who made the decision — a person by hand, a policy, a schedule or automation. In the screenshot, at 03:47 a policy took address 192.0.2.107 out of sending, and at 07:20 a person brought it back. Any operation can be undone with the button in its row, and an expanded row shows the MTA's full response. If the server's behavior changed for no visible reason, check the log: perhaps a rule took an address out or a queue was put into backoff on a schedule.
EnlargeScreen 35 · Recent operations. An example from the MTA-Hub interface.
03:47 · Take the address out — 192.0.2.107 — policy, done.
07:20 · Bring the address back — the same address — person, by hand.
Undo — “Bring the address back” for one taken out, “Take it out again” for one returned.
Expand the row — the MTA's full response.
Timed operations lift themselves — and that lifting gets its own entry too.
06 / Questions about monitoring
Common questions about PowerMTA monitoring.
In short: where the numbers come from, how to read the queues and what happens when you press a command.
On the left — commands for the whole server, on the right — a targeted operation; the command that will go to the MTA is shown before you press.
How does the Hub know what is happening with the MTA right now?
It asks the PowerMTA management interface — when the page opens, when you press “Refresh” and on auto-refresh every 15, 30 or 60 seconds.
Why don't the MTA's counters match the Hub's numbers?
The MTA's counters are not reset when it reloads its settings, and they cover their own time span. The Hub's numbers come from accounting every message over the chosen period.
What is a queue in PowerMTA?
A “recipient domain / sending vMTA” pair. Each one is shown as its own row with messages, connections and mode.
How do I tell where the jam is?
If mail piles up at one domain while the vMTAs are even, the problem is at the mailbox provider. If it piles up at one vMTA across different domains, it is on your side: warm-up, a speed limit or the address's reputation.
What does “backoff mode” mean?
Queued messages go out one at a time with long pauses. It is usually set after a mailbox provider has answered “too much” or “complaints”.
Can I delete mail by accident?
Clearing is the only irreversible action. The Hub first asks the MTA how many messages would be deleted, names the number and asks for a separate confirmation.
Can I undo a command?
Yes, in the log: “Bring the address back” for one taken out, “Take it out again” for one returned. Timed operations lift themselves.
How is the server's score calculated?
Five components with weights: deliverability, spam and complaints, infrastructure, mailbox provider requirements, blacklists. The calculation is the same as in “Analytics”.
07 / Next step
Compare the deliverability of all your servers in Analytics.
Monitoring shows one server inside out. Deliverability for all servers together, by mailbox provider and period, is gathered in Analytics.
If the server is still warming up addresses, each address's daily cap is set by the warm-up plan — you can also see it on the “vMTAs and jobs” tab.