Email sending analytics from PowerMTA and MailerQ reports
Email sending analytics. A deliverability score out of 100.
How mailbox providers receive your mail: how much went out and what happened to it, where your mail goes and why it doesn't arrive, which addresses sent it and what needs fixing.
Everything comes from the reports of the MTAs themselves on every server, and every number sits next to the previous period of the same length.
A deliverability score out of 100 — and the reason behind it.
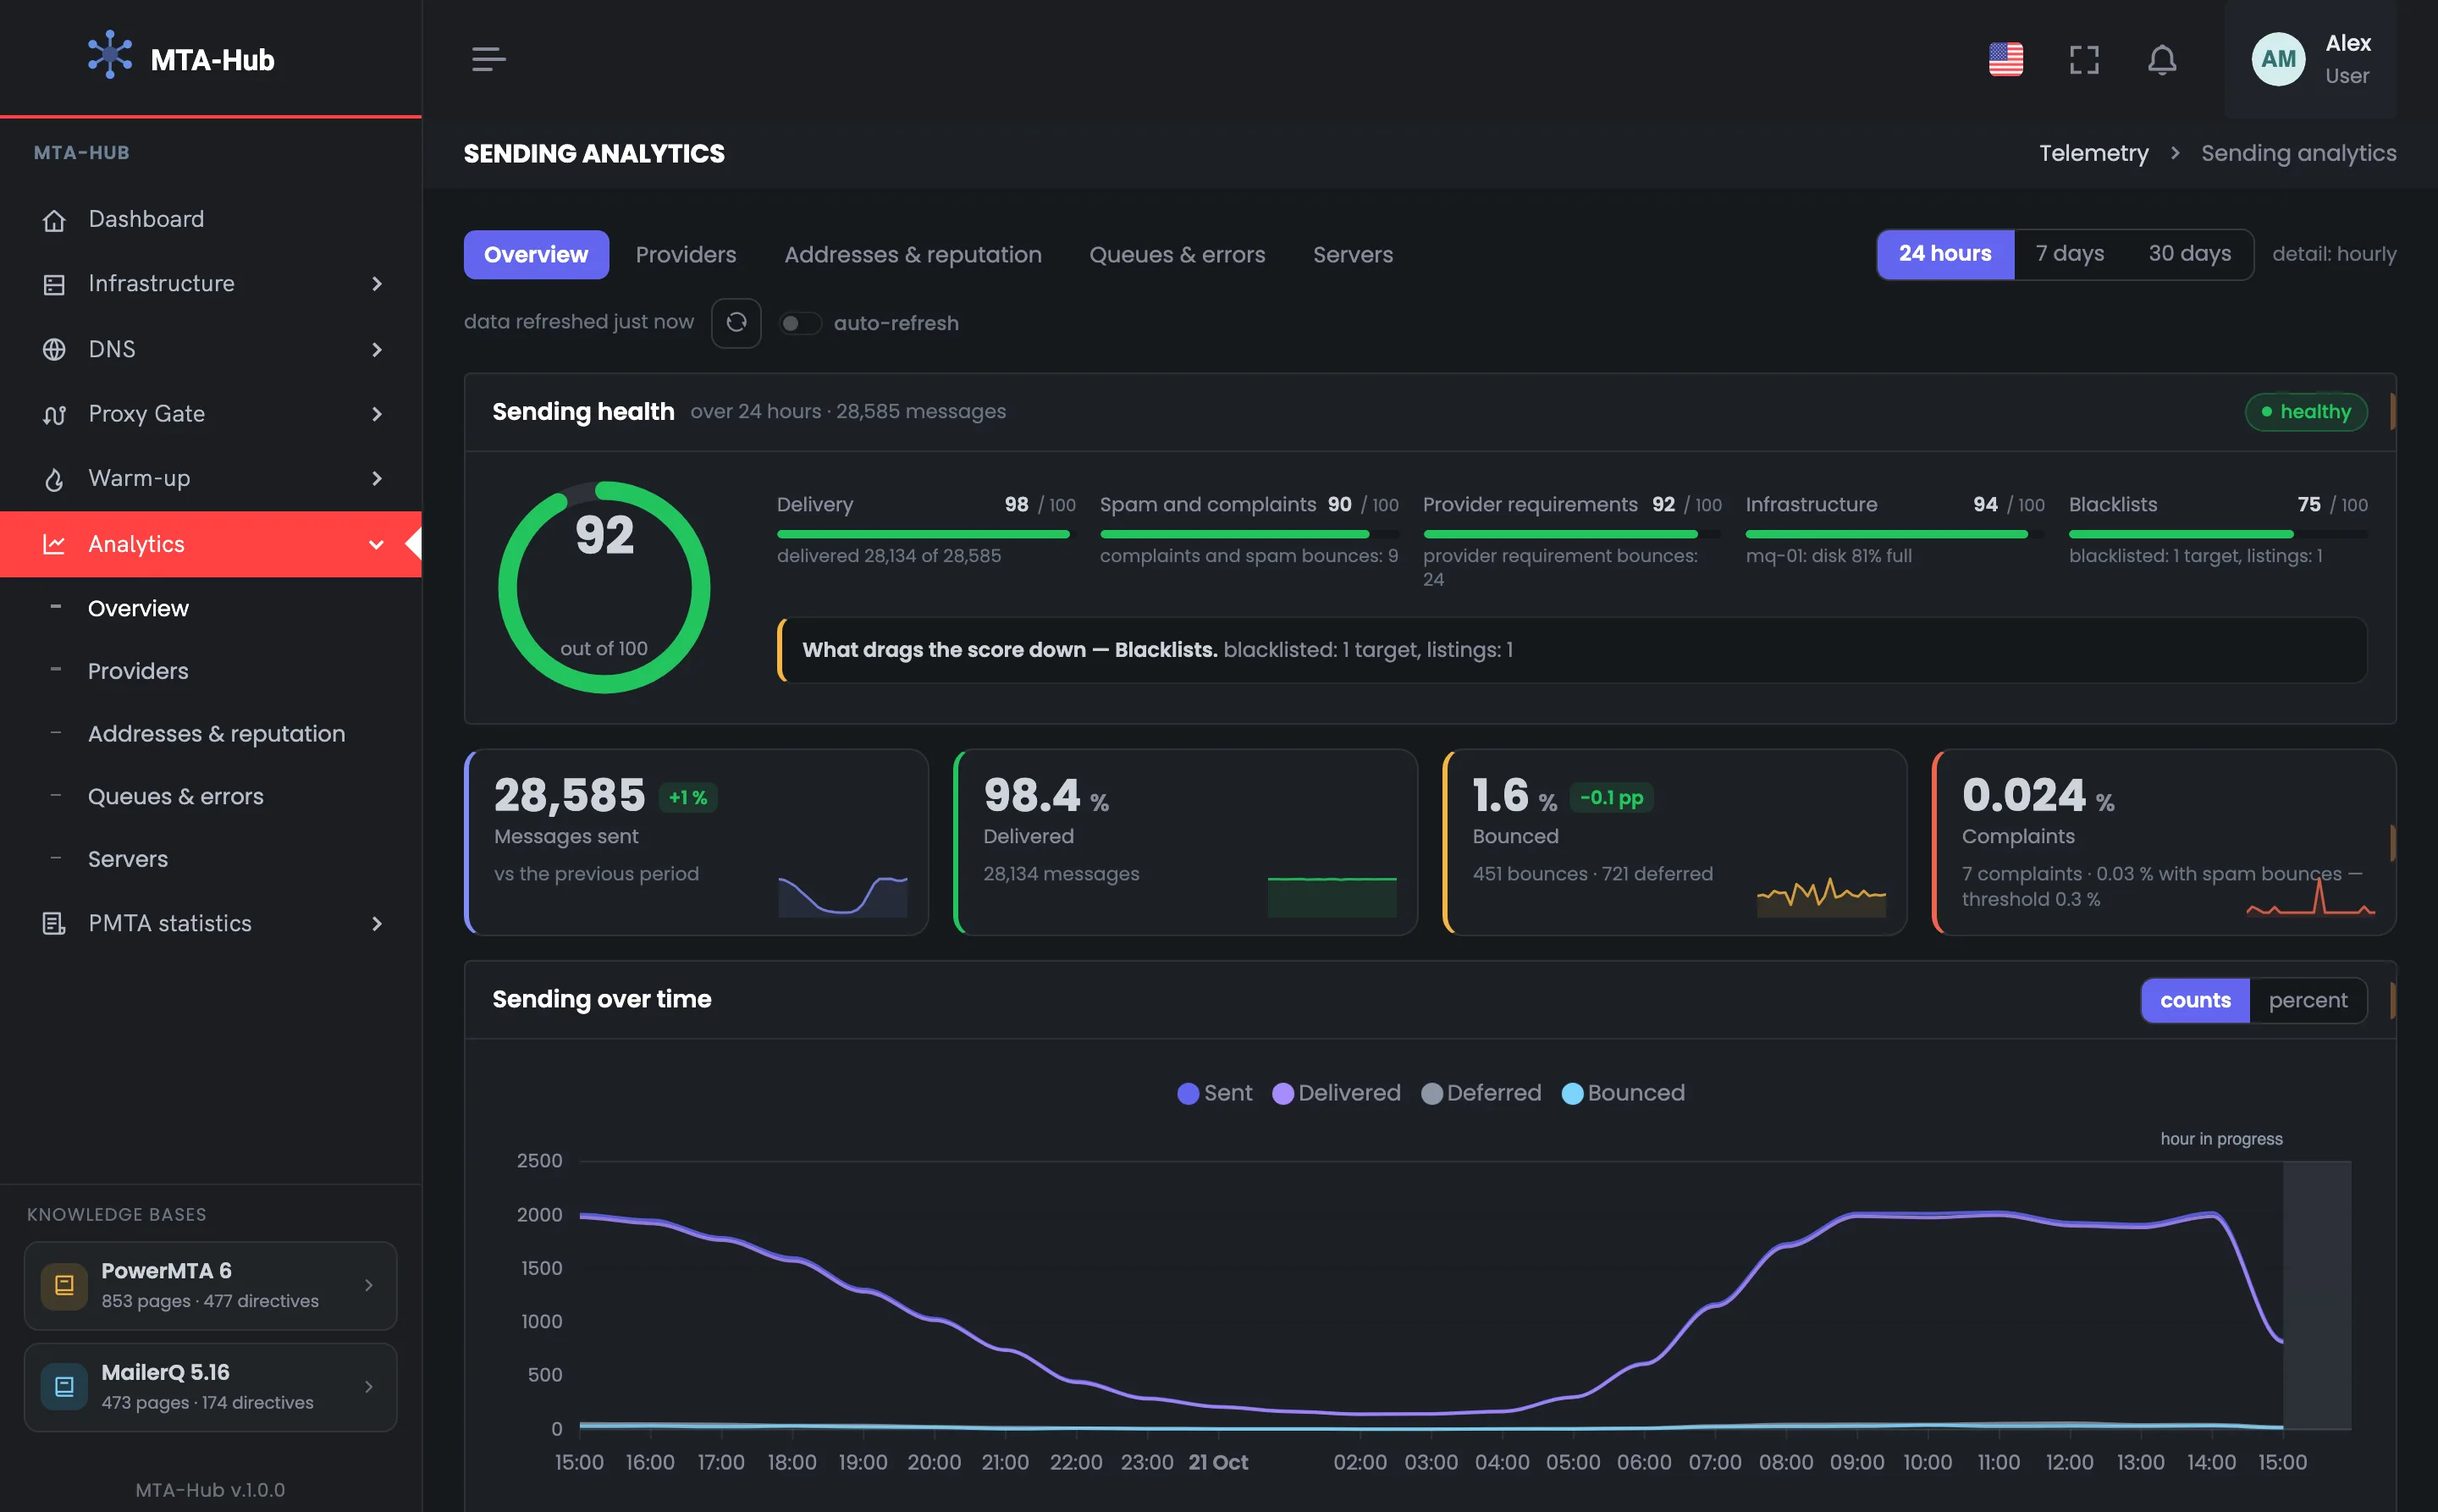
Email sending analytics starts with a single score out of 100. It's made of five parts: deliverability, spam and complaints, mailbox provider requirements, infrastructure and blacklists. The line under the score names the part that's pulling it down and what's wrong with it.
Sending health for the day · 92 out of 100
01 · Deliverability98
02 · Spam and complaints90
03 · Requirements92
04 · Infrastructure94
05 · Blacklists75
What's pulling the score down is blacklists: one address on one list
Sent in a day
+1% vs. previous
A bare “28 thousand sent” tells you nothing, while “+1% vs. the previous day” does. That's why every number sits next to the same number for the previous period of the same length.
MMTA
reports
Sent28,585 messages
+1% vs. previous98.4% delivered
Complaints
Threshold 0.3%
Seven complaints — 0.024%, and together with spam bounces — 0.03%, against a 0.3% threshold. Under each number is a small chart of the period: whether sending went steadily or in bursts.
HMTA-Hub
complaints
Complaints0.024%
7 complaintswith spam bounces 0.03%
02 / How shares are counted
Deliverability is counted from messages, not attempts.
If a message was deferred three times and delivered on the fourth try, it's one message, not four. So delivery, bounce and complaint shares are counted from messages whose outcome is already known, and retries don't distort deliverability. Changes in shares are shown in percentage points.
In counts and in percentages
Both charts
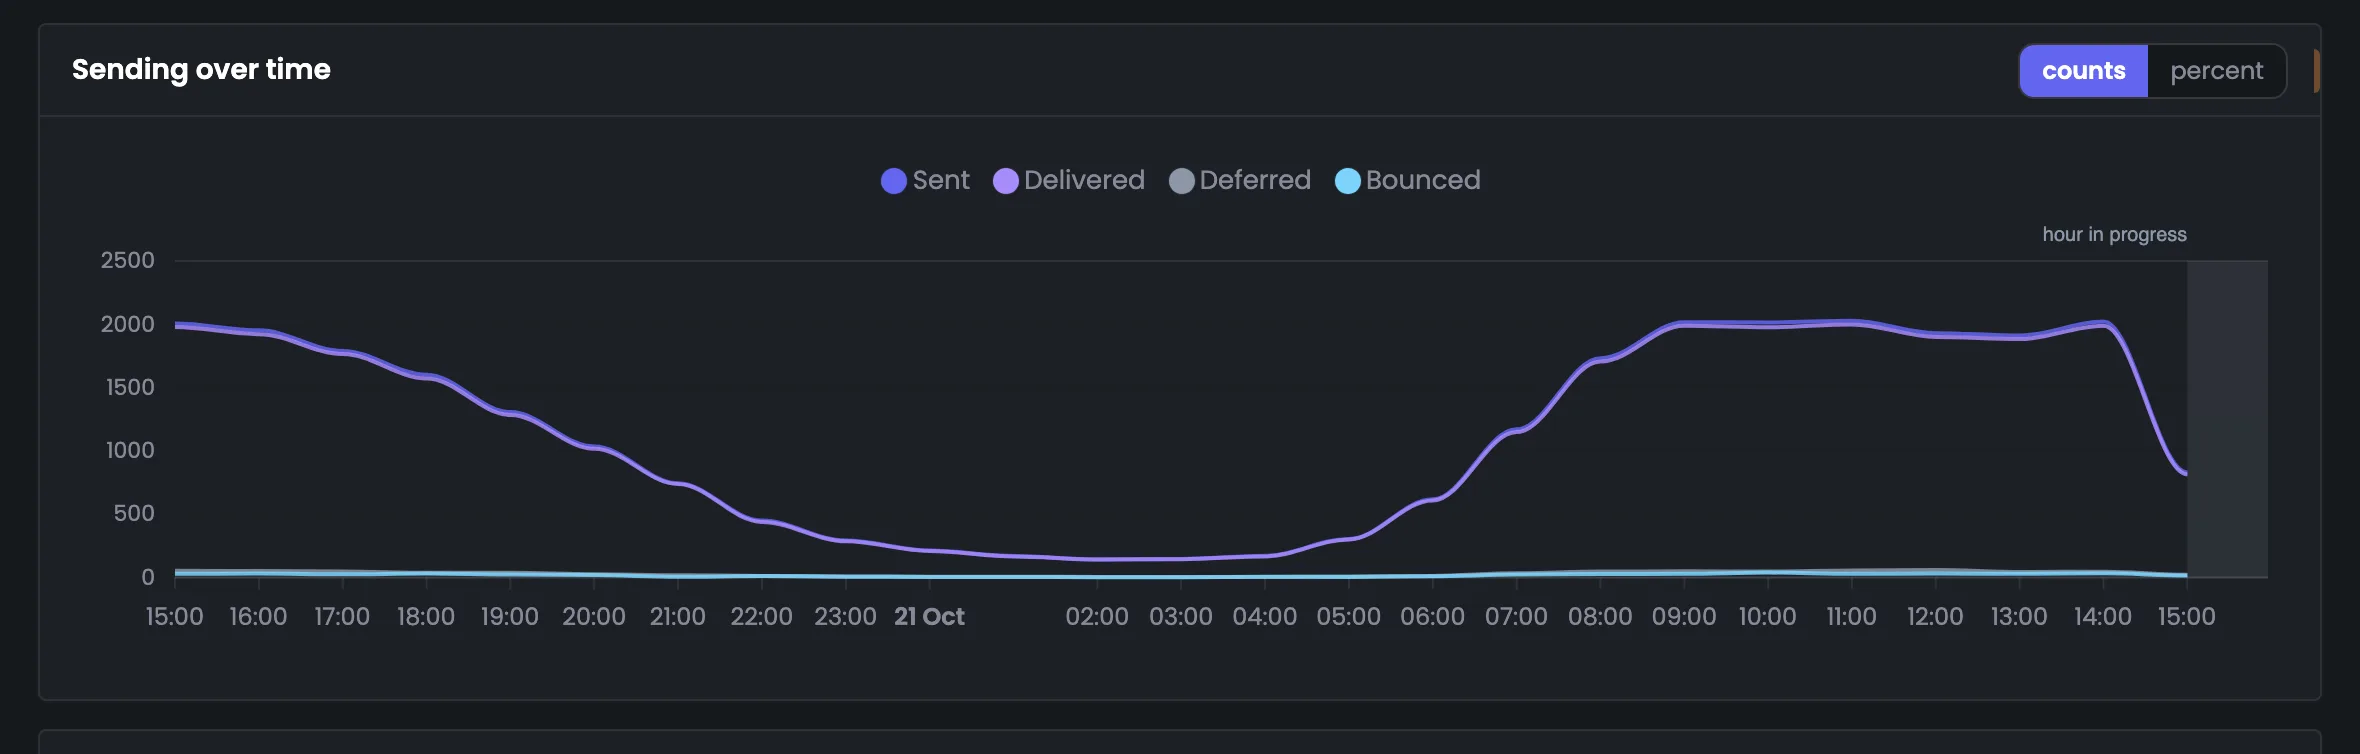
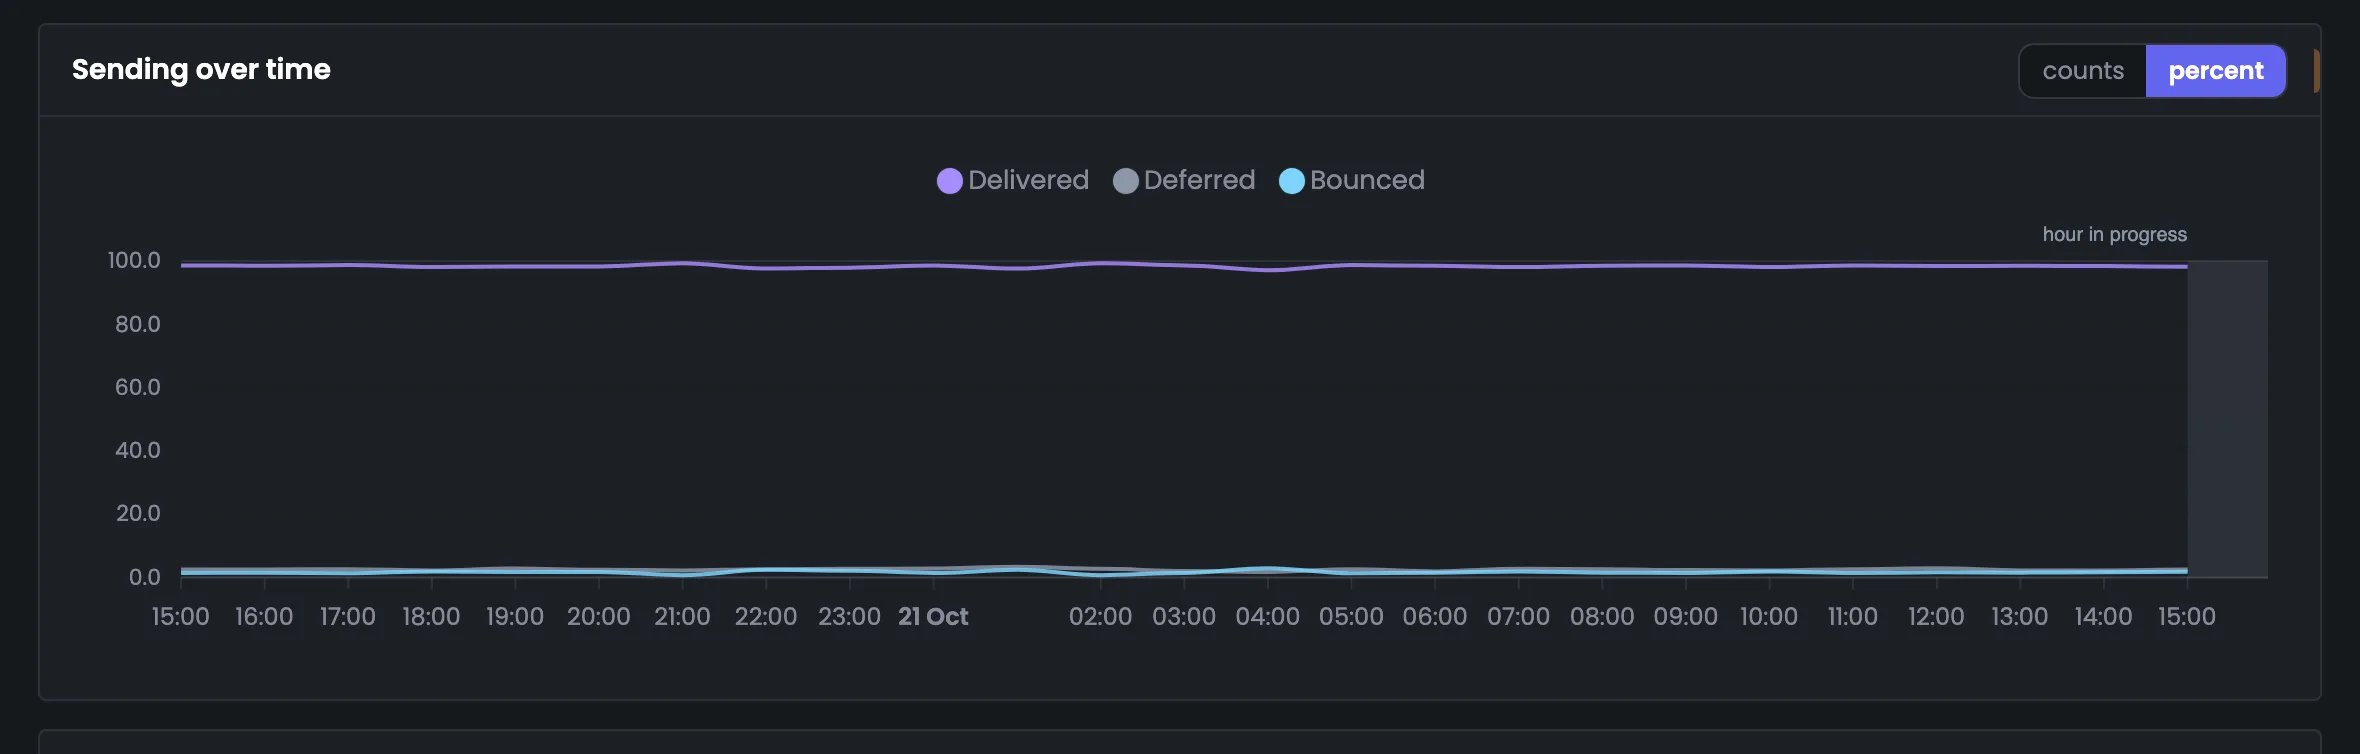
At night 150–200 messages an hour go out, during the day about two thousand. In counts you see how much went out, in percentages — how well: delivered holds at 98–99%.
HMTA-Hub
by hour
Delivered98–99% every hour
at night ~200 an hourby day ~2,000
Hour in progress
Not a crash
The current hour isn't over yet — its band is shaded and captioned “hour in progress”. If an hour has no messages yet, it has no share: the line breaks off instead of dropping to zero.
HMTA-Hub
chart
Current hourHour in progress
band shadedline breaks off
Bounced — 1.6% (451 messages), while deferrals are 721: the mailbox provider asked to try again later, and the message is still being retried.
03 / Providers, bounces, addresses
Deliverability by mailbox provider, reason and IP address.
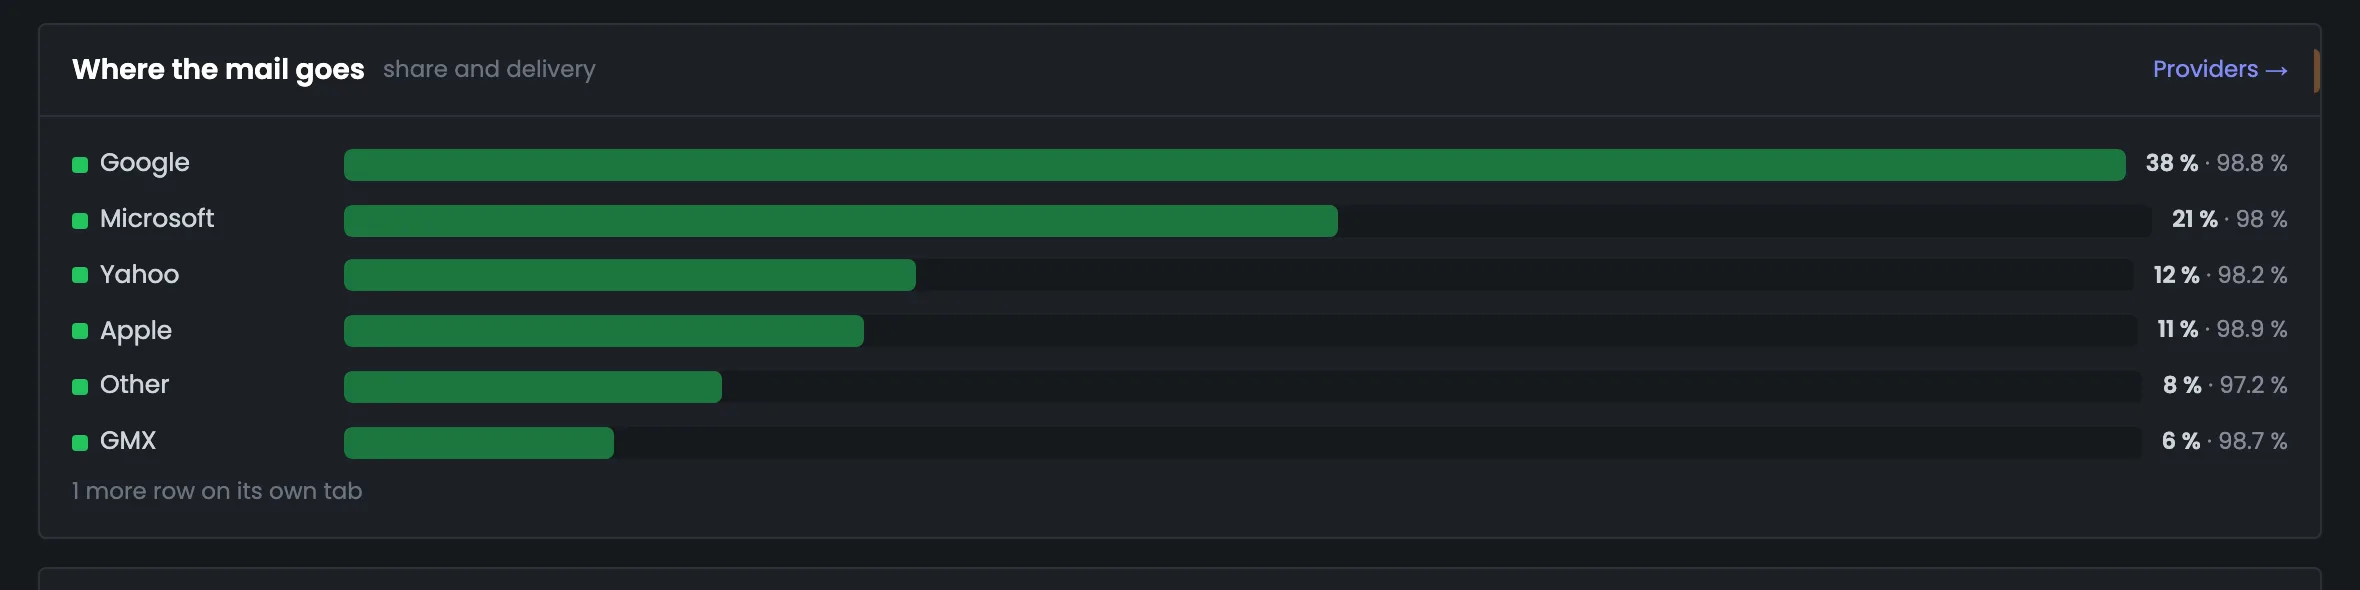
Mailbox providers, bounce reasons and sending addresses are shown as bars: the length is the share of sending, the color is deliverability. So deliverability by provider and by IP address fits on one screen. You see right away whether the whole problem is one address or one provider.
Where your mail goes
Google — 38%
98.8% delivered; Microsoft — 21% and 98%, Apple — 11% and 98.9%.
Why mail doesn't arrive
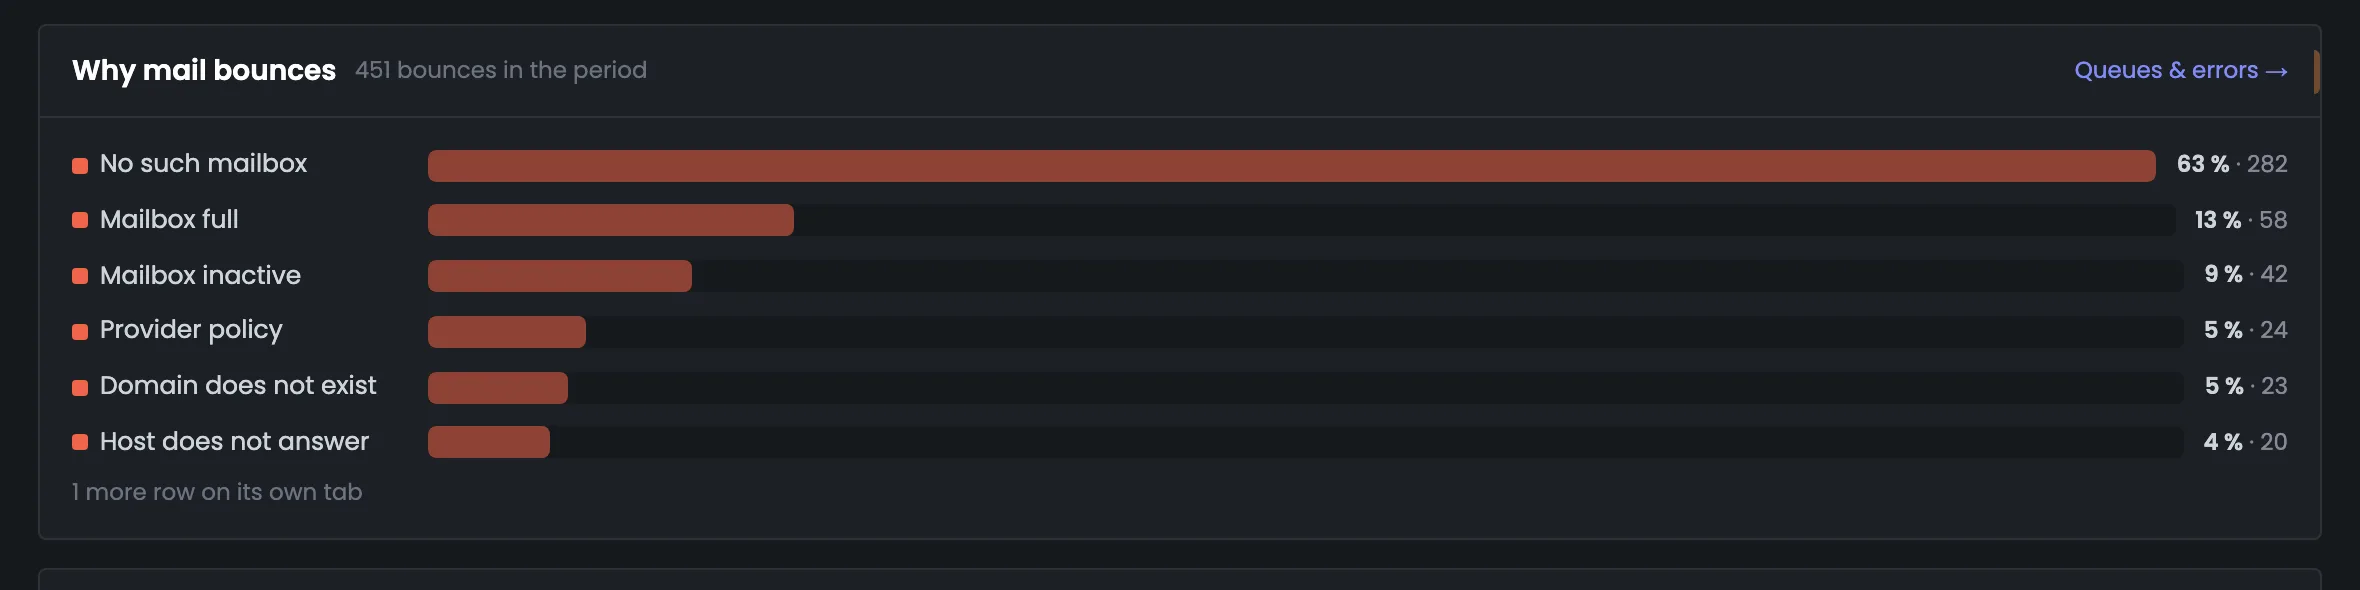
No such mailbox — 63%
Out of 451 bounces; mailbox full — 13%, abandoned — 9%.
Who's sending
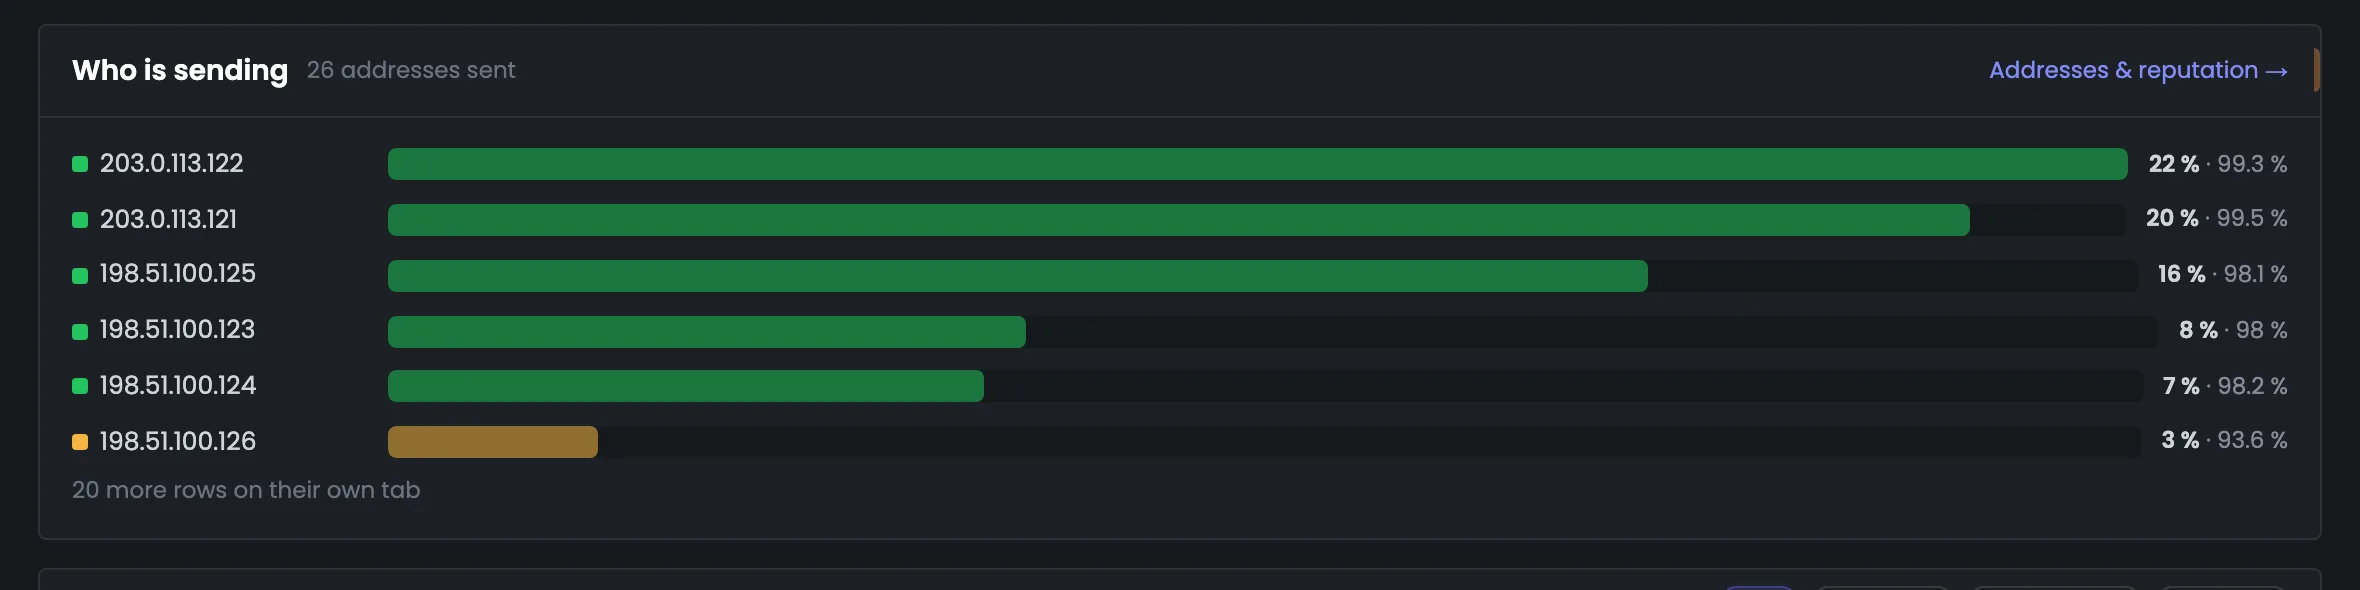
198.51.100.126 — 93.6%
In yellow — 198.51.100.126; the rest are at 98–99%.
The mailbox provider is determined by the recipient domain from a set list. Corporate mail that is also hosted by Google goes into “Other”.
04 / The problem list
What to fix in your sending infrastructure.
“Needs attention” collects only problems, on its own: an address on a blacklist, a disk filling up, addresses without reverse DNS, servers without reports. Successful deliveries don't go here. Every row leads to where the problem is solved, and the last block shows which servers the numbers came from.
Needs attention
5 notes
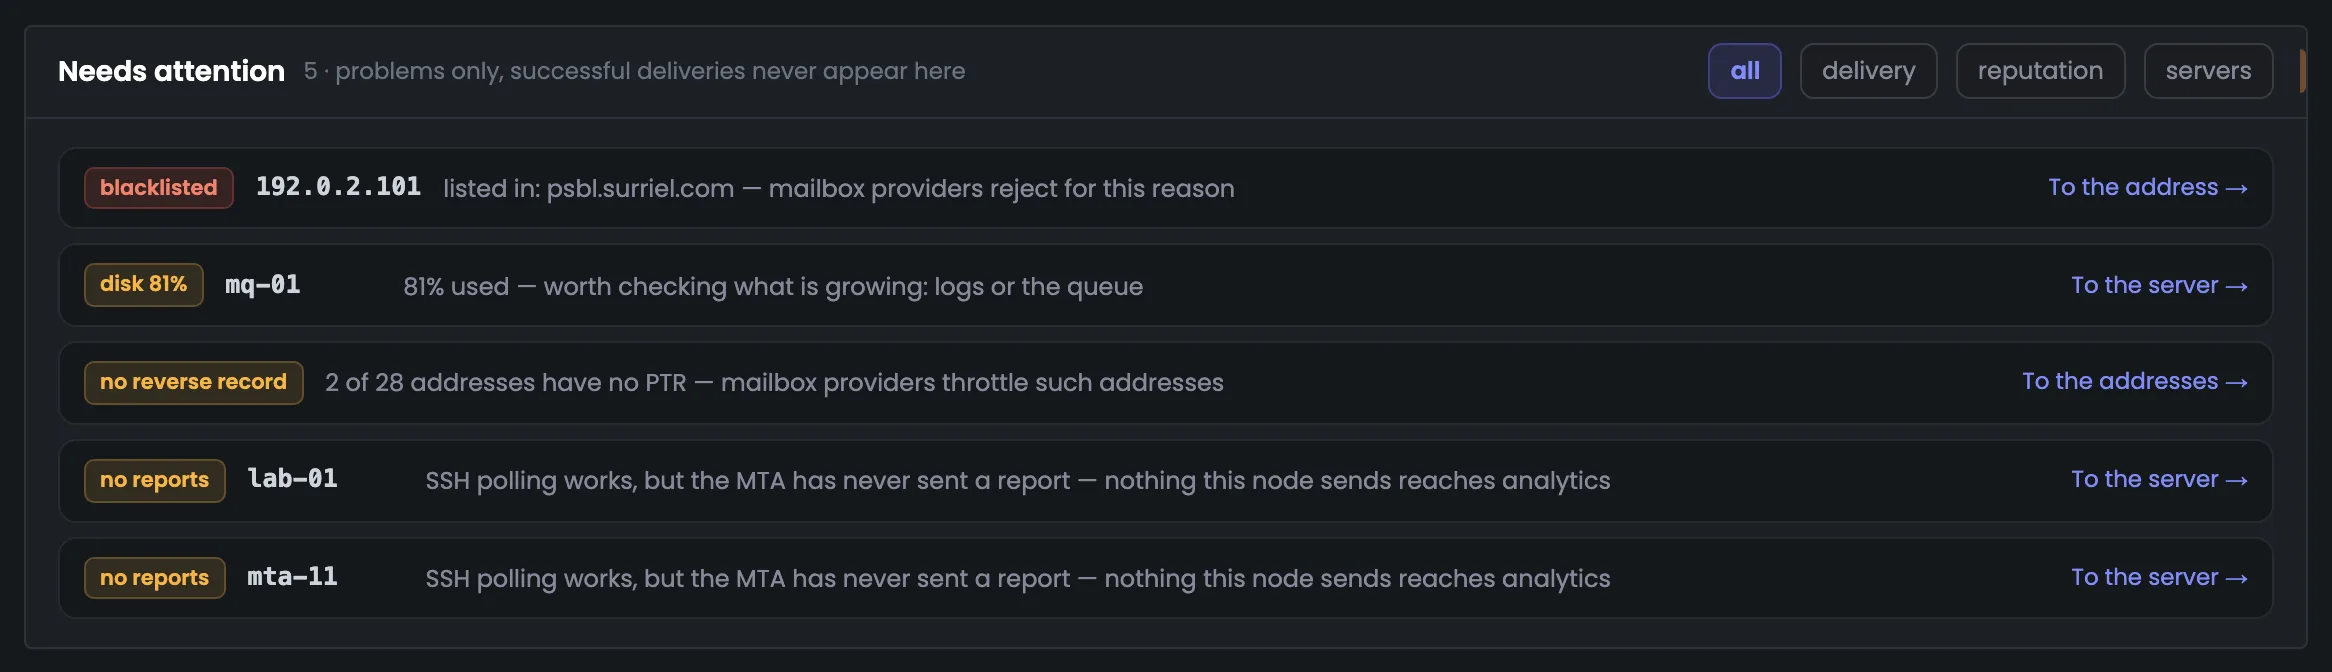
192.0.2.101 is on a blacklist, the mq-01 disk is 81% full, two addresses out of 28 have no reverse DNS, and lab-01 and mta-11 haven't sent a single MTA report.
HMTA-Hub
checks
Needs attention5 notes
delivery · reputationservers
Where the numbers come from
15 of 17
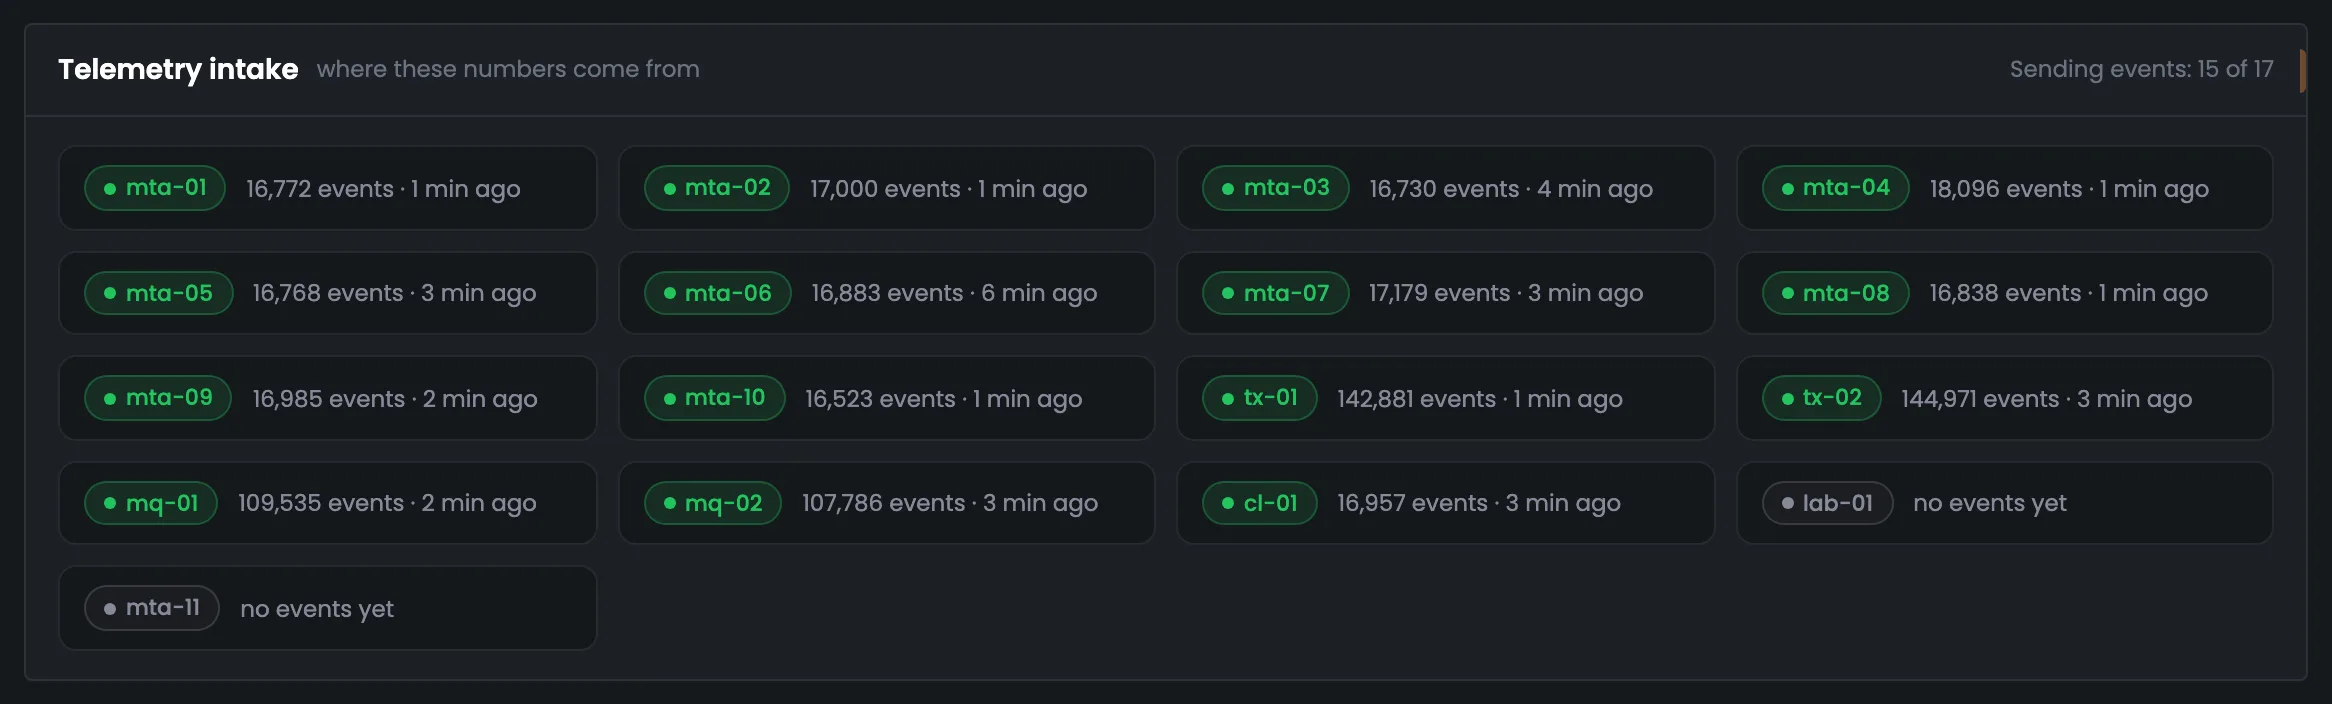
Message data is coming from 15 of 17 servers, the latest batch 1–6 minutes ago. There have been no events from lab-01 and mta-11 yet: while a server is silent, its messages don't reach the analytics.
MMTA
telemetry
Sending reports15 of 17
1–6 min agolab-01, mta-11 — none
A server's load is compared only with servers on the same MTA: MailerQ and PowerMTA load a machine differently.
05 / The interface in detail
The sending analytics interface — 9 screens.
The score, four figures, trends in counts and shares, mailbox providers, bounce reasons, addresses, notes and telemetry intake. Above each screenshot: why the screen matters. Below it: what it shows.
Health and trends
4 screens
The first four screens answer “how are things overall”. Here you have the deliverability score out of 100 and its five parts, the period's four figures next to the previous period, and two trend charts — in counts and in shares. You pick the period at the top: a day, a week or 30 days.
01
Sending health
Score out of 100 and five parts
The first analytics screen is the overall sending score for the chosen period. In the example 28,585 messages went out in a day, and the score is 92 out of 100, “healthy”. Next to it are the five parts with their points: deliverability, spam and complaints, mailbox provider requirements, infrastructure and blacklists. Look at the lowest part: the line under the score names exactly what's pulling it down — here it's blacklists, where one address landed. In a few seconds you know whether everything is fine and where to look first. If the score dropped, compare its parts first: if one sagged, that's the cause, and details on each part are in the blocks further down this same page.
EnlargeScreen 01 · Sending health. An example from the MTA-Hub interface.
Deliverability — 98 — 28,134 of 28,585 delivered.
Spam and complaints — 90 — 9 complaints and spam bounces.
Mailbox provider requirements — 92 — 24 bounces due to requirements.
Infrastructure — 94 — the mq-01 disk is 81% full.
Blacklists — 75 — one address on one list.
What's pulling it down — blacklists.
The score is calculated the same way as on the “Deliverability” tab of Monitoring.
02
The period's four figures
Versus the previous period
The period's four main figures: sent, delivered, bounced and complaints. Each sits next to the same number for the previous period of the same length, so you see where sending is heading: in the example there are 1% more messages, and the bounce share is 0.1 percentage points lower. Under each number is a small chart — whether sending went steadily or in bursts. Complaints are compared with the 0.3% threshold right away, so it's clear whether you have headroom. One number answers two questions at once: how much, and is it better than last time. Open this row right after the score: if delivery fell and bounces grew, look at the mailbox providers and bounce reasons below next.
EnlargeScreen 02 · The period's four figures. An example from the MTA-Hub interface.
Sent — 28,585, +1%.
Delivered — 98.4% — 28,134 messages.
Bounced — 1.6% — 451 bounces, 721 deferred; −0.1 pp.
Complaints — 0.024% — 7 complaints; with spam bounces 0.03%, against a 0.3% threshold.
Changes in shares are in percentage points, not percent.
03
Sending trend
By hour, in counts
A chart of sending by hour in counts: how many messages were sent, delivered, deferred and bounced. It shows the rhythm of your mailings — in the example 150–200 messages an hour go out at night, about two thousand during the day. Hours without messages are shown as zero, not smoothed over by a line, so real downtime is visible right away. The current hour is captioned “hour in progress”: few messages in it means incomplete data, not that sending stopped. The chart makes it easy to check whether the load matches your mailing schedule. If bounces or deferrals went up in some hour, look at the next screen — the chart in shares: it shows how serious that is relative to the volume.
EnlargeScreen 03 · Sending trend. An example from the MTA-Hub interface.
At night — 150–200 messages an hour.
During the day — about two thousand.
Hours without messages — shown as zero, not smoothed over by a line.
New hour — the band is shaded to the end of the hour and captioned “hour in progress”.
A zero in the current hour doesn't look like sending has stopped.
04
Trend in shares
By hour, in percent
The same hourly chart, but in percent: what share of messages was delivered, deferred or bounced. Counts show how much went out, shares show how well: in the example delivered holds at 98–99% every hour, with bounces and deferrals pressed to the bottom edge. If an hour has no messages yet, the line breaks off instead of dropping to zero. A night with a hundred messages and a day with two thousand look the same in percent, so look at both charts together. A dip in share during a night hour with a hundred messages means less than the same dip during the day — so check it against the chart in counts. Look for the causes of a dip on the mailbox provider and bounce screens below.
EnlargeScreen 04 · Trend in shares. An example from the MTA-Hub interface.
Shares — delivered, deferred, bounced.
An hour without messages — no share — the line breaks off.
A night with a hundred messages and a day with two thousand look the same in percent — look at both charts.
Providers, reasons, addresses
3 screens
The next screens show exactly where the problem is: which mailbox providers your mail goes to, why messages don't arrive and which IP addresses sent them. All three work the same way: the bar length is the share of sending, the color is deliverability. They show whether a problem affects one address, one provider or the whole mailing.
05
Where your mail goes
Mailbox providers
Deliverability by provider: which mailbox providers your mail goes to and how each one receives it. The bar length is the share of sending, the color is deliverability. In the example most messages go to Google — 38% with 98.8% delivered, while Microsoft, with 21% of messages, has lower delivery, 98%. If one provider lags noticeably behind the rest, go to the “Providers” tab and dig into it separately. The provider is determined by the recipient domain. So corporate mail hosted by Google lands in the “Other” row, not in Google. The seventh row, Proton, is visible only on the “Providers” tab.
EnlargeScreen 05 · Where your mail goes. An example from the MTA-Hub interface.
Google — 38% of messages, 98.8% delivered.
Microsoft — 21% and 98%.
Yahoo — 12% and 98.2%.
Apple — 11% and 98.9%.
Other and GMX — 8% and 97.2%; 6% and 98.7%.
One more row — Proton — on the “Providers” tab.
06
Why mail doesn't arrive
Bounce reasons
Bounce reasons for the period — the way the mailbox provider itself named them. In the example there were 451 bounces in a day, and 63% of them are “no such mailbox”, another 13% are a full mailbox and 9% an abandoned one. All the bars are red: a bounce is a lost message, whatever the reason. But the reason tells you what to do with the address next, and the full breakdown of bounces and deferrals is on the “Queues & errors” tab. The bounce count here matches the one in the “The period's four figures” block. With “no such mailbox”, as for 63% of bounces in the example, resending is pointless — such addresses get cleaned out of your list.
EnlargeScreen 06 · Why mail doesn't arrive. An example from the MTA-Hub interface.
No such mailbox — 63% — 282.
Mailbox full — 13% — 58.
Mailbox abandoned — 9% — 42.
Provider requirements and no such domain — 5% each.
Server not responding — 4% — 20.
All the bars are red: a bounce is a lost message. But the reason tells you what to do with the address next.
07
Who's sending
Sending addresses
Sending addresses — which IPs the mail went out from and how mailbox providers received messages from each. 26 addresses worked during the day; the screen shows the top six by volume: the leaders have 99.3–99.5% delivery. Highlighted in yellow is 198.51.100.126 with 93.6% delivery, and the bar shows that the problem is that one address, not the whole sending. This way one bad address doesn't hide inside the average deliverability of the whole mailing. If you find a yellow address, open “Needs attention” below: it says which blacklist it's on, and there's a “Go to address” button. The “Addresses & reputation” tab has twenty more addresses with reverse DNS and warm-up stage.
EnlargeScreen 07 · Who's sending. An example from the MTA-Hub interface.
203.0.113.122 — 22% of messages, 99.3% delivery.
203.0.113.121 — 20% and 99.5%.
198.51.100.125 — 16% and 98.1%.
198.51.100.126 — in yellow — 93.6%.
Twenty more addresses — on the “Addresses & reputation” tab, with reverse DNS, blacklists and warm-up stage.
Attention and sources
2 screens
At the end — a list of what to fix and a check of the data sources. “Needs attention” collects only problems and leads to where they're solved. “Telemetry intake” shows which servers send MTA reports and when the latest ones arrived: without it you can't be sure of the numbers above.
08
Needs attention
Problems only
The “Needs attention” list is what needs fixing, without successful deliveries and extra noise. In the example there are five notes: the address 192.0.2.101 is on a blacklist, the mq-01 disk is 81% full, two addresses out of 28 have no reverse DNS, and lab-01 and mta-11 haven't sent a single MTA report. The buttons on the right narrow the list to delivery, reputation or servers. Every row leads to where the problem is solved — this list is a handy way to start your day. Notes fall into delivery, reputation and servers: if you're responsible for only one of these, keep your part with the button on the right. For example, “Go to server” for mq-01 takes you straight to the server whose disk is filling up.
EnlargeScreen 08 · Needs attention. An example from the MTA-Hub interface.
192.0.2.101 — on the psbl.surriel.com blacklist — “Go to address”.
mq-01 — disk 81% — “Go to server”.
No reverse DNS — 2 addresses out of 28 — “Go to addresses”.
lab-01 and mta-11 — no reports — server metrics are coming in, but the MTA hasn't sent a single report.
Every row leads to where the problem is solved.
09
Telemetry intake
Where the numbers come from
Telemetry intake shows where all the numbers above came from: which servers send MTA reports, how many events were received from each, and when the latest batch arrived. In the example 15 of 17 servers are sending data, the latest from one to six minutes ago, and there have been no events from lab-01 and mta-11 yet. Check here when the figures look odd: while a server is silent, its messages don't reach the analytics and the totals are understated. You see the event count for each server: the transactional tx-01 and tx-02 sent 143–145 thousand each, the MailerQ servers 108–110 thousand each, the rest 16–18 thousand each.
EnlargeScreen 09 · Telemetry intake. An example from the MTA-Hub interface.
Sending data — 15 of 17 servers, latest batch 1–6 minutes ago.
tx-01 and tx-02 — 143–145 thousand events each.
MailerQ — 108–110 thousand each.
lab-01 and mta-11 — no events yet.
While a server is silent, its messages don't reach the analytics, and the numbers above are understated.
06 / Questions about analytics
Frequently asked questions about email sending analytics.
In short: how the score and shares are calculated and why the numbers may be understated.
A score out of 100, five parts with points and a line saying what's pulling the score down.
What is the score made of?
Five parts: deliverability, spam and complaints, mailbox provider requirements, infrastructure and blacklists. The line under the score names what's pulling it down.
Why are shares counted from messages, not attempts?
A message deferred three times and delivered on the fourth try is one message. Otherwise retries would distort the shares.
What is a percentage point?
The difference between shares: it was 98.4%, now it's 98.3% — a drop of 0.1 percentage points, not 0.1 percent.
Where do the numbers come from?
From the reports of the MTAs themselves — PowerMTA and MailerQ — on every server, rolled up by hour and by day.
Why might the numbers be understated?
If a server isn't sending reports, its messages don't reach the analytics. The “Telemetry intake” block says so plainly.
Where does corporate mail on Google go?
Into “Other”: the mailbox provider is determined by the recipient domain from a set list, and corporate domains aren't on it.
Why does the current hour look different?
It isn't over yet: the band is shaded and captioned “hour in progress”, so incomplete data doesn't look like a crash.
What period can I choose?
A day, a week or 30 days. Every number is compared with the previous period of the same length.
07 / Next step
Open the detailed analytics tabs.
The overview answers the main questions. The details are on the analytics tabs: mailbox providers, queues and errors, addresses and reputation, servers.
If a number in the overview looks worrying, a tab shows it by each mailbox provider, reason, address or server.