Gmail, Outlook, Yahoo deliverability. A drop at one provider shows up right away.
Average deliverability hides a problem at a single mailbox provider. This tab splits your sending by provider: who's worse off, which bounces, and exactly what the provider's server replied.
The chart shows the hour delivery dropped, and the breakdown shows the provider's reply word for word, which you use to find the cause.
All sending for the day gets 97% delivered — “healthy” overall. But Microsoft (Outlook, Hotmail) is at 91.9%: almost one message in twelve to its mailboxes was rejected. The deliverability table by mailbox provider shows a drop like this right away, while the average hides it.
How providers accept our mail over the day
01 · Google98.5% · 9,940
02 · Apple98.8% · 2,872
03 · Yahoo98%
04 · Microsoft91.9% · 5,500
The state in words: “healthy” from 95%, “attention” at 90–95%, “drop” below 90%
Too little data
Not an alarm
While there are fewer than twenty messages, the row honestly says “too little data” instead of showing an alarming red: it's too early to draw conclusions from a handful of messages.
HMTA-Hub
threshold
Under 20 messagesToo little data
not redtoo early to judge
Response time
From 0.8 to 1.9 s
How long the provider's server takes to respond — from the first attempt to the reply, without waiting in the queue. Google is the fastest at 0.8 seconds, “Other” is the slowest.
GGoogle
reply
Response time0.8 s
1.2 s on averageYahoo — 1.7 s
02 / The provider's bounce reasons
Why a mailbox provider rejects messages: its server's reply.
The breakdown opens by itself on the provider with the lowest delivery: bounce reasons as bars and its server's replies word for word, with SMTP codes. They show not just “bad” but the specific cause — for example, an address on Microsoft's block list — and what to do next.
Microsoft — why it rejects
Requirements — 76%
5,500 messages, 445 bounces, 364 deferrals. Reasons: provider requirements — 76%, no such mailbox — 19%, mailbox abandoned — 2%.
MMicrosoft
bounces
Bounces445
requirements — 76%364 deferrals
Code S3150
Block list
“…part of their network is on our block list (S3150)” — 336 times. This is a specific mq-02 address on Microsoft's block list, and you ask Microsoft's sender support to remove it.
Nmq-02
550 5.7.1
Microsoft replyS3150 · 336 times
block list198.51.100.125
The labels tell you how it ended: “permanent” — the message is lost, “temporary” — the provider asked you to wait, like “451 4.7.650 … rate limited” — 315 deferrals.
03 / Hourly chart
Since what hour a provider's deliverability dropped.
The deliverability chart by mailbox provider is built by hour: until morning Microsoft's line holds at 94–100%, and from 09:00 it falls to 81–84%. Once you know the hour of the drop, you look for the cause in what happened around that time.
Microsoft since 09:00
81–84%
The other providers stay at 95–100% almost all the time, while Microsoft's line falls from the morning on. The last hour is shaded and captioned “hour in progress”.
MMicrosoft
by hour
From 09:0081–84%
94–100% until morninghour in progress
Messages behind a point
Don't be misled
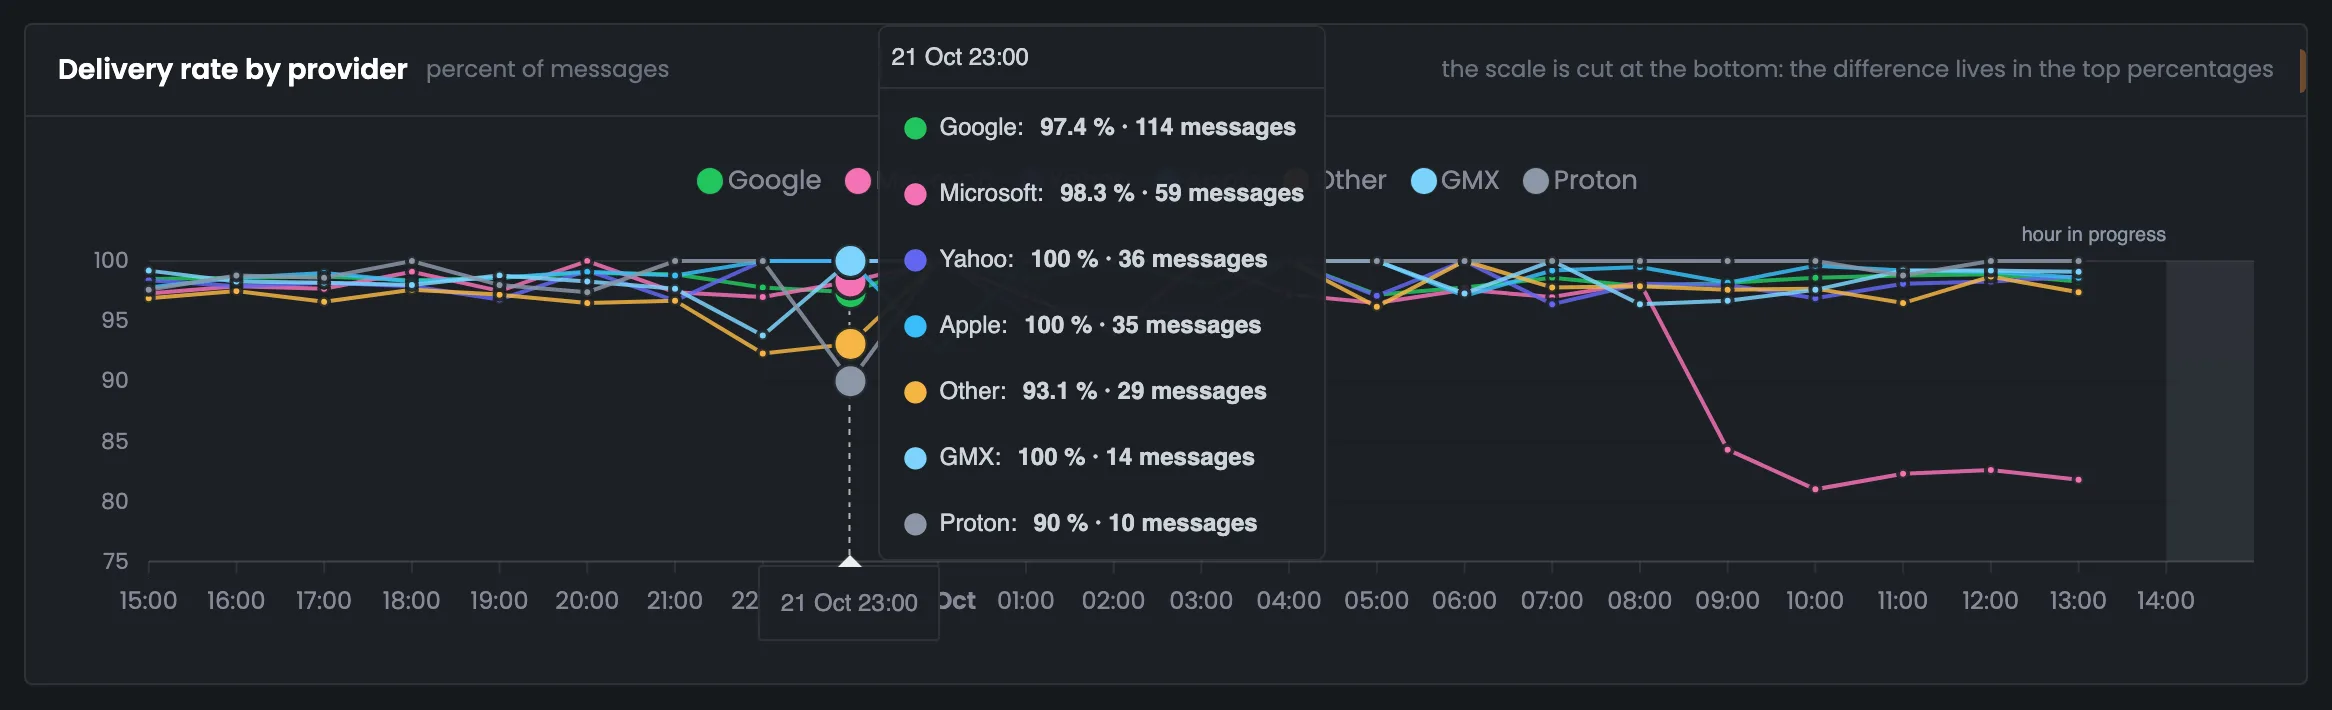
Proton's night dip to 90% at 23:00 is ten messages and one bounce. Each point's tooltip shows how many messages its share was calculated on.
PProton
23:00
Night point90%
10 messages1 bounce
The chart's scale doesn't start at zero, and the page says so in a caption: on a full scale all the lines would merge at the top edge.
04 / Problem provider list
Mailbox providers that need looking into.
Providers with delivery below 95%, complaints from 0.3% or a response slower than 10 seconds go into a separate list — with the numbers that put them there. Only providers with enough messages to draw conclusions make the list, so random dips don't clutter it.
On the list
Microsoft
Accepts 91.9% of what's sent — a drop across 5,500 messages.
Switch
Only with a drop
Leaves only providers in the “attention” and “drop” states in the table; “too little data” isn't included.
Privacy
Addresses hidden
The recipient address in the provider's reply is hidden — the domain is enough for the analysis.
05 / The interface in detail
The “Providers” tab interface — 7 screens.
Four figures, the provider table, the breakdown, the hourly chart, a point tooltip, the to-do list and the drop filter. Above each screenshot: why the screen matters. Below it: what it shows.
Table and breakdown
3 screens
The tab starts with four figures about acceptance and the provider table: messages, share, delivery, bounces, complaints and response time for each. Here you see which mailbox providers accept your mail worse than the rest. Clicking a row opens the breakdown — bounce reasons and the provider server's replies word for word.
01
Four figures about acceptance
Providers, best, worst, response time
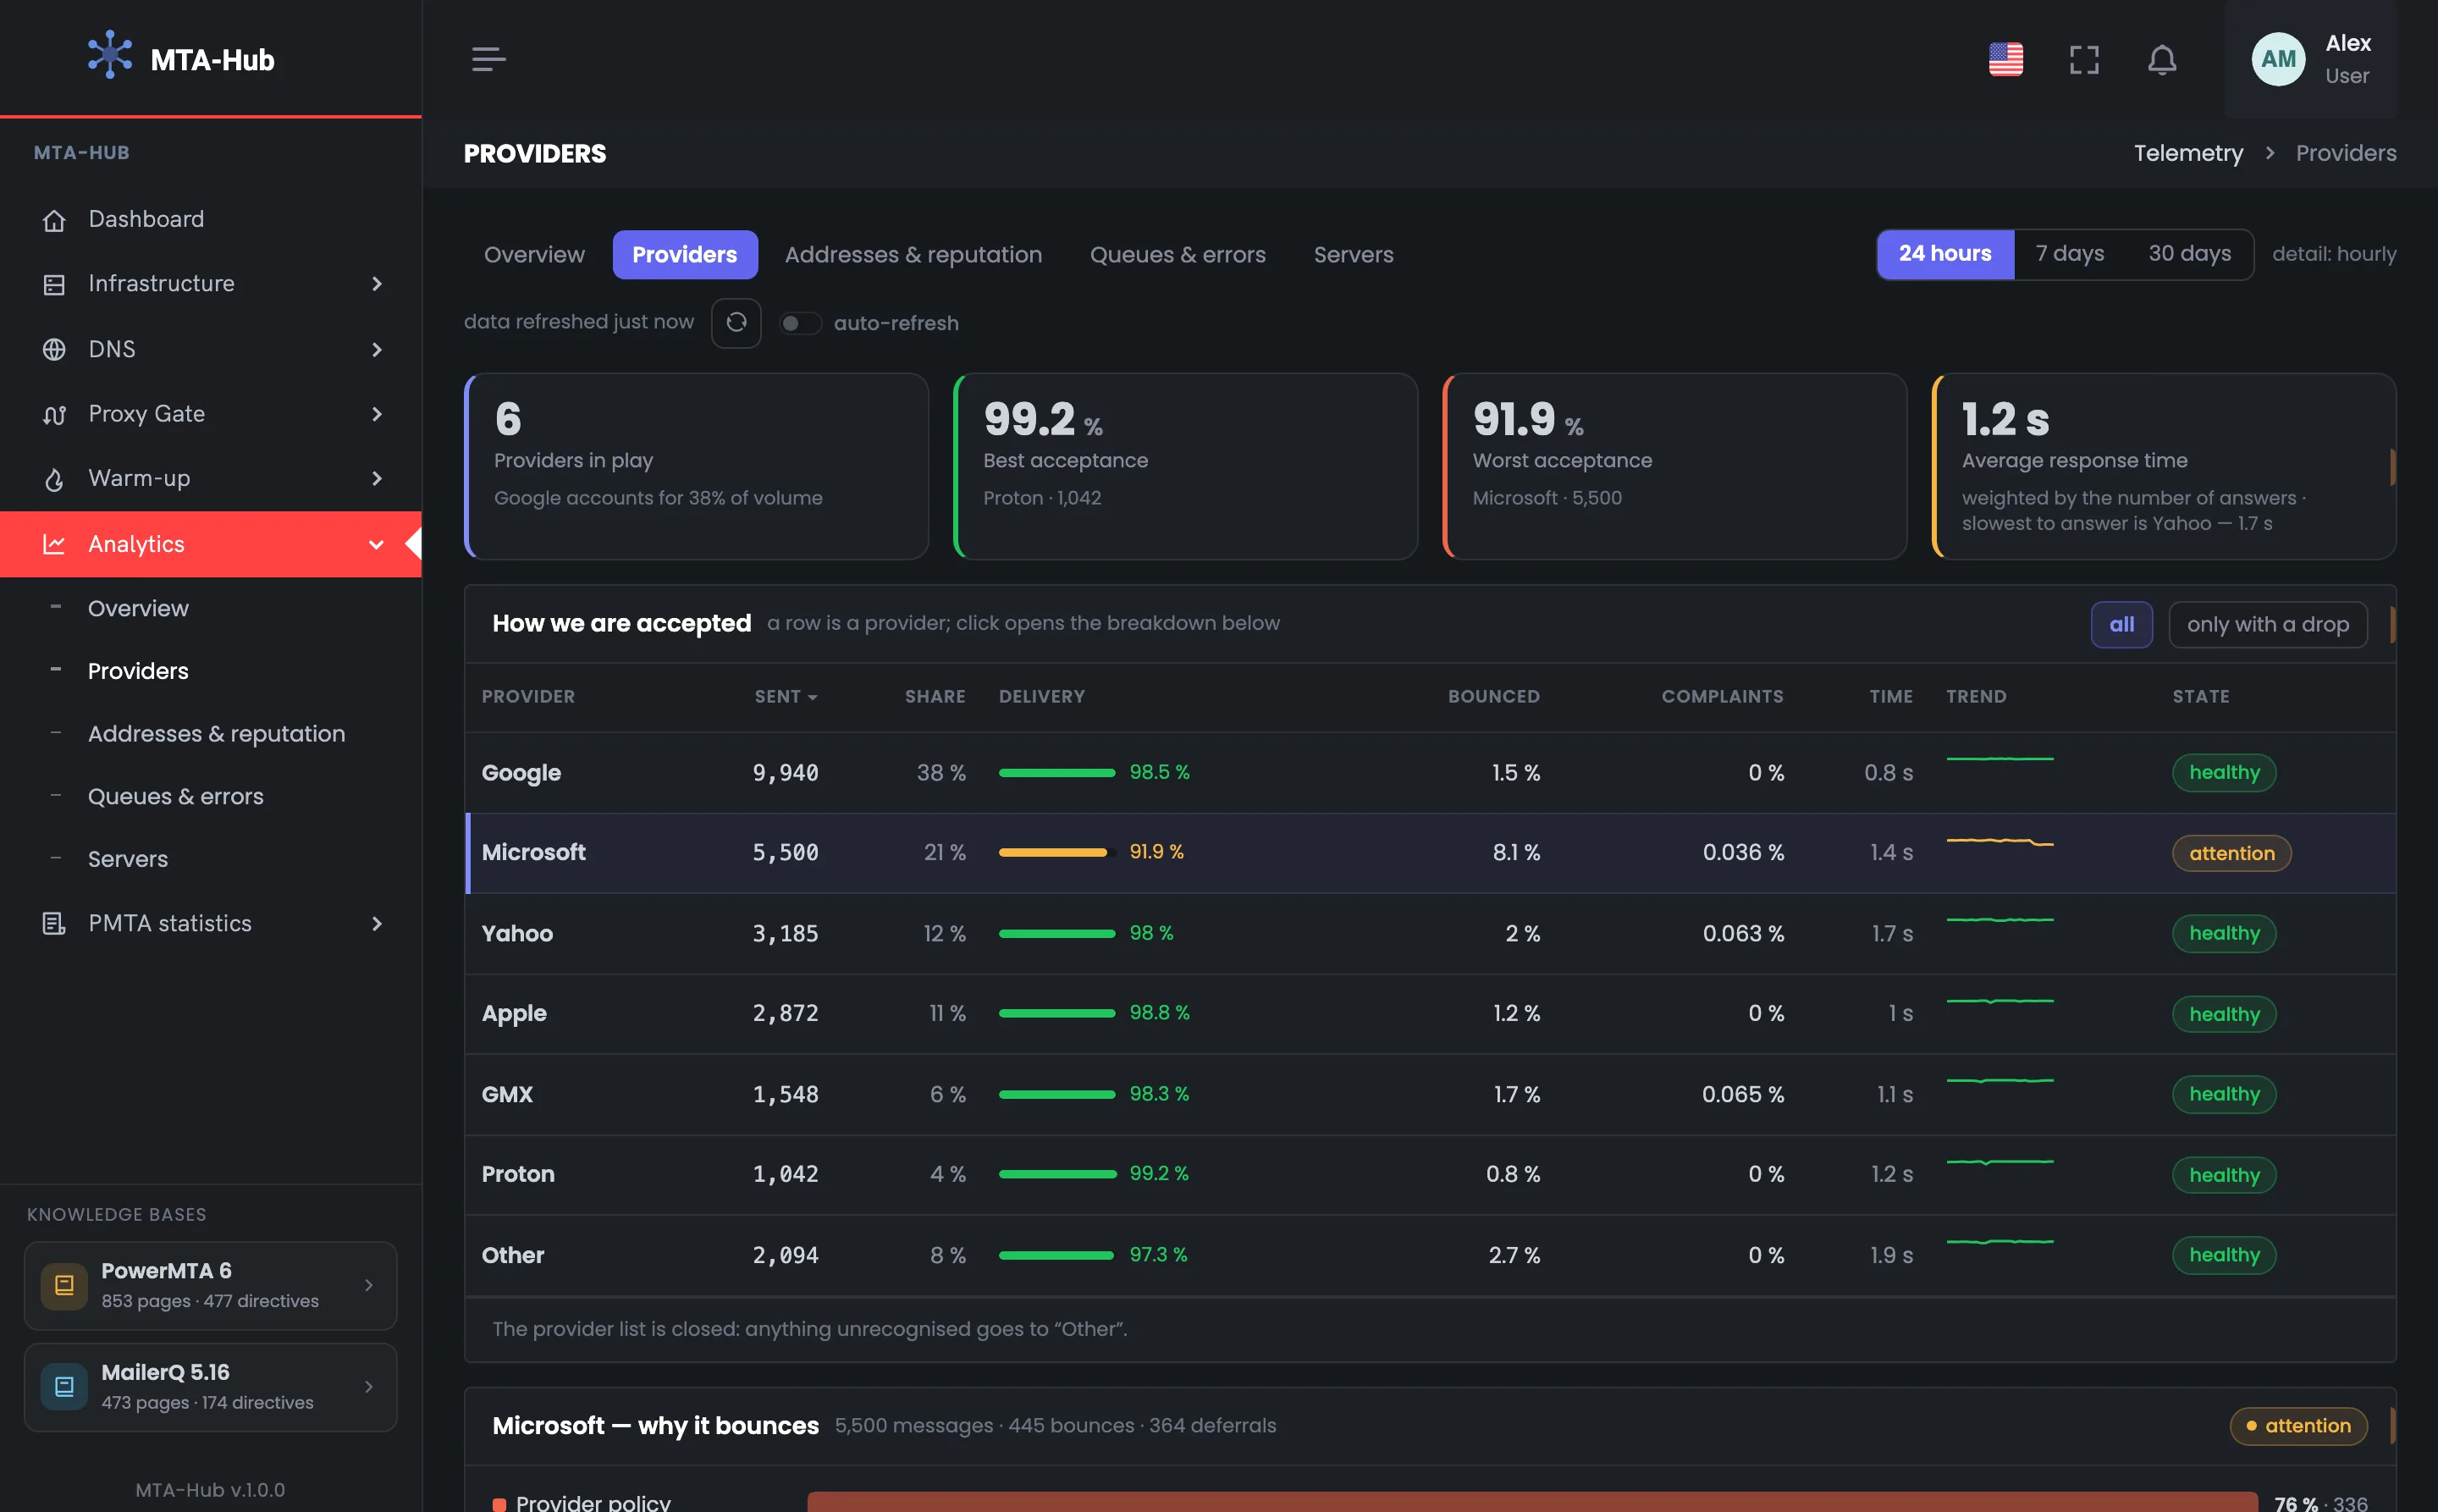
Four figures about acceptance over the day — short mailbox provider statistics before the table. In the example six providers accepted the mail, the largest is Google with 38% of the volume. Proton accepts best — 99.2% on 1,042 messages, Microsoft worst — 91.9% on 5,500. The fourth figure is the providers' average response time, 1.2 seconds. If the “worst” lags noticeably behind the “best”, as here, look at the table and that provider's breakdown next. “Other” isn't counted as a provider: it's all the domains not on the list, not a separate provider. The average response time is weighted by each provider's number of replies; Yahoo is the slowest to respond — 1.7 seconds.
EnlargeScreen 01 · Four figures about acceptance. An example from the MTA-Hub interface.
Providers — 6, the largest is Google, 38% of the volume.
Best — Proton — 99.2% on 1,042 messages.
Worst — Microsoft — 91.9% on 5,500.
Response time — 1.2 s on average; Yahoo is the slowest — 1.7 s.
“Other” isn't counted as a provider: it's all the domains not on the list.
02
How providers accept our mail
A row per provider
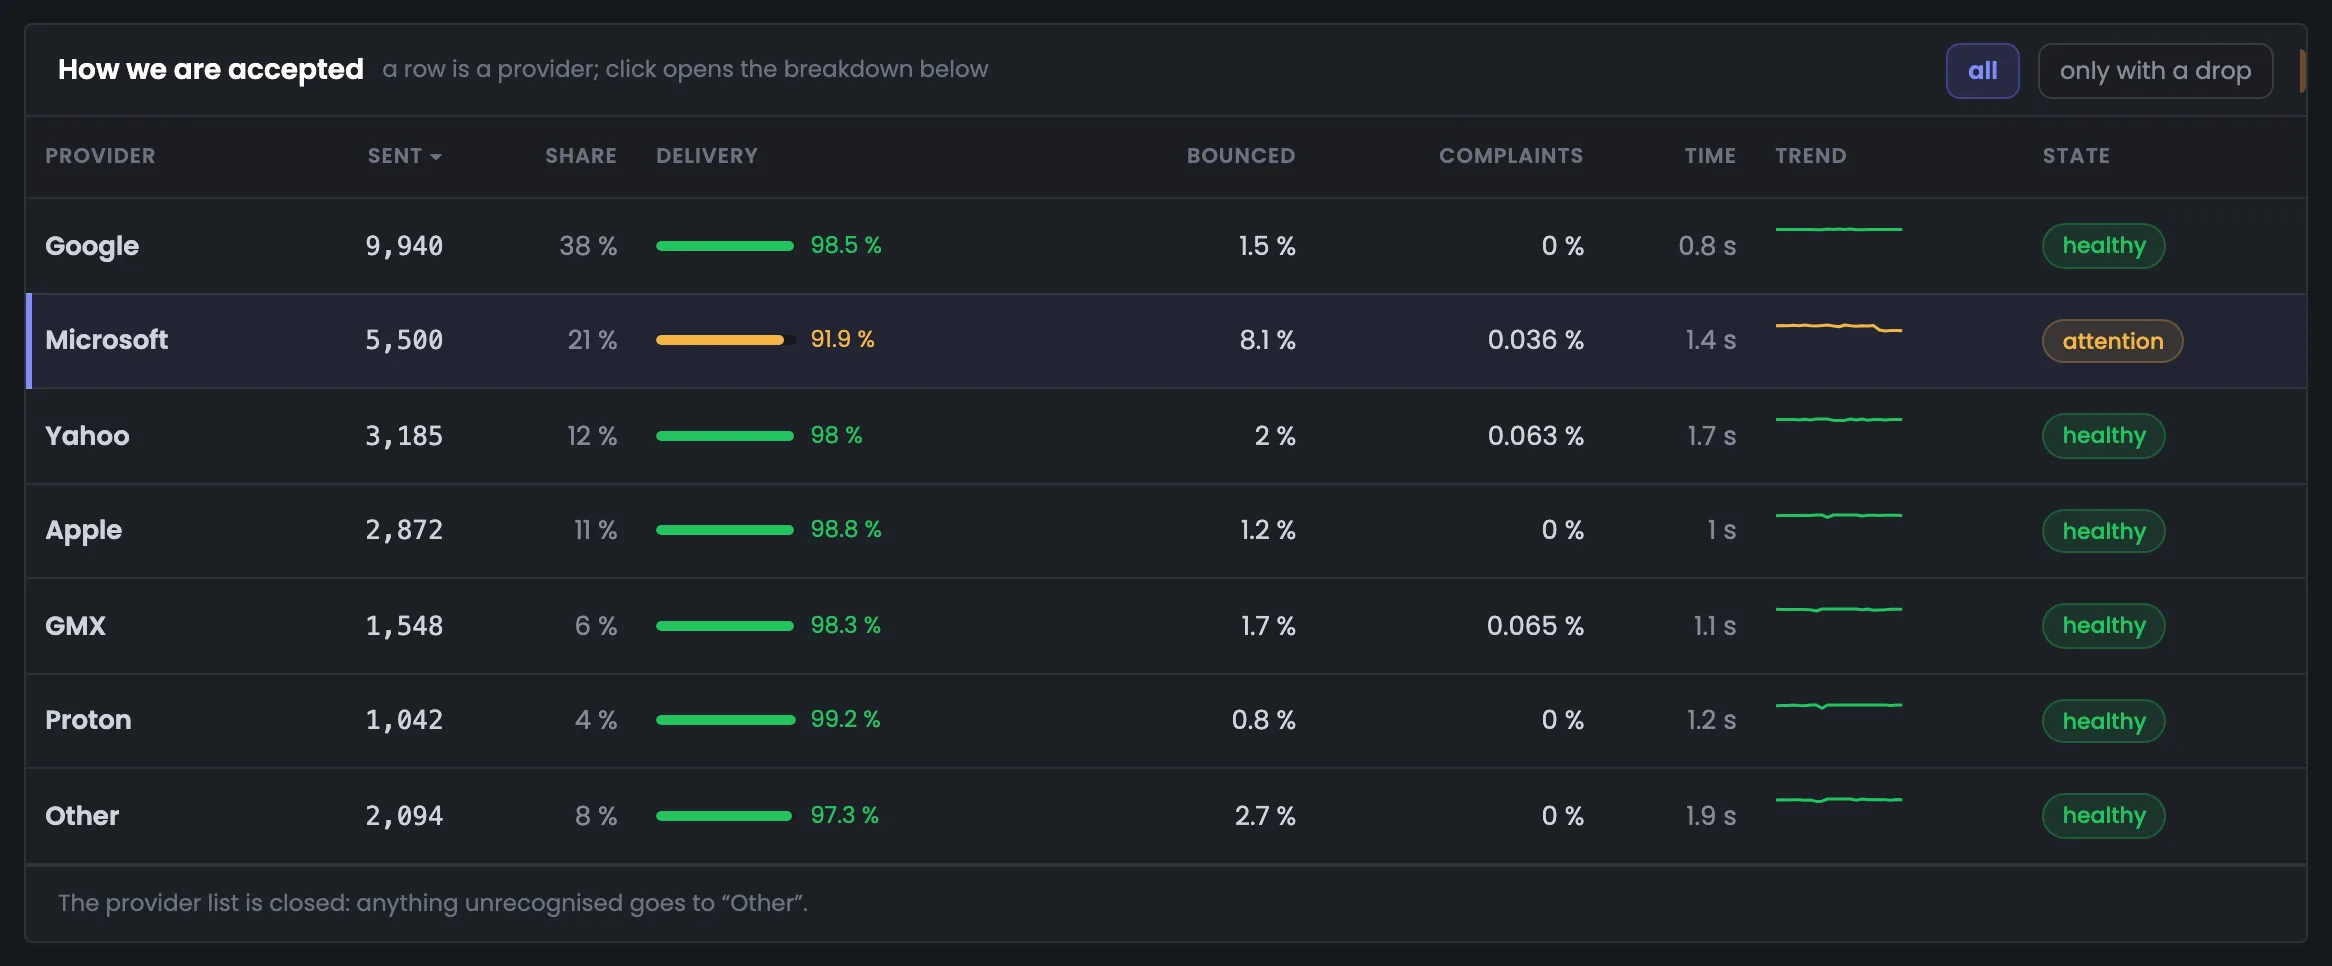
The tab's main table: a row per provider with messages, share, delivery, bounces, complaints, response time and a chart for the period. You use it to compare the deliverability of Gmail (Google), Outlook (Microsoft), Yahoo and the rest. In the example they all hold around 98–99%, while Microsoft is at 91.9% with the state “attention”. You can sort the table by any column, and clicking a row opens that provider's breakdown. The “Other” row always stays at the bottom. The “Trend” column draws hourly delivery on a 0–100% scale: Microsoft's line sags toward the end of the day — the first sign that you should look at the hourly chart below next.
EnlargeScreen 02 · How providers accept our mail. An example from the MTA-Hub interface.
Google — 9,940 messages, 98.5%.
Microsoft — 5,500, 91.9%, 8.1% bounced — “attention”.
Other — 2,094 messages, 97.3% — always at the bottom.
Trend — hourly delivery on a 0–100% scale.
You can sort the table; clicking a row opens its breakdown.
03
Provider breakdown
Microsoft — why it rejects
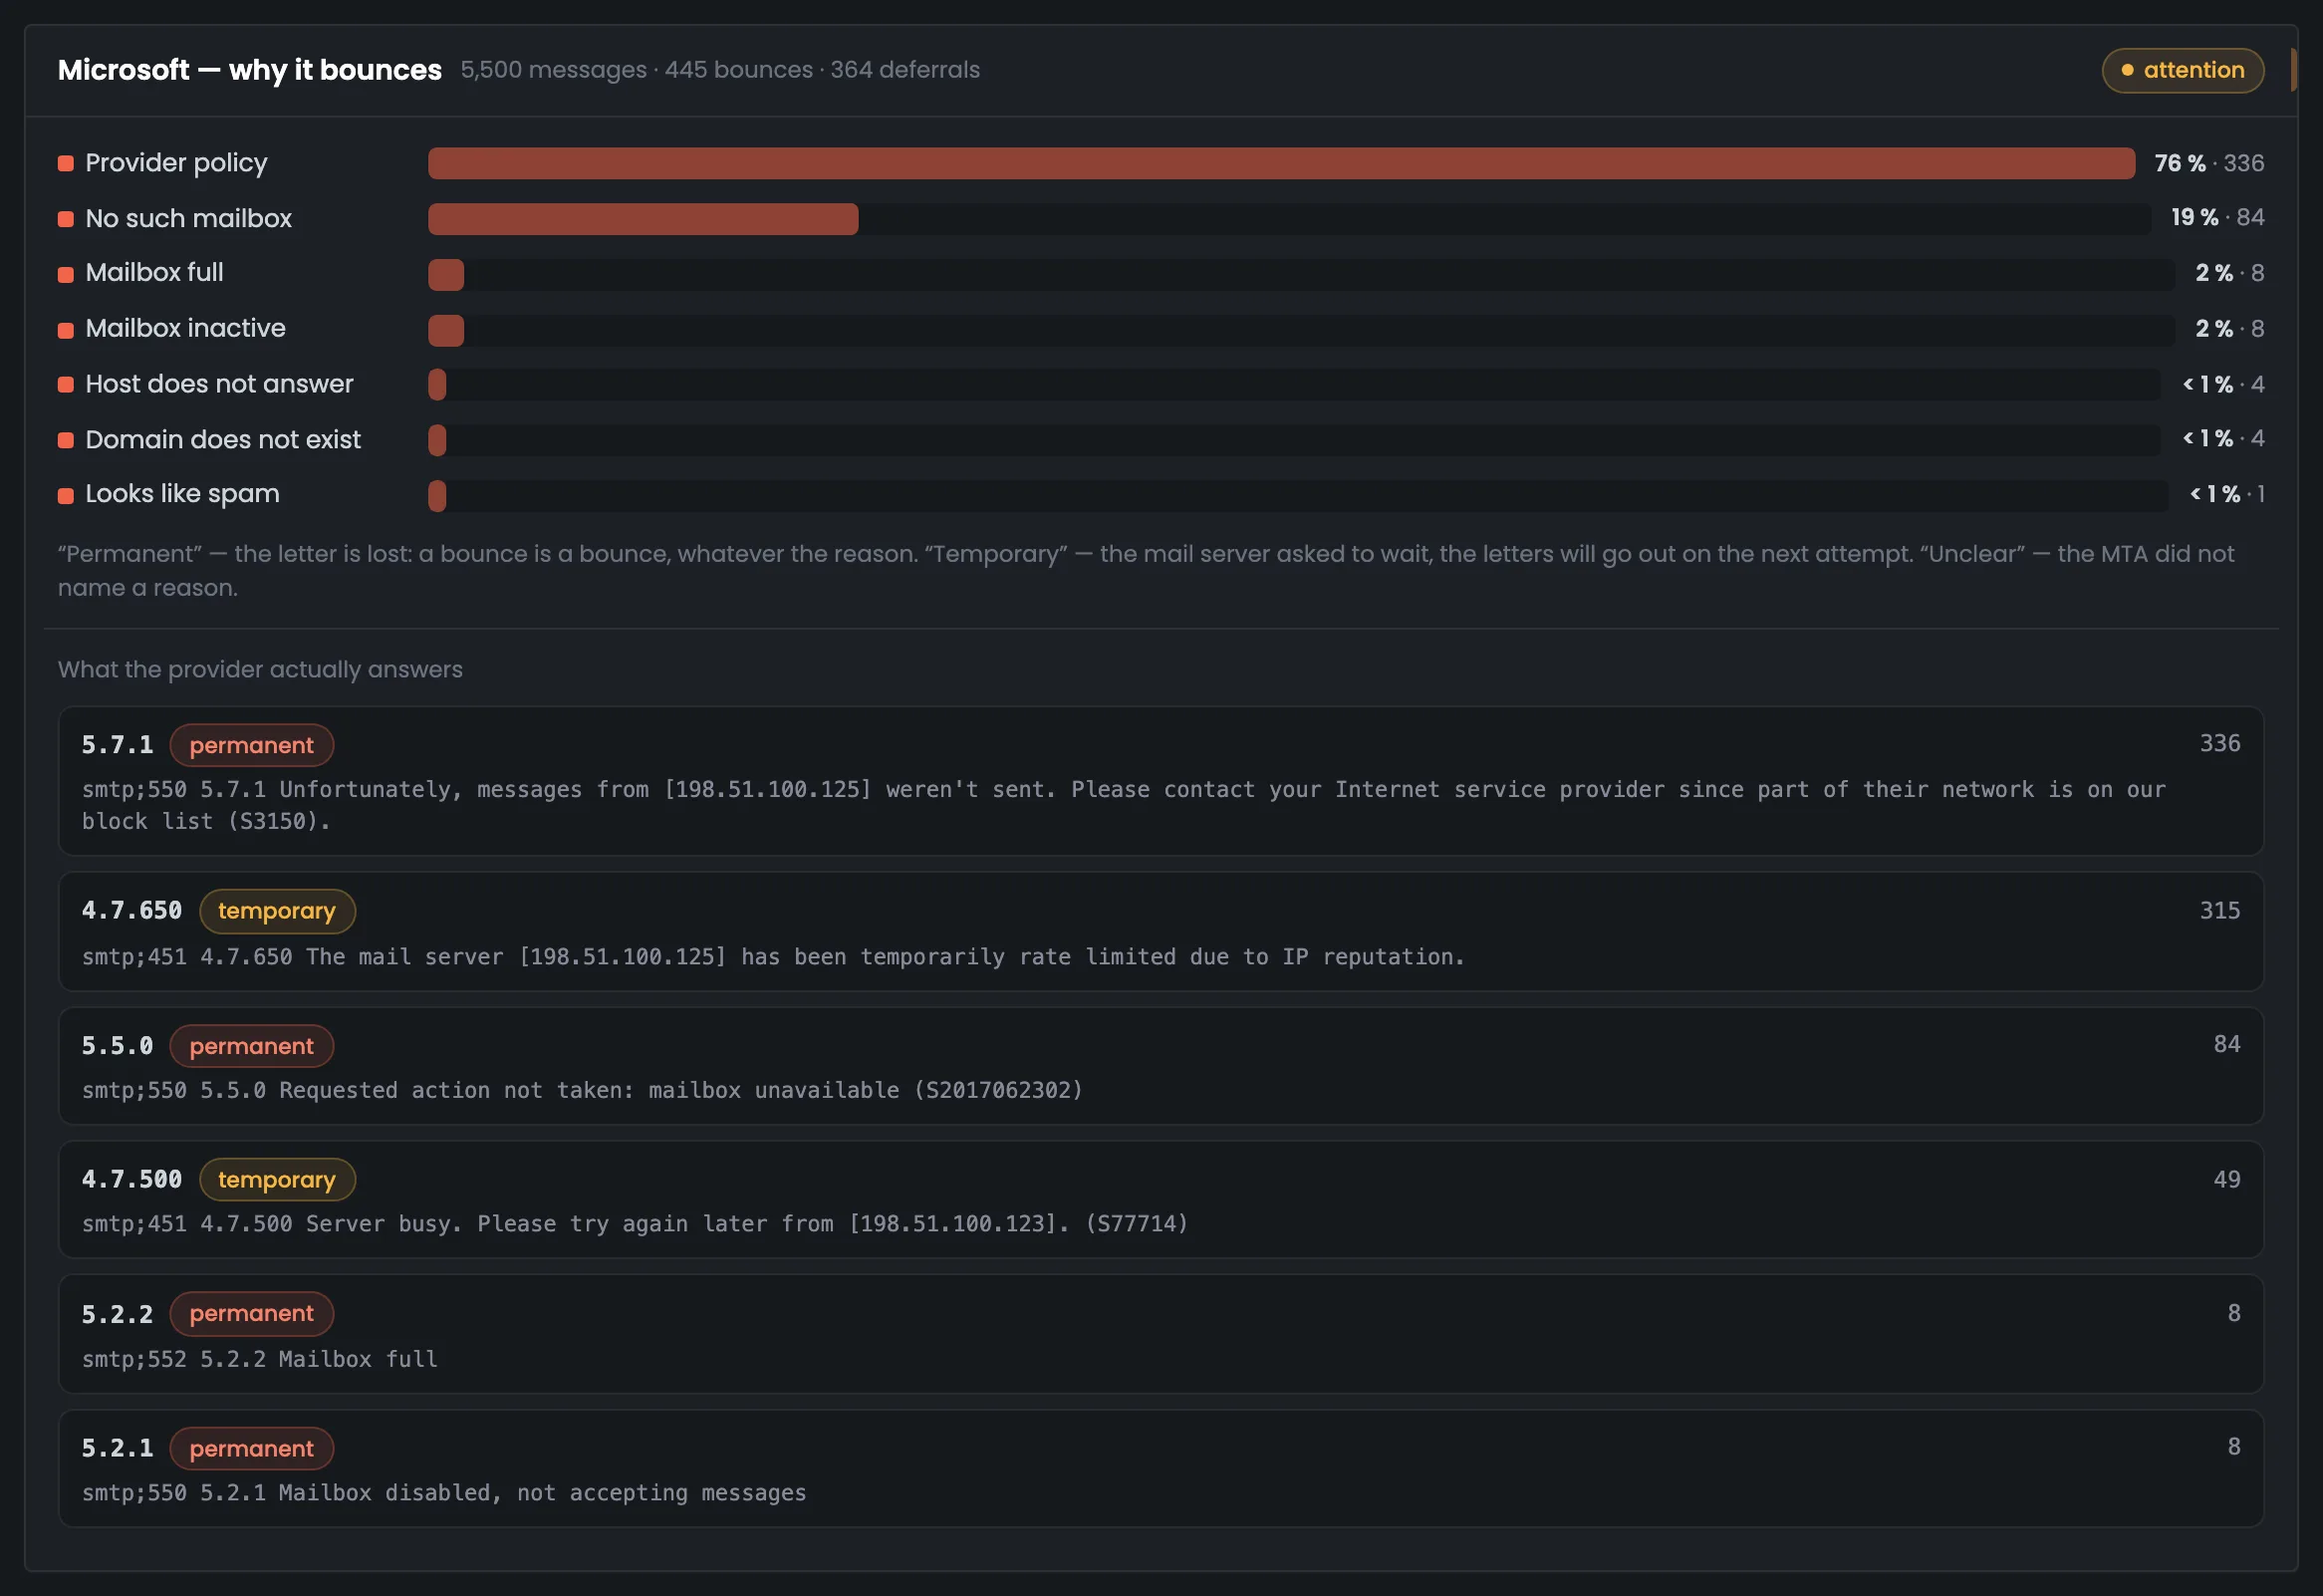
The provider breakdown answers why it rejects messages. In the example it's Microsoft: 5,500 messages, 445 bounces and 364 deferrals, with 76% of bounces due to provider requirements. Below are its server's replies word for word, with codes and the number of repeats, labeled “permanent” or “temporary”. The code also points to the fix: S3150 means the mq-02 address is on Microsoft's block list, and you ask sender support to remove it. The “temporary” label, as on “451 4.7.650 … rate limited” with 315 deferrals, means the provider asked you to wait and the message is still being retried. Next, check the address itself on the “Addresses & reputation” tab.
EnlargeScreen 03 · Provider breakdown. An example from the MTA-Hub interface.
451 4.7.650 — “…rate limited due to IP reputation” — 315 deferrals, “temporary”.
Code S3150: the mq-02 address is on Microsoft's block list — you ask Microsoft's sender support to remove it.
Chart
2 screens
Below is deliverability by mailbox provider by hour, one line per provider. The chart shows since what hour the drop started and at which provider. A point's tooltip shows how many messages its share was calculated on, so you don't mistake chance for a problem.
04
Deliverability by provider
One line each, by hour
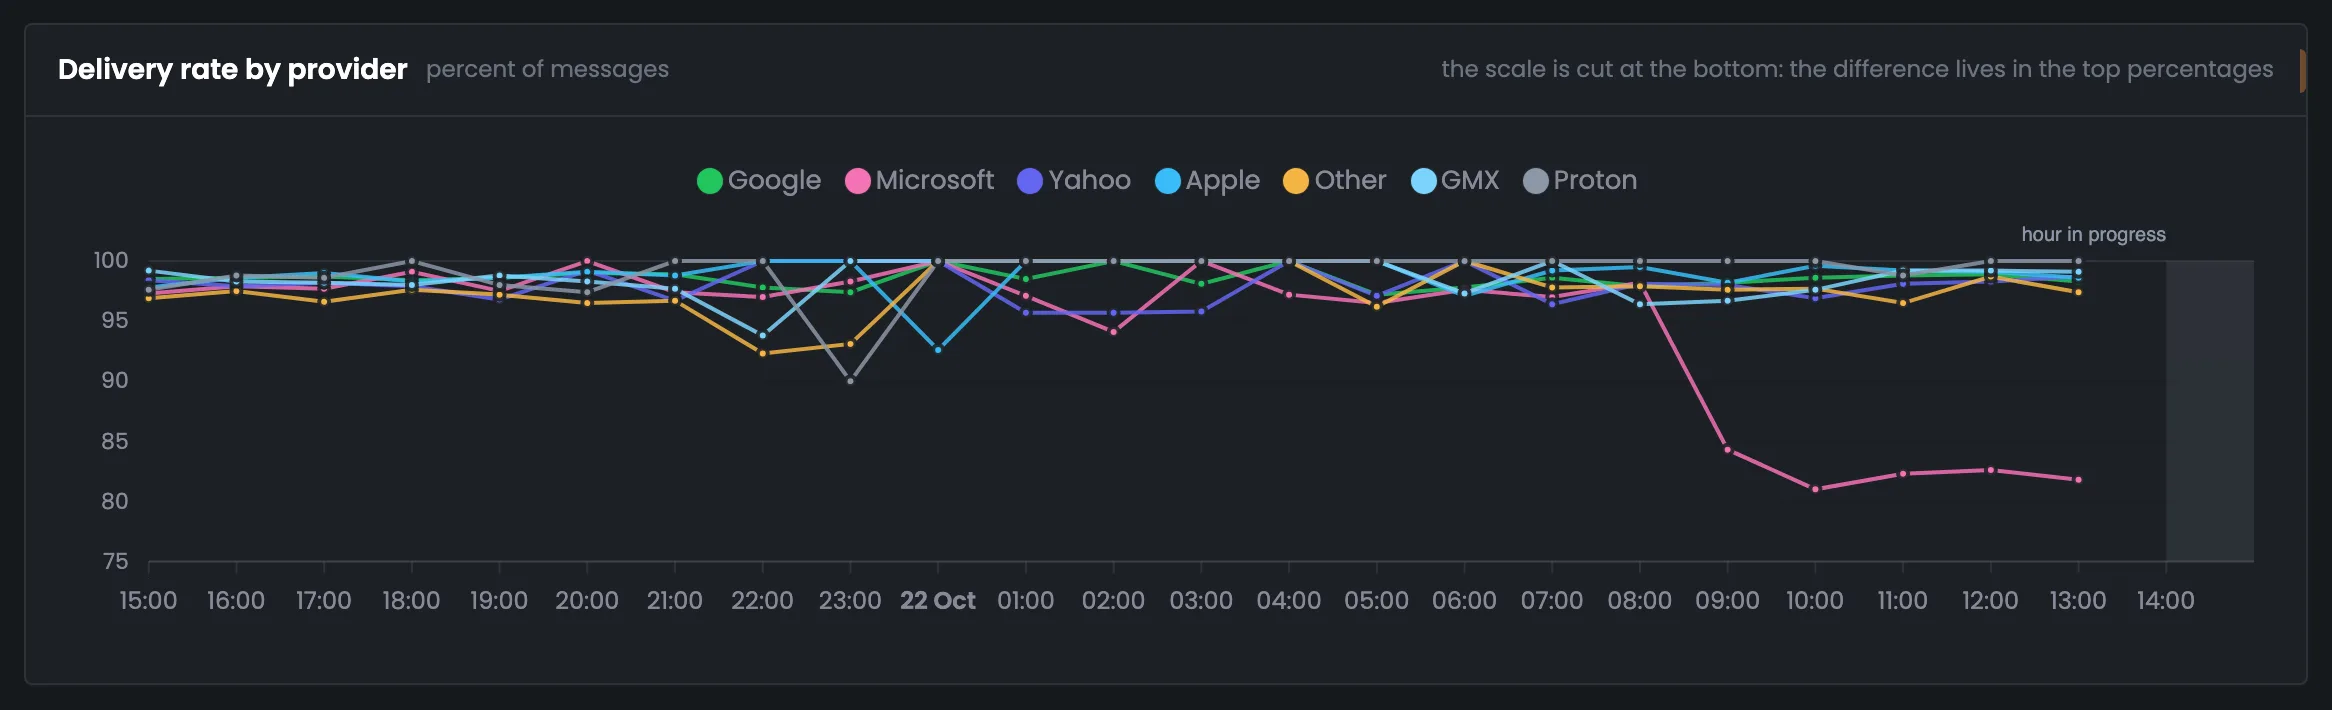
The deliverability chart by mailbox provider: one line each, by hour over the period. It shows not only who's doing badly but since what hour. In the example the other providers stay at 95–100% almost all the time, while Microsoft's line falls to 81–84% from 09:00. The scale doesn't start at zero, and the chart says so. Once you find the hour of the drop, compare it with what changed in your sending around that time. The last hour is shaded and captioned “hour in progress”. When there are more than eight providers, the largest get their own lines and the rest share one. How many messages are behind each point is shown in a tooltip — the next screen is about that.
EnlargeScreen 04 · Deliverability by provider. An example from the MTA-Hub interface.
The rest — 95–100% almost all the time.
Microsoft — from 09:00 — 81–84%.
Last hour — shaded, “hour in progress”.
When there are more than eight providers, the largest get their own lines and the rest share one.
05
Messages behind a point
Point tooltip
A chart point's tooltip shows how many messages the share for that hour was calculated on. It helps you tell a real drop from chance on a small number of messages. In the example Proton's night dip to 90% at 23:00 is just ten messages and one bounce, while Google has 97.4% on 114 messages in the same hour. Before worrying about a sharp point, hover over it and check the message count. This matters especially during warm-up, when there are few messages per hour. The chart deliberately has no message-count threshold, so the tooltip gives you the number to decide “alarm or chance”. The “too little data” rows in the table work the same way: rows with fewer than twenty messages aren't shown in an alarm color.
EnlargeScreen 05 · Messages behind a point. An example from the MTA-Hub interface.
Proton at 23:00 — 90% — ten messages and one bounce.
Google in the same hour — 97.4% on 114 messages.
The chart deliberately has no minimum message count: during warm-up there are few messages per hour, and the chart would stand empty.
What to fix
2 screens
At the end — a list of mailbox providers that need looking into, and a switch above the table. The list builds itself from the delivery, complaint and response-time thresholds. The switch leaves only providers with a drop in the table, without the “too little data” rows.
06
What to fix
To-do list
The “What to fix” block is a list of providers that need looking into, instead of a long report. Providers land here with delivery below 95%, complaints from 0.3% or a response slower than 10 seconds, and only if there are enough messages to draw conclusions. In the example only Microsoft is on the list: it accepts 91.9% of what's sent, a drop across 5,500 messages. Start your investigation with this list — it's shorter than the table and names right away the numbers that put a provider there. The list has no more than six rows, with “Other” always at the end. The next step for each row is the provider breakdown above: bounce reasons and its server's replies word for word.
EnlargeScreen 06 · What to fix. An example from the MTA-Hub interface.
Microsoft — accepts 91.9% — a drop across 5,500 messages.
Who gets on it — delivery below 95%, complaints from 0.3% or a response slower than 10 seconds.
No more than six rows, “Other” at the end.
07
Only with a drop
Switch above the table
The “only with a drop” switch above the table hides providers where everything is fine. It's handy when there are many providers and you need to quickly find those in the “attention” or “drop” state. In the example, after you turn it on, only Microsoft is left in the table. The “too little data” rows aren't included in this mode: it's too early to draw conclusions from a handful of messages, and they would only get in the way. Turn the switch off to see all providers again. It includes the “attention” (90–95% delivery) and “drop” (below 90%) states. Clicking a remaining row opens its breakdown — from the filter to the bounce reasons is a single step.
EnlargeScreen 07 · Only with a drop. An example from the MTA-Hub interface.
Left — only Microsoft.
Not included — the “too little data” rows.
It's too early to draw conclusions from rows with few messages.
06 / Questions about providers
Frequently asked questions about deliverability by provider.
In short: how the mailbox provider is determined and how to tell a drop from chance.
Bounce reasons as bars and the Microsoft server's replies word for word, with codes.
How is the mailbox provider determined?
By the recipient domain from a set list: gmail.com is Google, outlook.com and hotmail.com are Microsoft. Other domains go into “Other”.
When is a provider in a “drop”?
Below 90% delivery. From 90 to 95% — “attention”, from 95% — “healthy”.
Why “too little data”?
While there are fewer than twenty messages, the share is random — so the row isn't shown in an alarm color.
Where do the provider's replies come from?
From the event log: bounces, deferrals and complaints with the server's reply word for word.
What is response time?
From the first sending attempt to the provider's reply, without the time spent waiting in the queue.
Why doesn't the chart scale start at zero?
On a full scale all the lines would merge at the top edge. The page says so in a caption.
How do I tell a dip from chance?
By the number of messages behind the point: a night 90% on ten messages isn't a provider problem.
Are recipient addresses visible?
No, the address in the provider's reply is hidden — the domain is enough for the analysis.
07 / Next step
Check the reputation of your sending IP addresses.
The provider has named the cause — next you look at the sending address: which blacklists it's on, whether it has reverse DNS, what warm-up stage it's at.
All bounces and deferrals with codes — on the “Queues & errors” tab.