Deferred messages and bounces. What the provider said and what to do.
A bounce means the message is lost; a deferral means the mailbox provider asked you to wait. This tab shows them separately and takes you from the big picture down to the cause.
How many messages are waiting right now, which “server — provider” pairs are piling up deferrals, and what mailbox providers replied when they rejected mail — word for word, with advice.
A bounce and a deferred message — what's the difference.
A bounce means the message is lost. A deferred message is one the mailbox provider asked you to send later: it stays in the queue, and the MTA will try again. These are different things, and the tab shows them separately: first the mail queue right now, then bounces and deferrals for the period.
Period figures
01 · In queues now878 messages
02 · 24-hour peak4,112
03 · Bounces762 · 2.8%
04 · Temporary51% of failures
The queue is shown as of now, everything else is for the period: the numbers sit side by side but mean different things
Where the queue piles up
4 servers
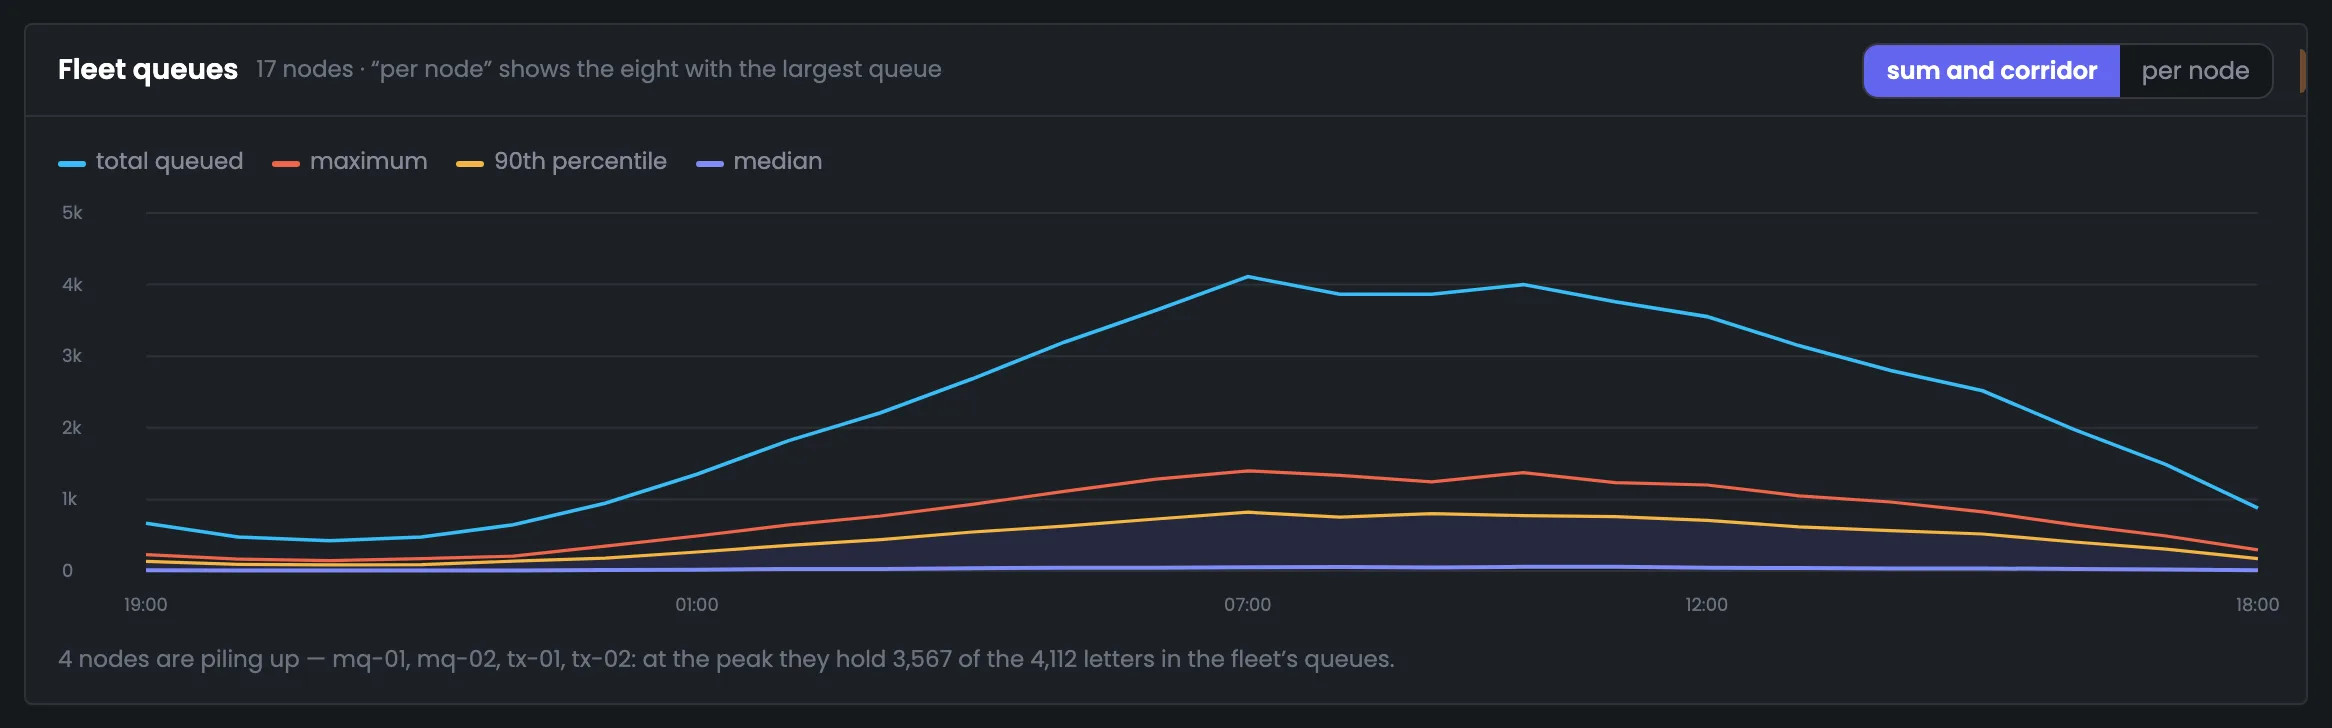
By seven in the morning the total queue climbs to 4,112, and the line under the chart tells you where: mq-01, mq-02, tx-01 and tx-02 hold 3,567 messages at the peak. The other thirteen servers hold 545 between them.
HMTA-Hub
measurement
Queue peak4,112 messages
3,567 on 4 serversthe rest — 545
By server
As separate lines
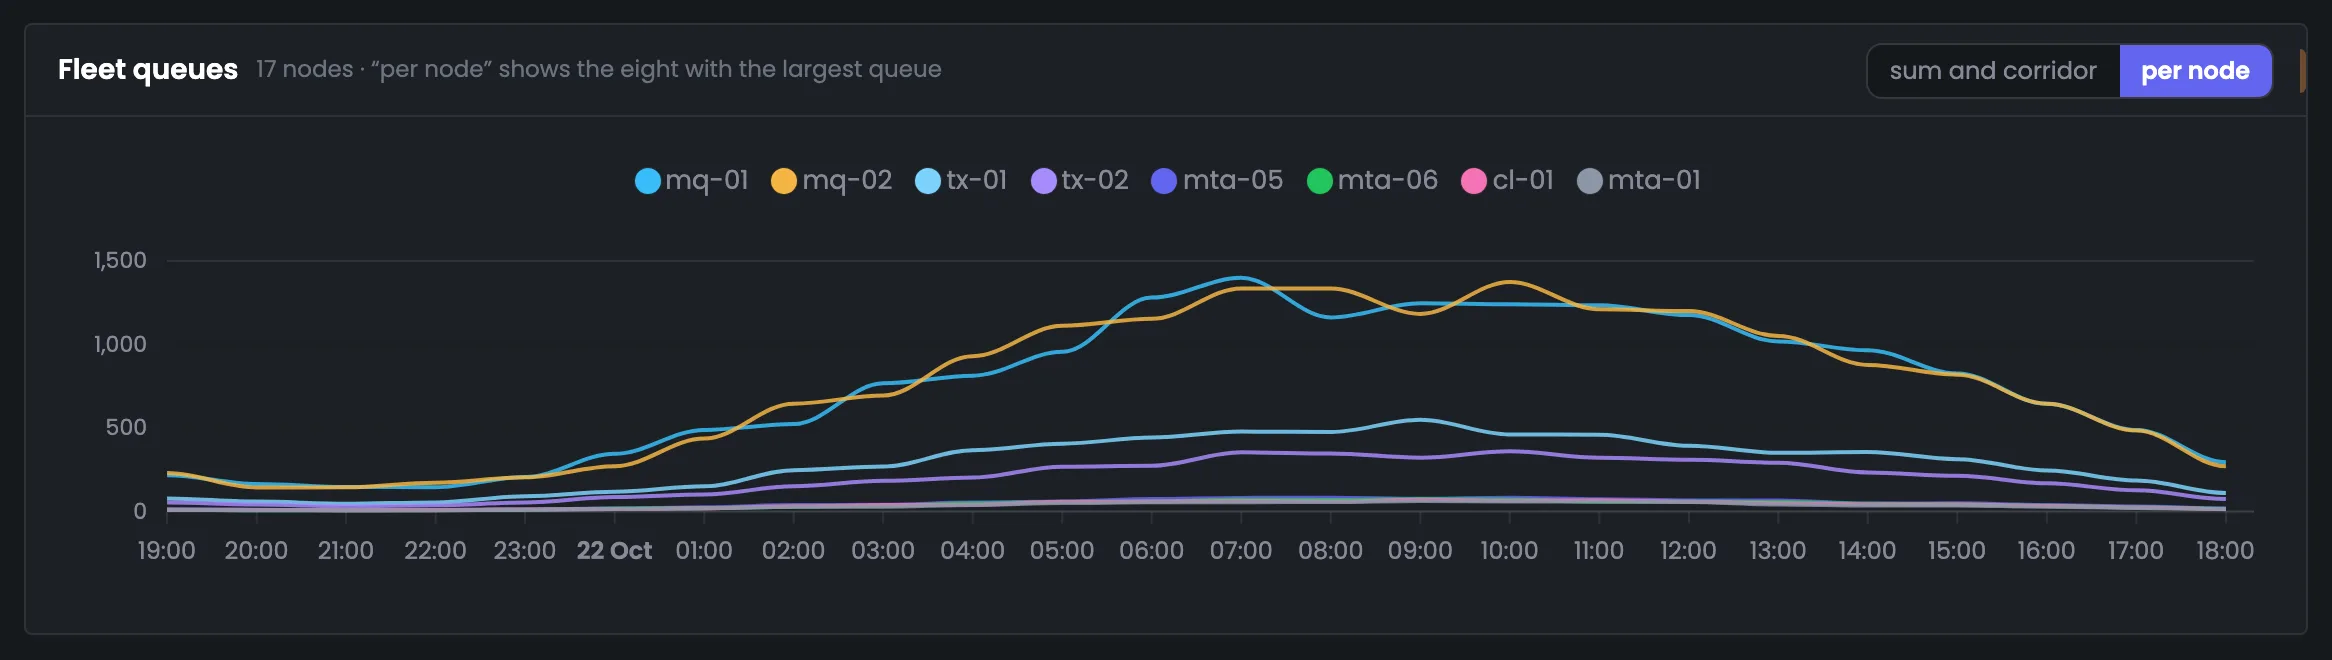
The “by node” switch shows the eight servers with the largest queue: both MailerQ servers reach about 1,400 messages, the transactional ones 350–550.
NMailerQ
queue
mq-01 and mq-02about 1,400
tx — 350–550marketing — near the bottom
02 / Where deferrals pile up
Deferred messages by “server — provider” pair.
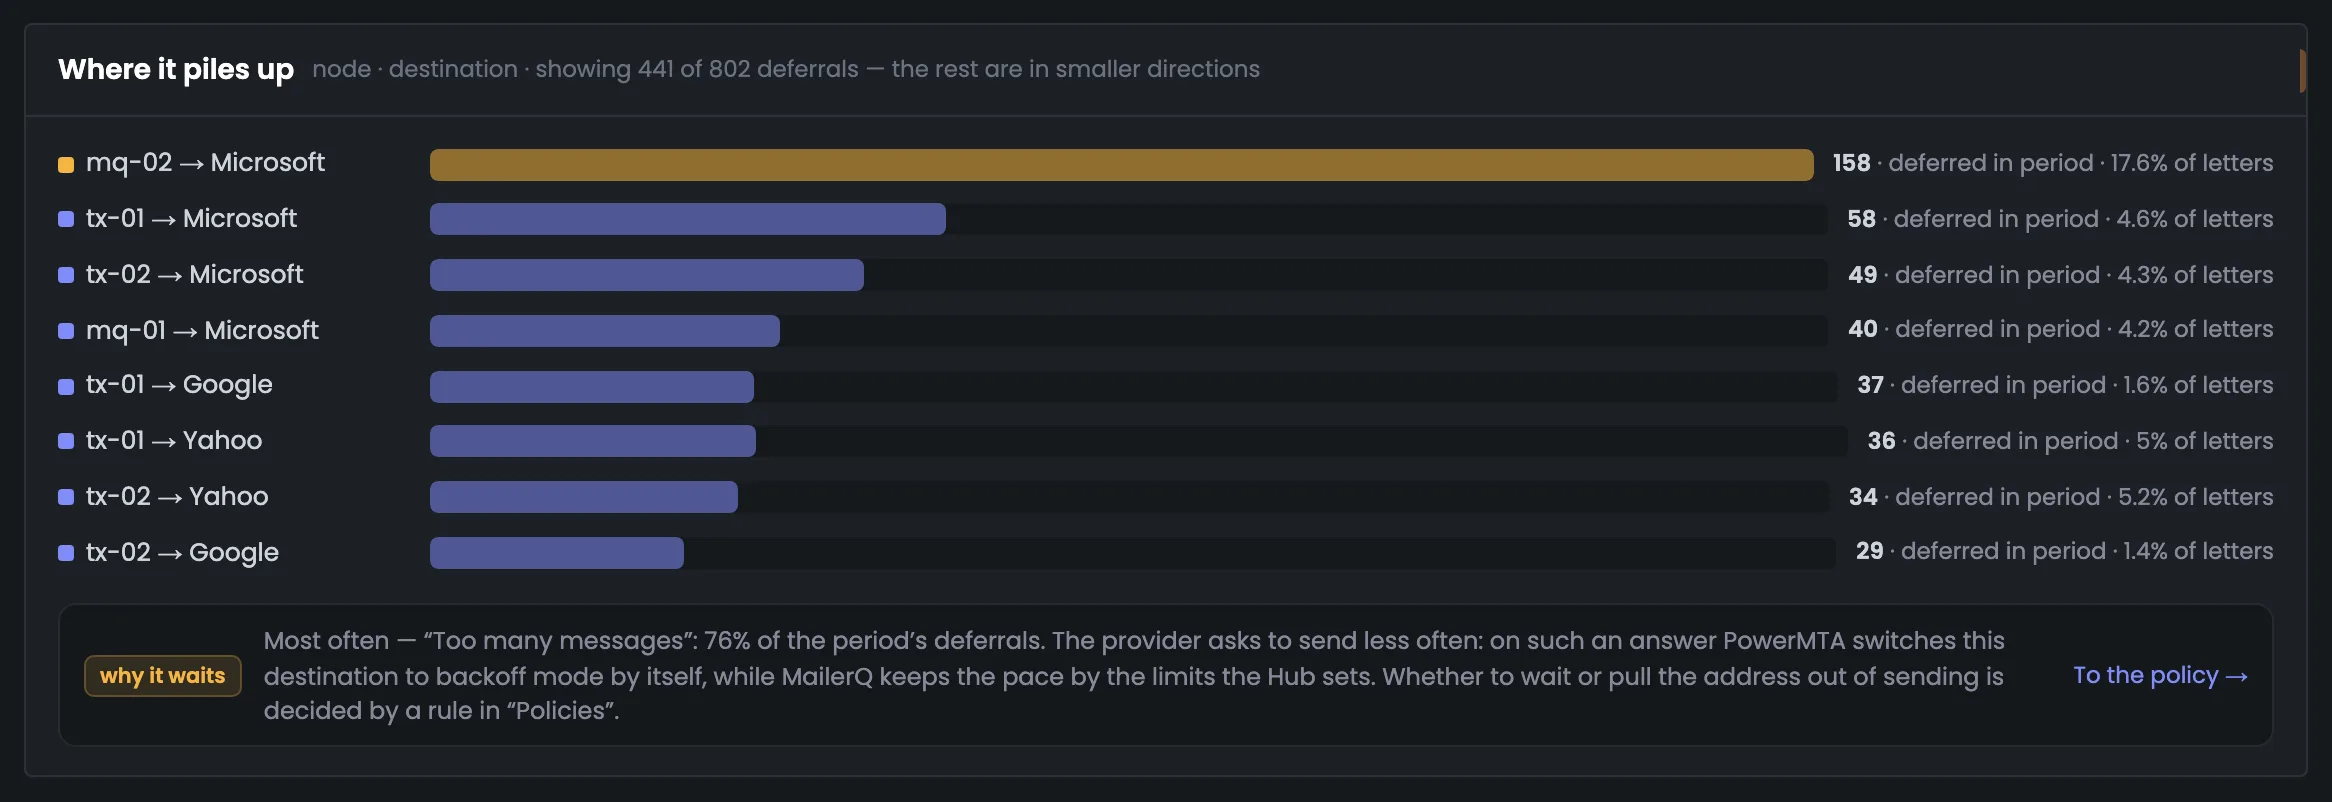
The “Where it piles up” bars show how many messages were deferred over the period for each “server — provider” pair. The bar's length is the number deferred, its color is their share of the pair's messages. The thresholds are the same ones the Hub uses to pause and roll back warm-up: yellow from 15%, red from 40%.
mq-02 → Microsoft
17.6%
158 deferred messages — that's 17.6% of the pair's messages, so the bar is yellow. The other pairs have 1.4–5.2%, with no warning color.
Nmq-02
Microsoft
Deferred158 · 17.6%
yellow from 15%red from 40%
Reason
“Too many messages”
The most common reason is “too many messages”, 76% of the period's deferrals: the provider asks you to send less often, and PowerMTA slows down sending on its own. Whether to wait or pull the address out of sending is decided by a rule in “Policies”.
HMTA-Hub
reason
Most commonToo many messages
76% of deferralsPowerMTA backoff
For MailerQ, the speed is held by limits the Hub sets. The caption says 441 of 802 deferrals are shown — the rest are spread over small destinations.
03 / SMTP response codes
SMTP response codes, with advice on what to do.
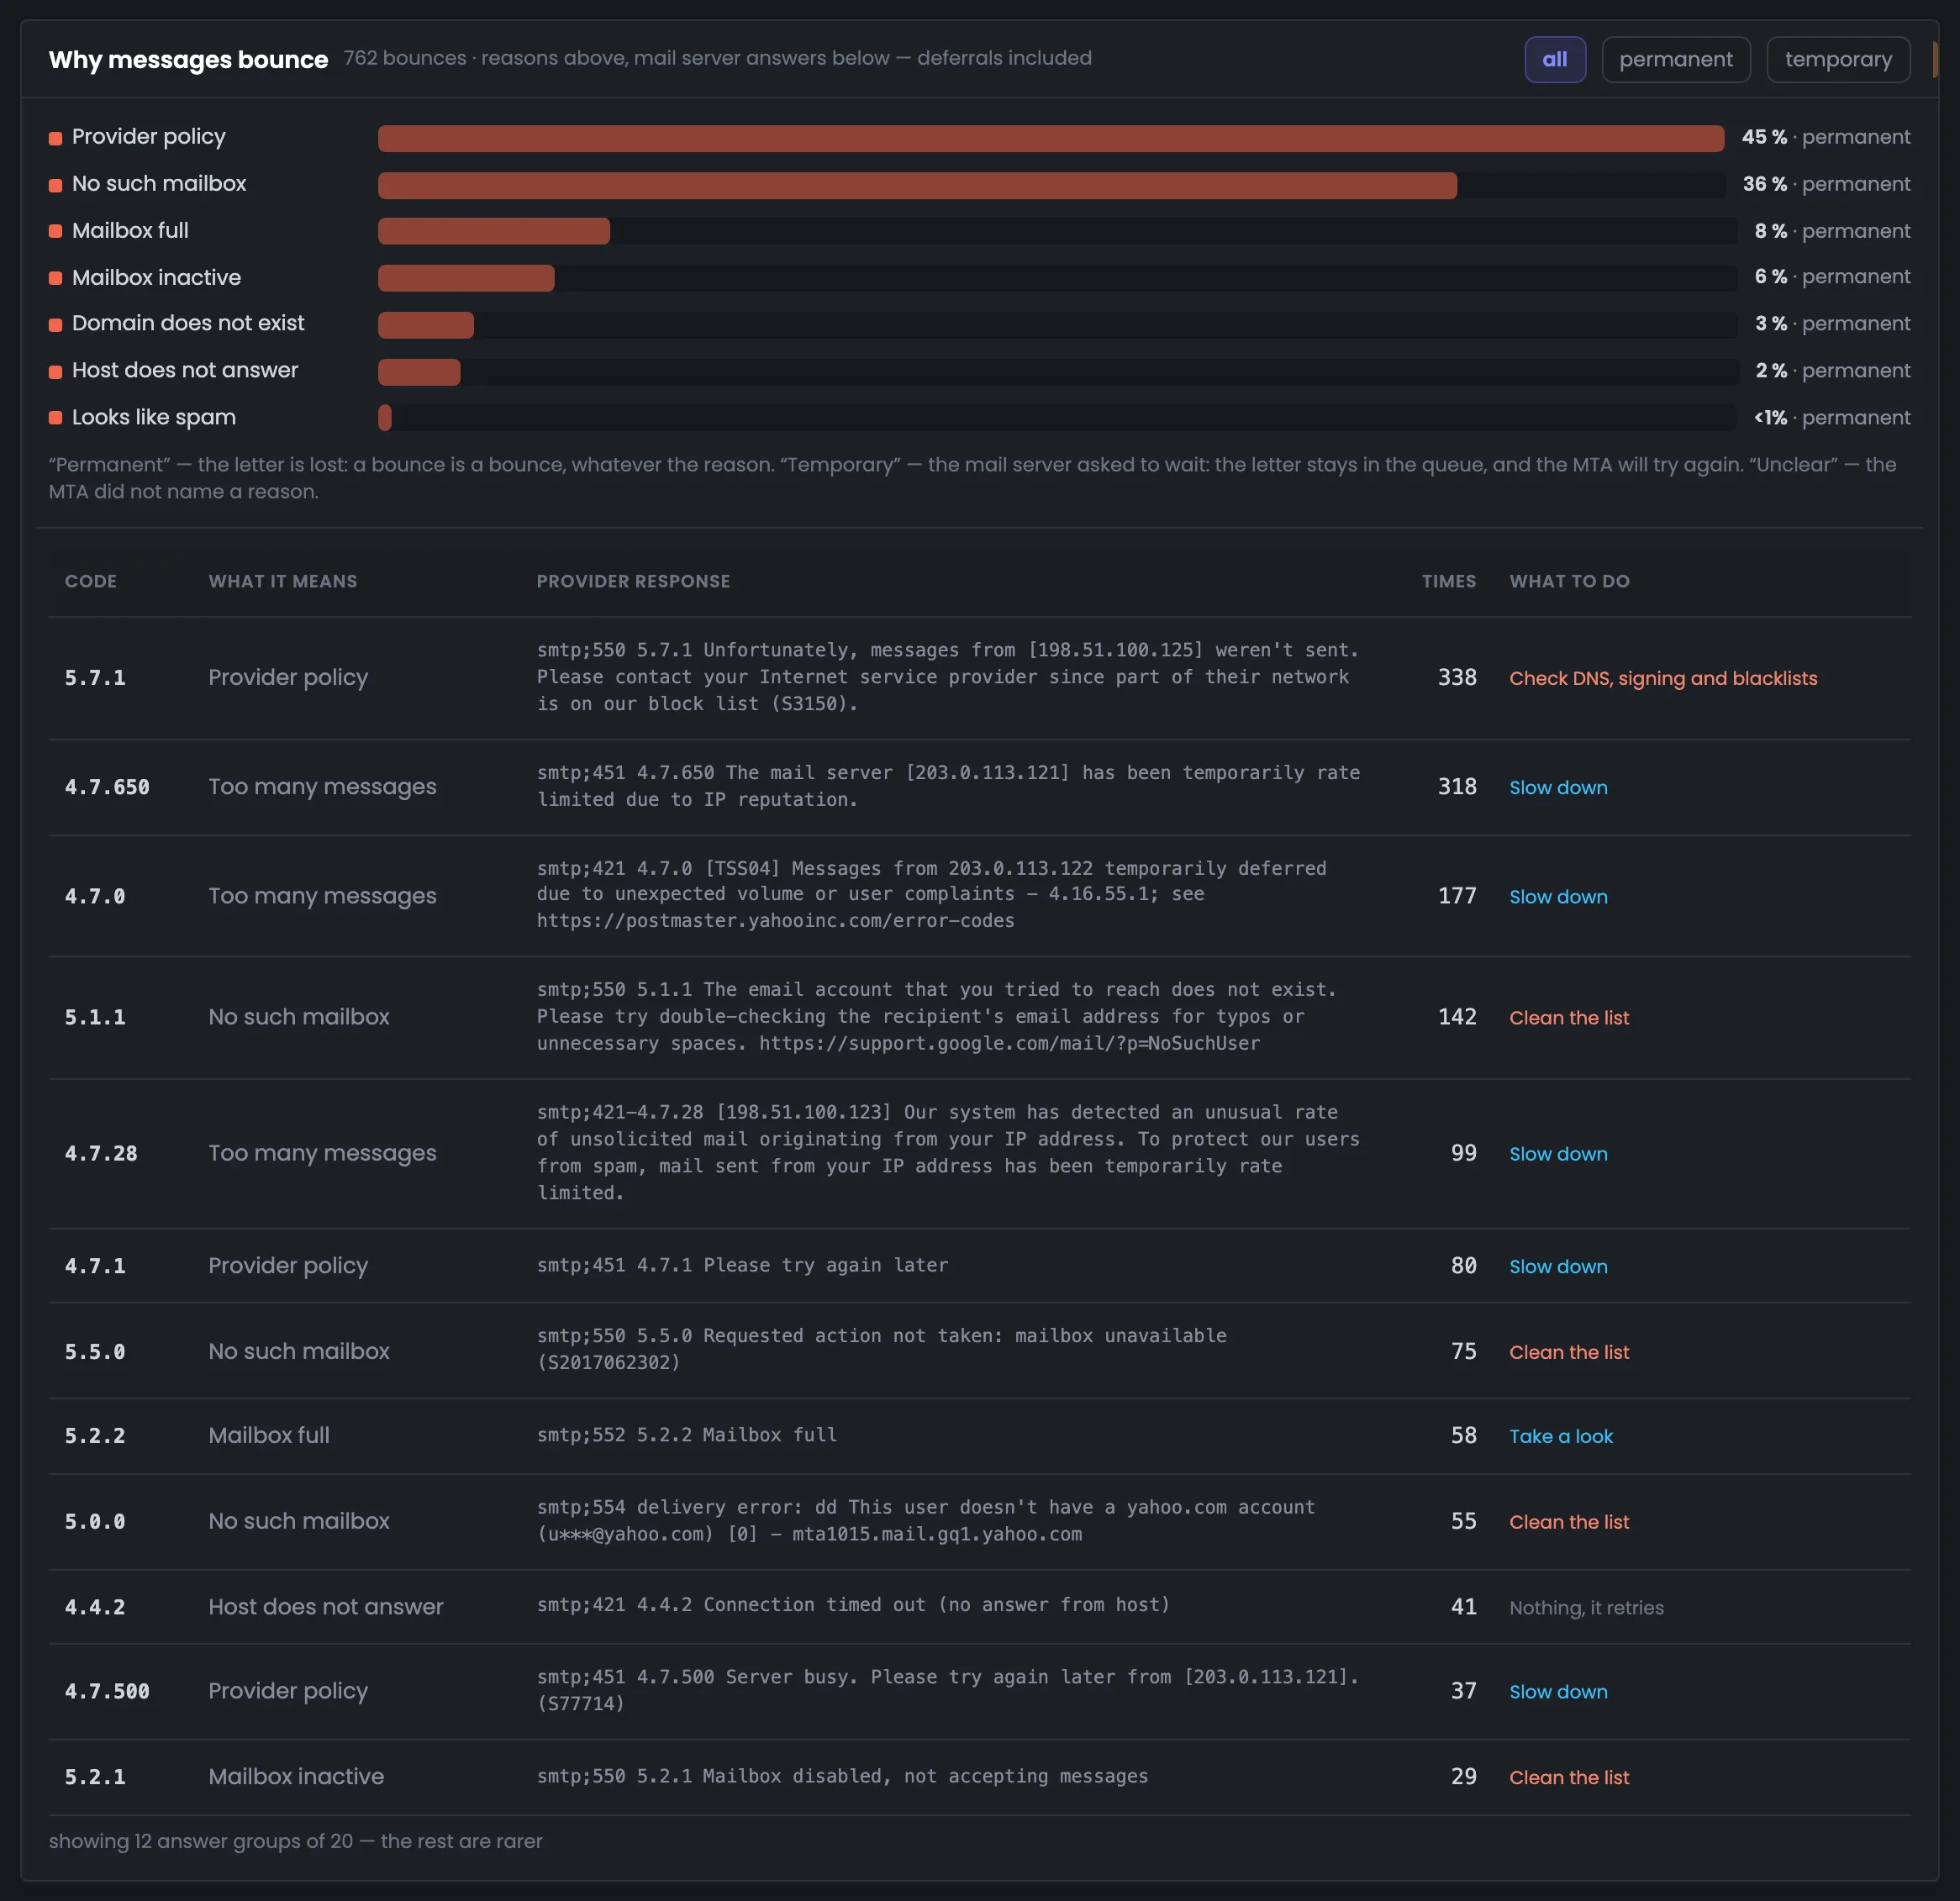
Bounce reasons are shown as bars, and below is a table of mailbox provider replies: the SMTP code (5.7.1, 4.7.0 and others), what it means, the server's actual reply and advice. Every bounce is “permanent”: the message is lost, whatever the reason. The advice tells you what to do about the address or the sending speed.
Provider requirements
5.7.1 · S3150
The address is on Microsoft's block list — 338 times. Advice: check DNS, signing and block lists.
Too many messages
4.7.650, 4.7.0, 4.7.28
Microsoft, Yahoo and Gmail ask you to send less often. Advice: slow down.
No such mailbox
36% of bounces
Advice: clean your list — retrying is pointless.
Server not responding
4.4.2
Advice: do nothing — the MTA will retry on its own.
762 bounces: provider requirements — 45%, no such mailbox — 36%, mailbox full — 8%, mailbox abandoned — 6%. 12 reply groups of 20 are shown; the rest are rarer.
04 / Failed message feed
The latest bounces and deferrals, message by message.
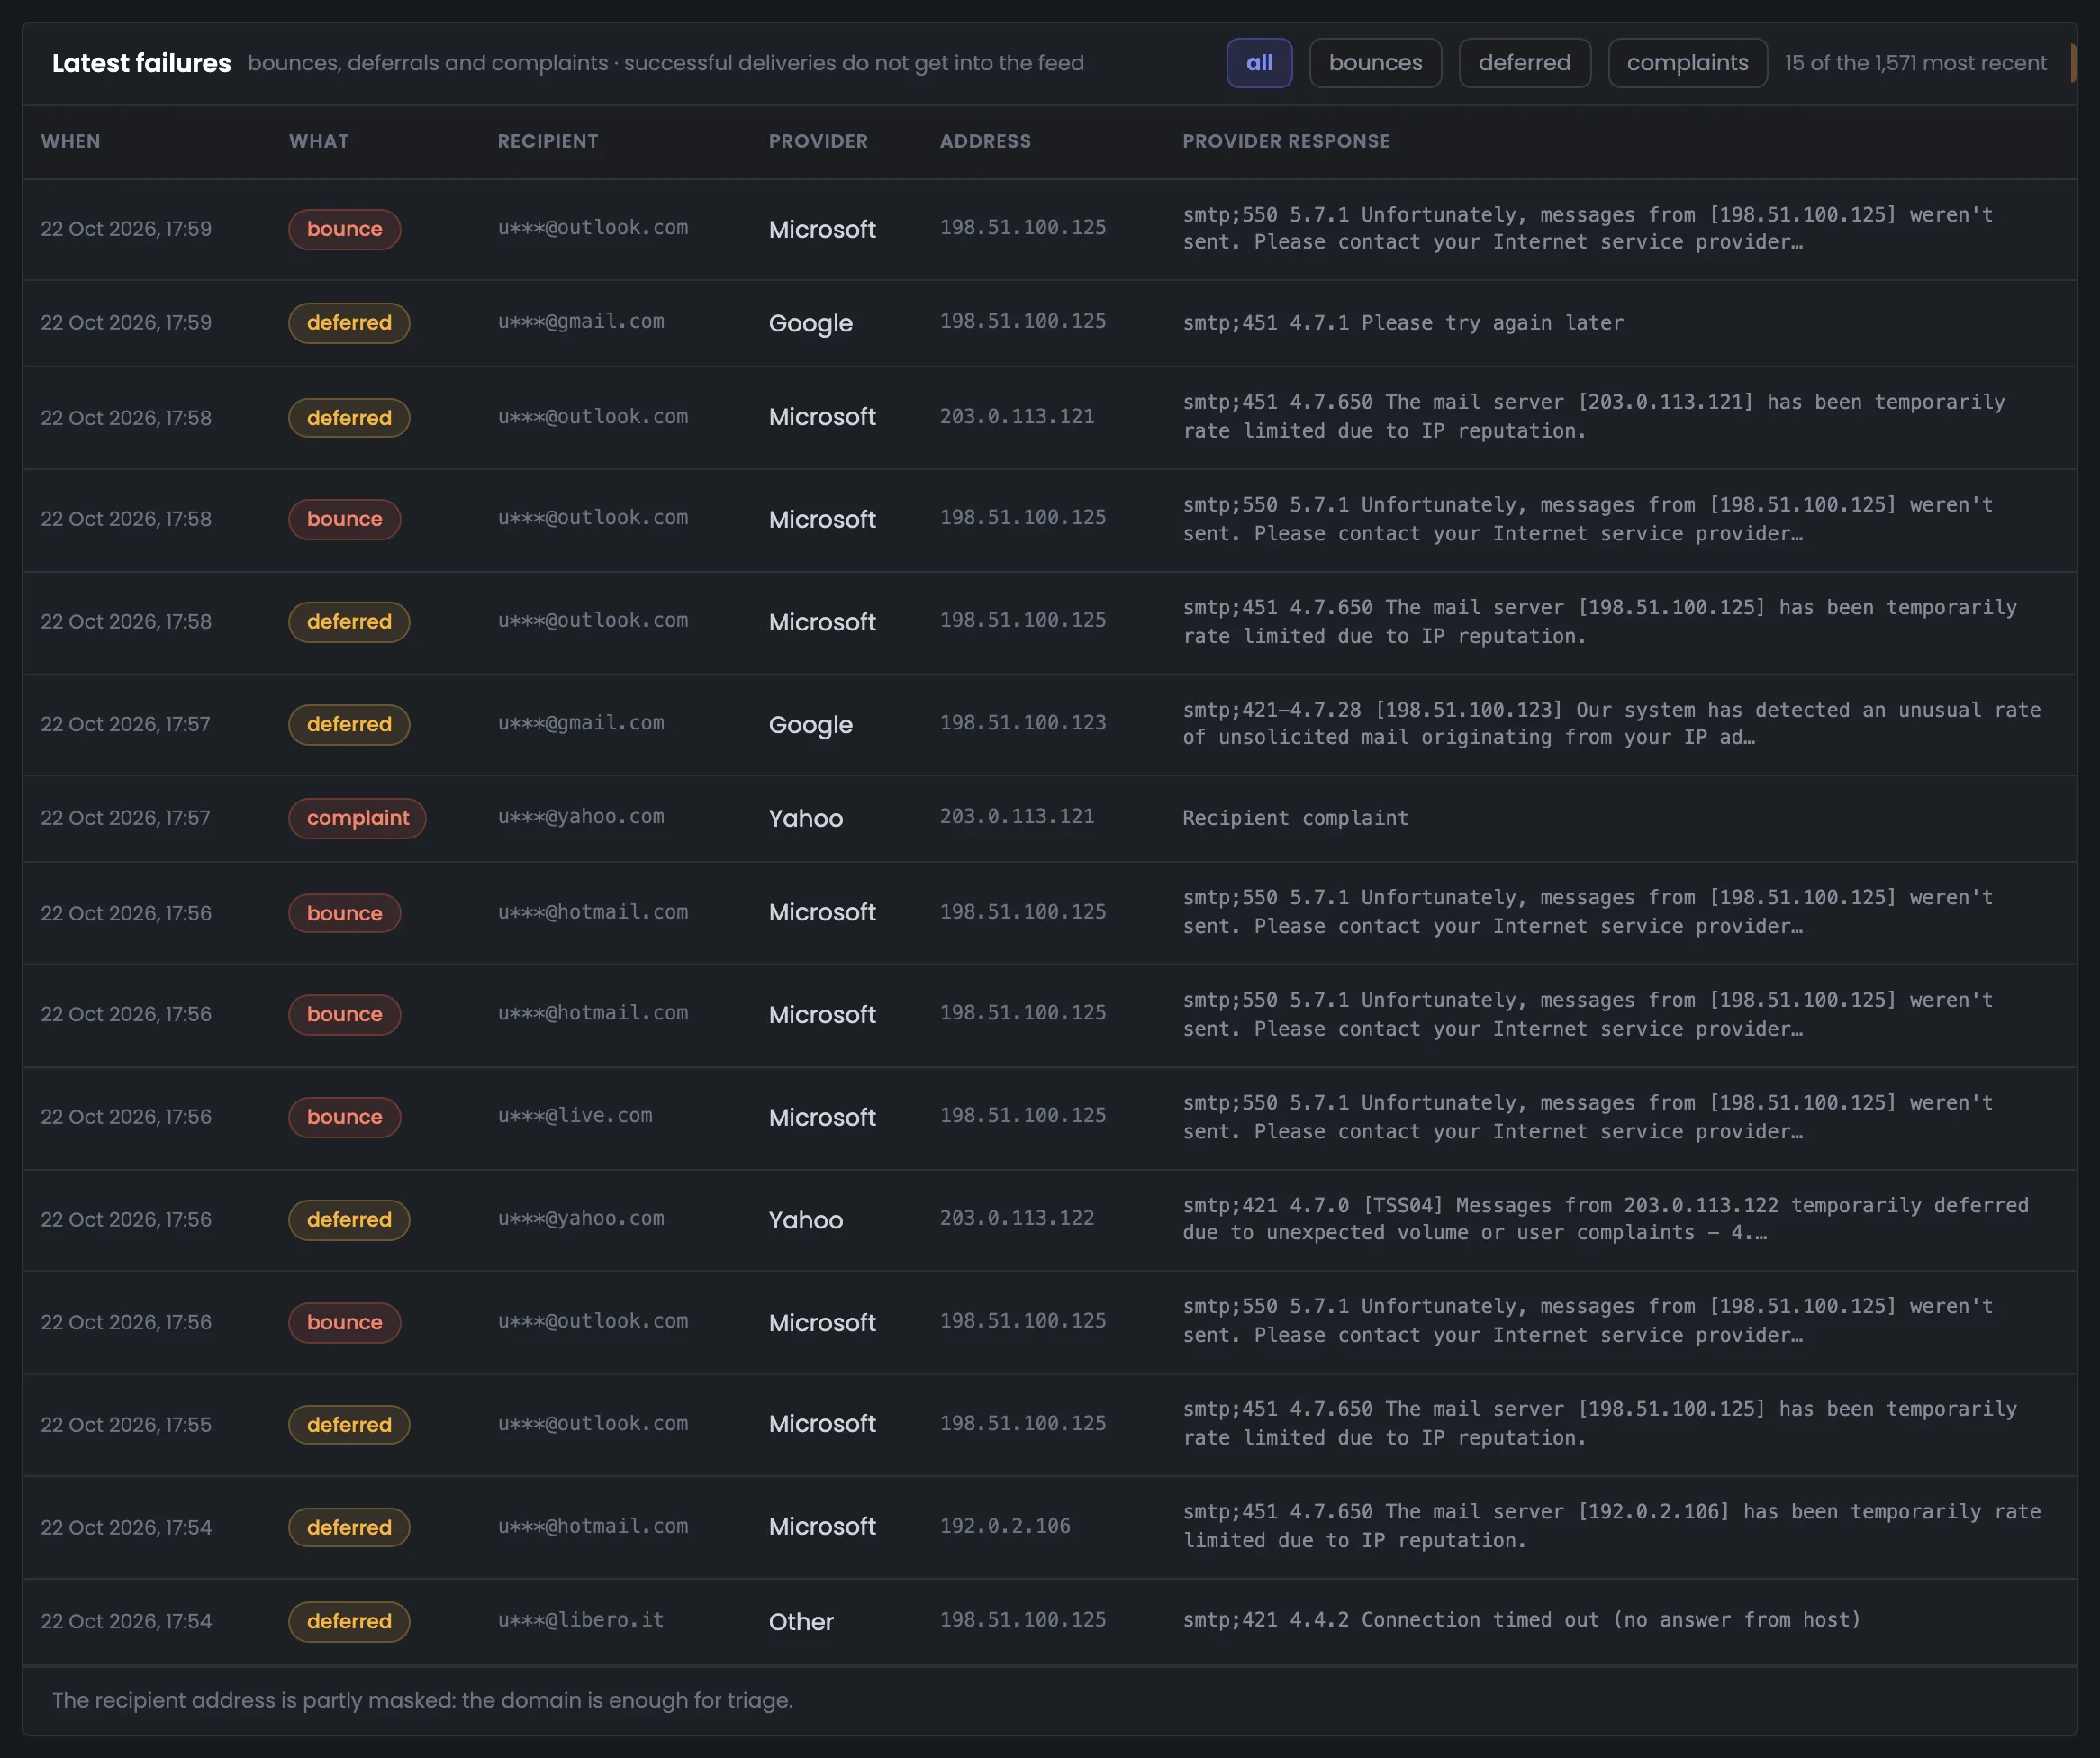
At the bottom are the latest messages that didn't get through: when, to whom, from which address, which mailbox provider and what it replied. The feed shows whether an error hits one sending address or several. Filters pick out bounces, deferrals or complaints across the whole period, not just among the visible rows.
One address or several
The feed shows it
Microsoft gives the S3150 bounce to one address — 198.51.100.125 — while “too many messages” (4.7.650) goes to different addresses. So the first is a problem with the address, the second with speed.
MMicrosoft
feed
S3150One address
198.51.100.1254.7.650 — several
Deferred only
Across the whole period
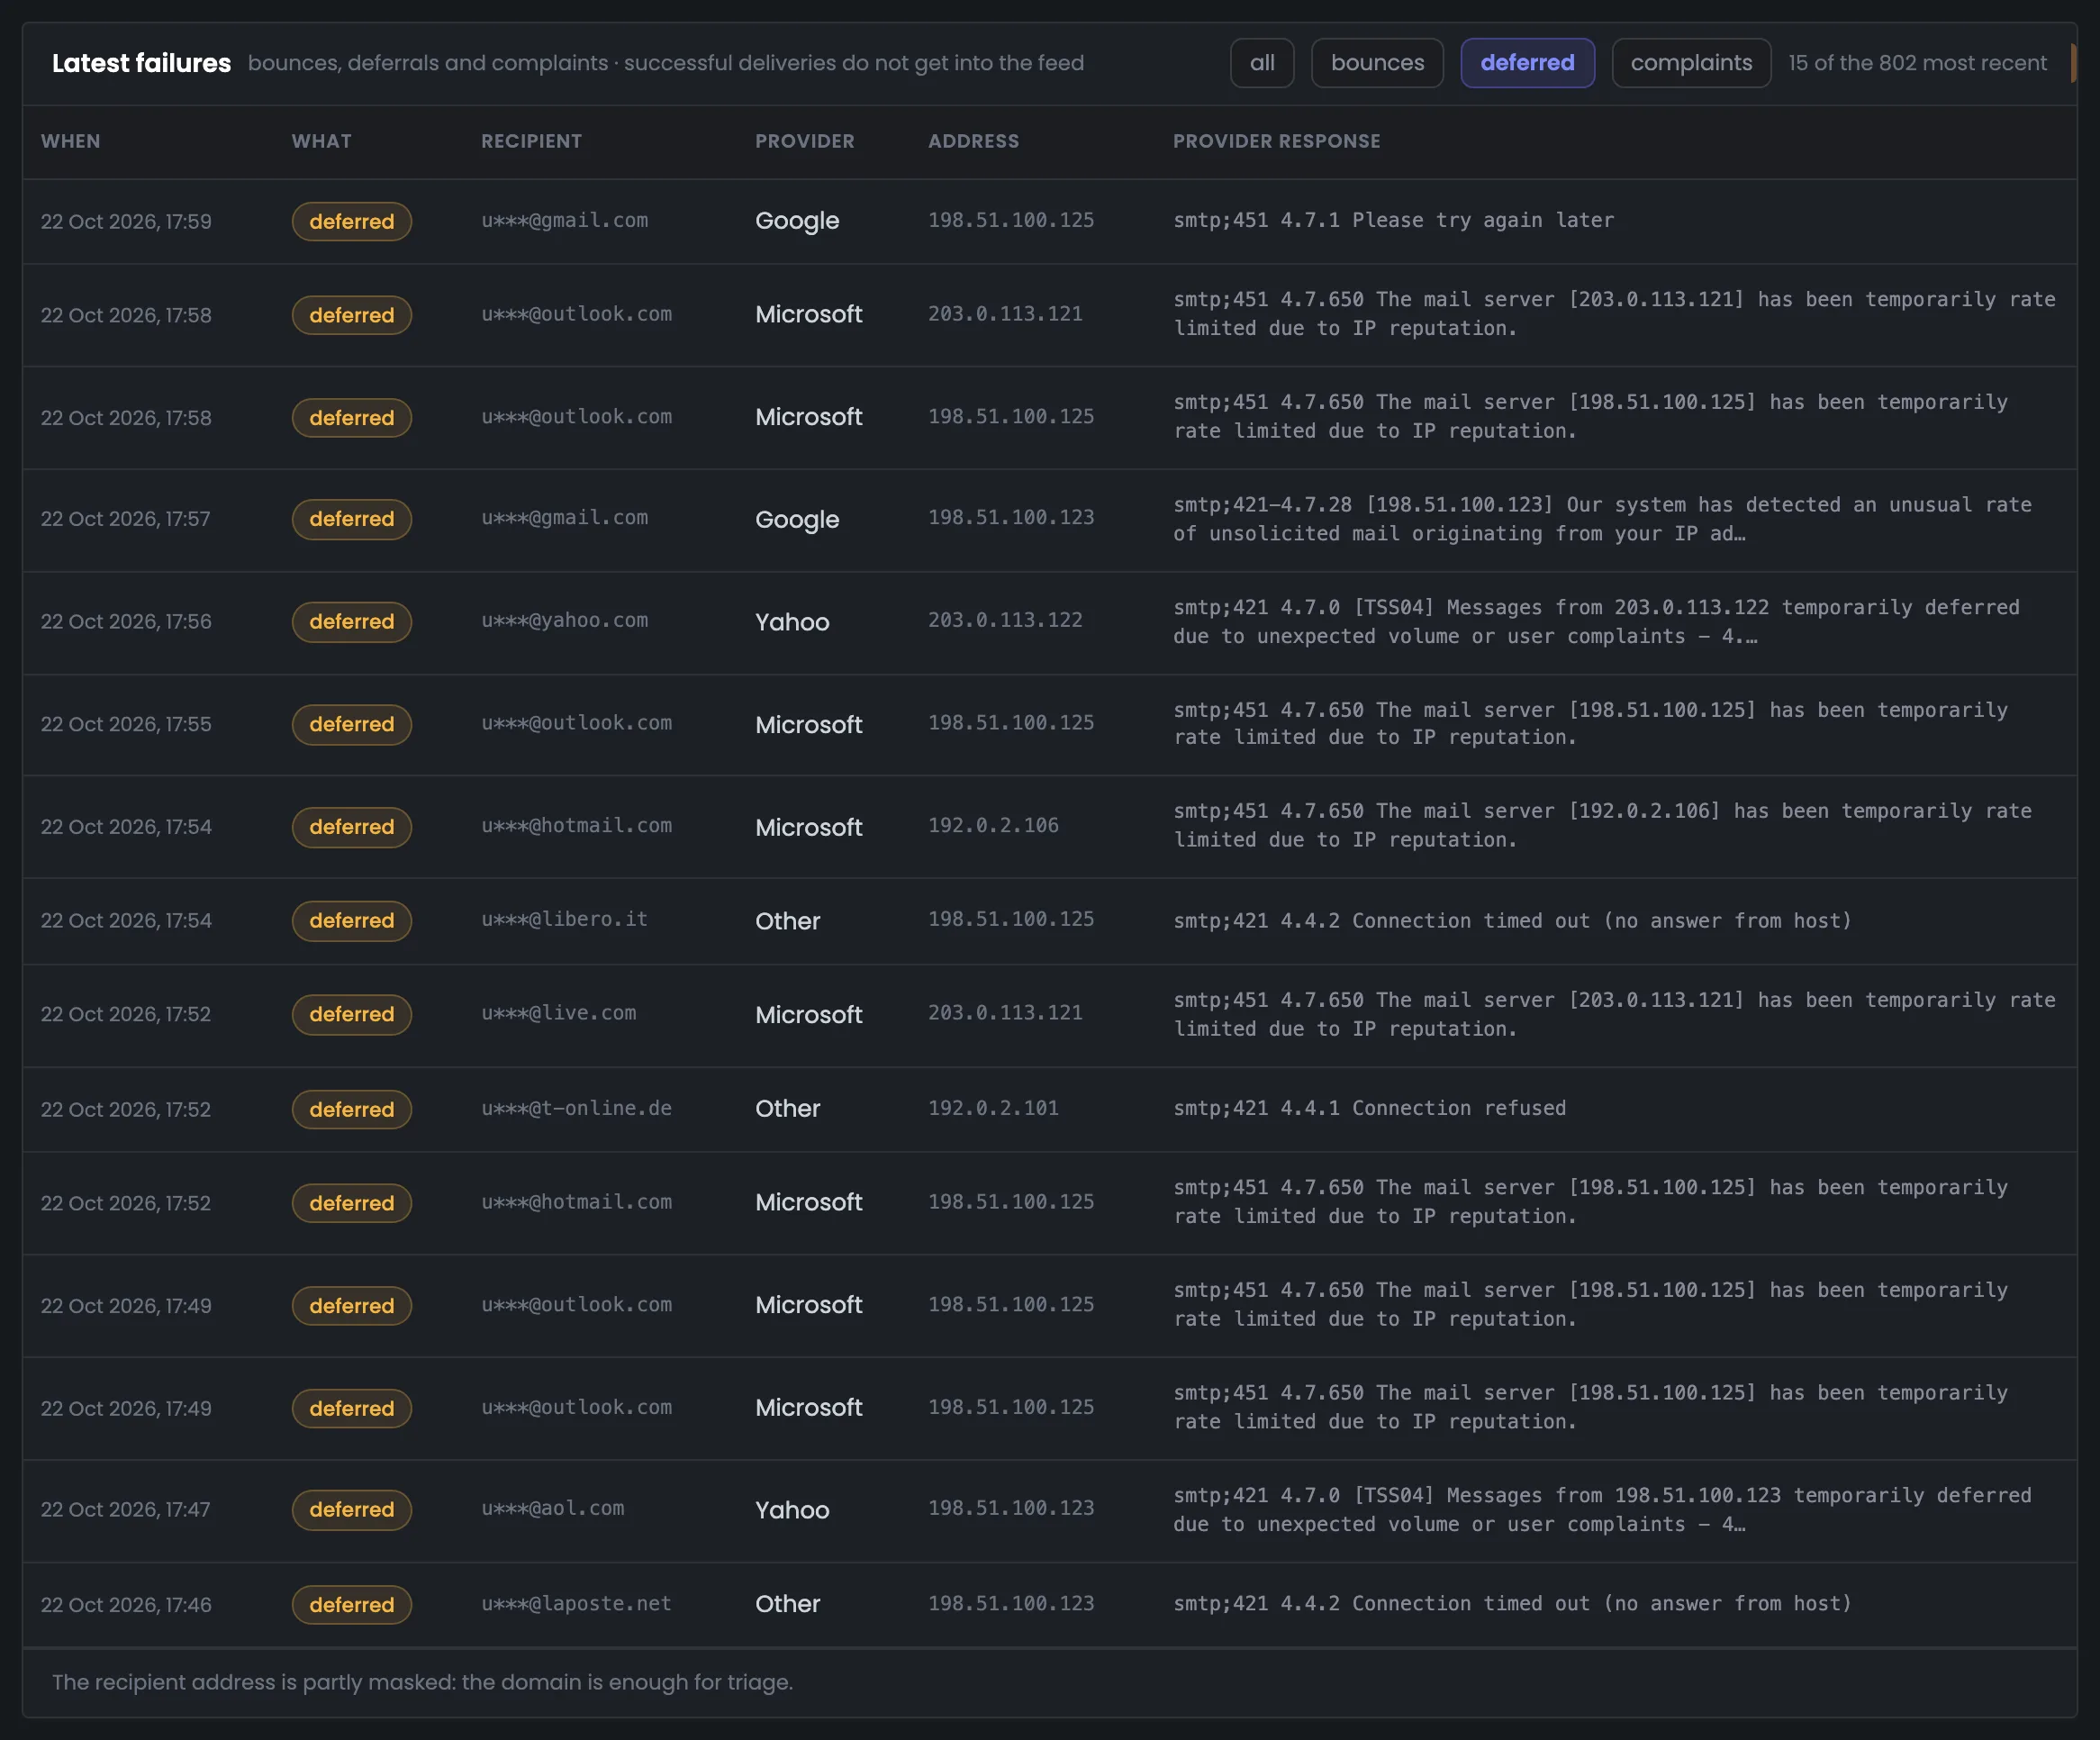
The “deferred” filter leaves 15 of the period's 802: 4.7.650 from Microsoft, TSS04 from Yahoo, 4.7.28 from Google. Complaints also show up in the feed, labeled “Recipient complaint”.
HMTA-Hub
filter
Deferred802 for the period
15 on screenwhole period
The recipient address is partly hidden: the domain is enough for troubleshooting.
05 / The interface in detail
The “Queues & errors” tab — 7 screens.
Period figures, the queue across the fleet and per server, where it piles up, reasons and provider replies, the failure feed and the deferred filter. Above each screenshot: why the screen matters. Below it: what it shows.
Queue
4 screens
The first four screens are about the mail queue. First the period figures, then the queue across the whole fleet, per server, and per “server — provider” pair. The last screen in the group names the most common deferral reason and links to “Policies”, where you decide what to do about it.
01
Period figures
Queue, peak, bounces, temporary
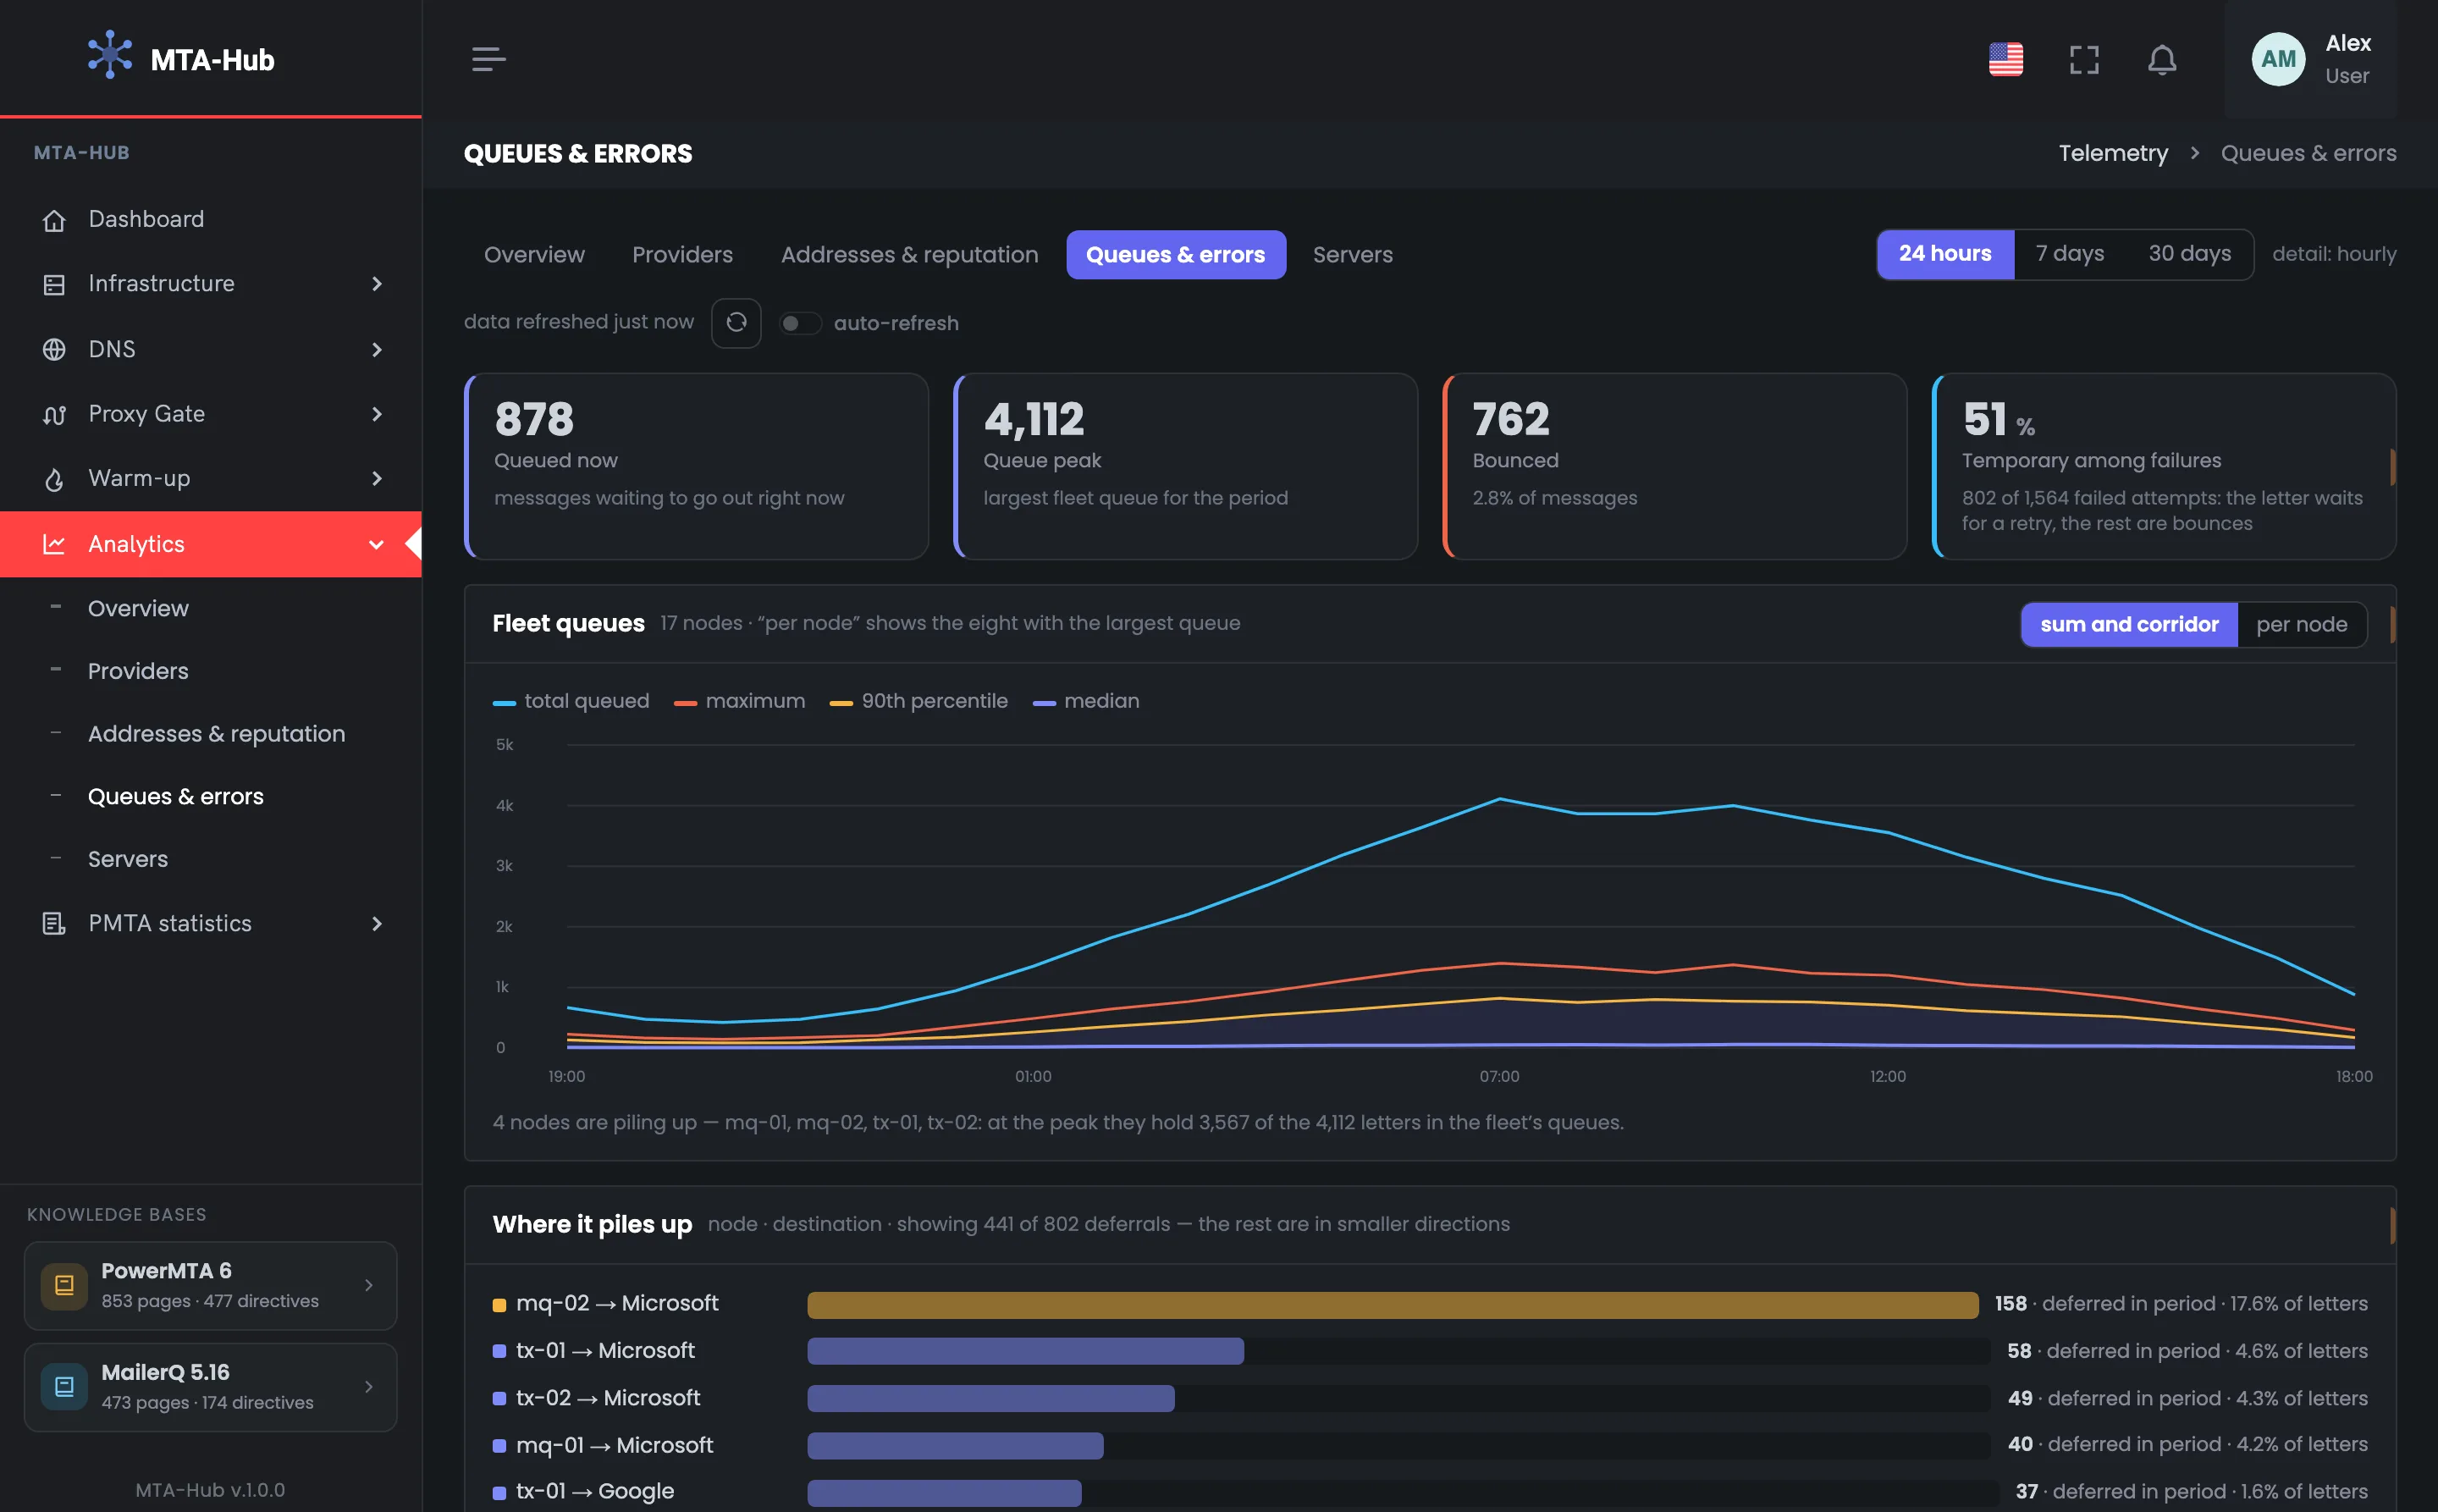
Four numbers at the top of the tab: how many messages are in the queues right now, what the queue peak was over the period, how many bounces there were and what share of failures is temporary. In the example there are 878 messages in the queues, the 24-hour peak is 4,112, and there are 762 bounces, or 2.8% of messages. Temporary failures are 51%: those messages aren't lost, they're waiting for a retry. Keep in mind that the queue is shown as of now, while the other numbers are for the period — so they sit side by side but mean different things. If the queue is noticeably higher than usual right now, go to the queue charts below; if bounces are growing, go to the screen with reasons and provider replies.
EnlargeScreen 01 · Period figures. An example from the MTA-Hub interface.
In queues now — 878 messages.
Total queue peak — 4,112 in 24 hours.
Bounces — 762 — 2.8% of messages.
Temporary among failures — 51% — 802 of 1,564 failed attempts.
The queue is as of now; everything else is for the period.
02
Fleet queues
Total queue and spread
The whole fleet's mail queue over 24 hours: the total line and the spread across servers — median, 90th percentile and maximum. The chart shows when the queue grows and whether that's normal for your sending. In the example the median stays at a few dozen messages, while the total queue climbs to 4,112 by seven in the morning. The line under the chart names where it's piling up: mq-01, mq-02, tx-01 and tx-02 hold 3,567 messages at the peak — start your investigation there. The other thirteen servers hold only 545 messages between them, so the problem isn't the whole fleet. The next screen breaks the same chart down by server.
EnlargeScreen 02 · Fleet queues. An example from the MTA-Hub interface.
Median — a few dozen messages.
Total queue — 4,112 by seven in the morning.
Where it piles up — mq-01, mq-02, tx-01, tx-02: 3,567 of 4,112 at the peak.
The other thirteen servers hold 545 between them.
03
Queues by node
Eight servers separately
The same queue chart, but as separate lines: the eight servers with the largest queue. You turn it on with the “by node” switch above the chart, and it shows exactly which server is holding messages. In the example both MailerQ servers reach about 1,400 messages in the queue, the transactional tx-01 and tx-02 reach 350–550, and the marketing servers stay near the very bottom. This makes it clear that a few servers drive the queue growth, not the whole fleet. The next question is which mailbox provider it's piling up at — the “Where it piles up” screen answers that. The Hub measures the queue on the servers itself, once a minute.
EnlargeScreen 03 · Queues by node. An example from the MTA-Hub interface.
MailerQ — mq-01 and mq-02 — up to about 1,400.
Transactional — tx-01 and tx-02 — 350–550.
Marketing — near the very bottom.
The “by node” switch above the chart.
04
Where it piles up
“Server — provider” pairs
Deferred messages over 24 hours by “server — provider” pair: which provider is asking which server to wait. In the example mq-02 → Microsoft stands out — 158 deferred, that's 17.6% of the pair's messages, and the bar is yellow; the other pairs have 1.4–5.2%. Under the bars is the most common reason — “too many messages”, 76% of deferrals: the provider asks you to send less often, and PowerMTA slows down sending on its own. The link goes to “Policies”, where a rule decides whether to wait or to pull the address out of sending. The caption honestly says that 441 of 802 deferrals are shown — the rest are spread over small destinations. For MailerQ, the speed is held by limits the Hub sets.
EnlargeScreen 04 · Where it piles up. An example from the MTA-Hub interface.
mq-02 → Microsoft — 158 — 17.6% of the pair's messages, yellow bar.
Other pairs — 1.4–5.2%.
Reason — “too many messages” — 76% of deferrals.
Link — to “Policies”.
441 of 802 deferrals are shown — the rest are spread over small destinations.
Bounces
1 screen
This screen answers why messages don't get through. At the top are bounce reasons as bars, below is a table of mailbox providers' replies, word for word, with SMTP codes. Each reply group comes with advice: check DNS and block lists, slow down, or just wait for the retry.
05
Why messages don't get through
Reasons and replies with advice
The main bounce screen: reasons as bars, and a table of provider replies together with deferrals. In the example there are 762 bounces: 45% are due to provider requirements and 36% are mailboxes that don't exist. In the table, each SMTP code comes with the server's actual reply and advice: for 5.7.1 with S3150, check DNS, signing and block lists; for 4.7.650, slow down; for 4.4.2, do nothing — there will be a retry. Start with the top rows: they cause the most failures. Under the table it says that 12 reply groups of 20 are shown — the rest are rarer. “Temporary” in the table means a deferral: the message stayed in the queue, and the MTA will try again.
EnlargeScreen 05 · Why messages don't get through. An example from the MTA-Hub interface.
Reasons — provider requirements 45%, no such mailbox 36%, mailbox full 8%, abandoned 6%.
5.7.1 — 338 — “…block list (S3150)”, advice: DNS, signing and block lists.
4.7.0 and 4.7.28 — Yahoo and Gmail ask you to send less often.
4.4.2 — server not responding — there will be a retry.
12 reply groups of 20 are shown.
Failure feed
2 screens
At the bottom is a feed of the actual messages that didn't get through: time, recipient, mailbox provider, sending address and the server's reply. It shows whether an error affects one address or all your sending. Filters pick out bounces, deferrals or complaints across the whole period.
06
Latest failures
Message feed
A feed of the latest failed messages — fifteen of 1,571 in 24 hours. Each row has the time, bounce or deferral, the recipient with the name hidden, the mailbox provider, the sending address and the server's reply. The feed shows what the totals can't: in the example, Microsoft's S3150 bounce hits one address — 198.51.100.125 — while “too many messages” (4.7.650) hits different addresses. So the first is a problem with the address's reputation, the second with sending speed. Complaints show up in the feed too: they have no server reply, and the row is labeled “Recipient complaint”. If bounces hit one address, the next step is the “Addresses & reputation” tab.
EnlargeScreen 06 · Latest failures. An example from the MTA-Hub interface.
Each row — time, bounce or deferral, recipient with the name hidden, provider, address and reply.
S3150 — one address — 198.51.100.125.
4.7.650 — different addresses.
Complaints — no server reply — “Recipient complaint”.
The feed shows whether the problem is the address or the speed.
07
Deferred only
Filter across the period
The “deferred” filter leaves only deferred messages in the feed — in the example, 15 on screen of the period's 802. This helps when you need to see which mailbox providers are asking you to wait, and with which codes: here 4.7.650 from Microsoft to different addresses, TSS04 from Yahoo and 4.7.28 from Google. The filter works across the whole period, not just the fifteen rows of the general list. Bounces and complaints are picked out the same way if you need to look at those. The filtered feed shows that deferrals come from three major providers at once, not just one. Reasons and advice for each code are on the bounce screen above.
EnlargeScreen 07 · Deferred only. An example from the MTA-Hub interface.
Microsoft — 4.7.650 to different addresses.
Yahoo — TSS04.
Google — 4.7.28.
The filter works across the whole period, not just the fifteen visible rows.
06 / Questions about queues
Frequently asked questions about deferred messages and bounces.
In short: how a bounce differs from a deferral, and what to do about each provider reply.