The MTA isn't responding
Or the disk is 90% full or more.

Monitoring PowerMTA and MailerQ servers
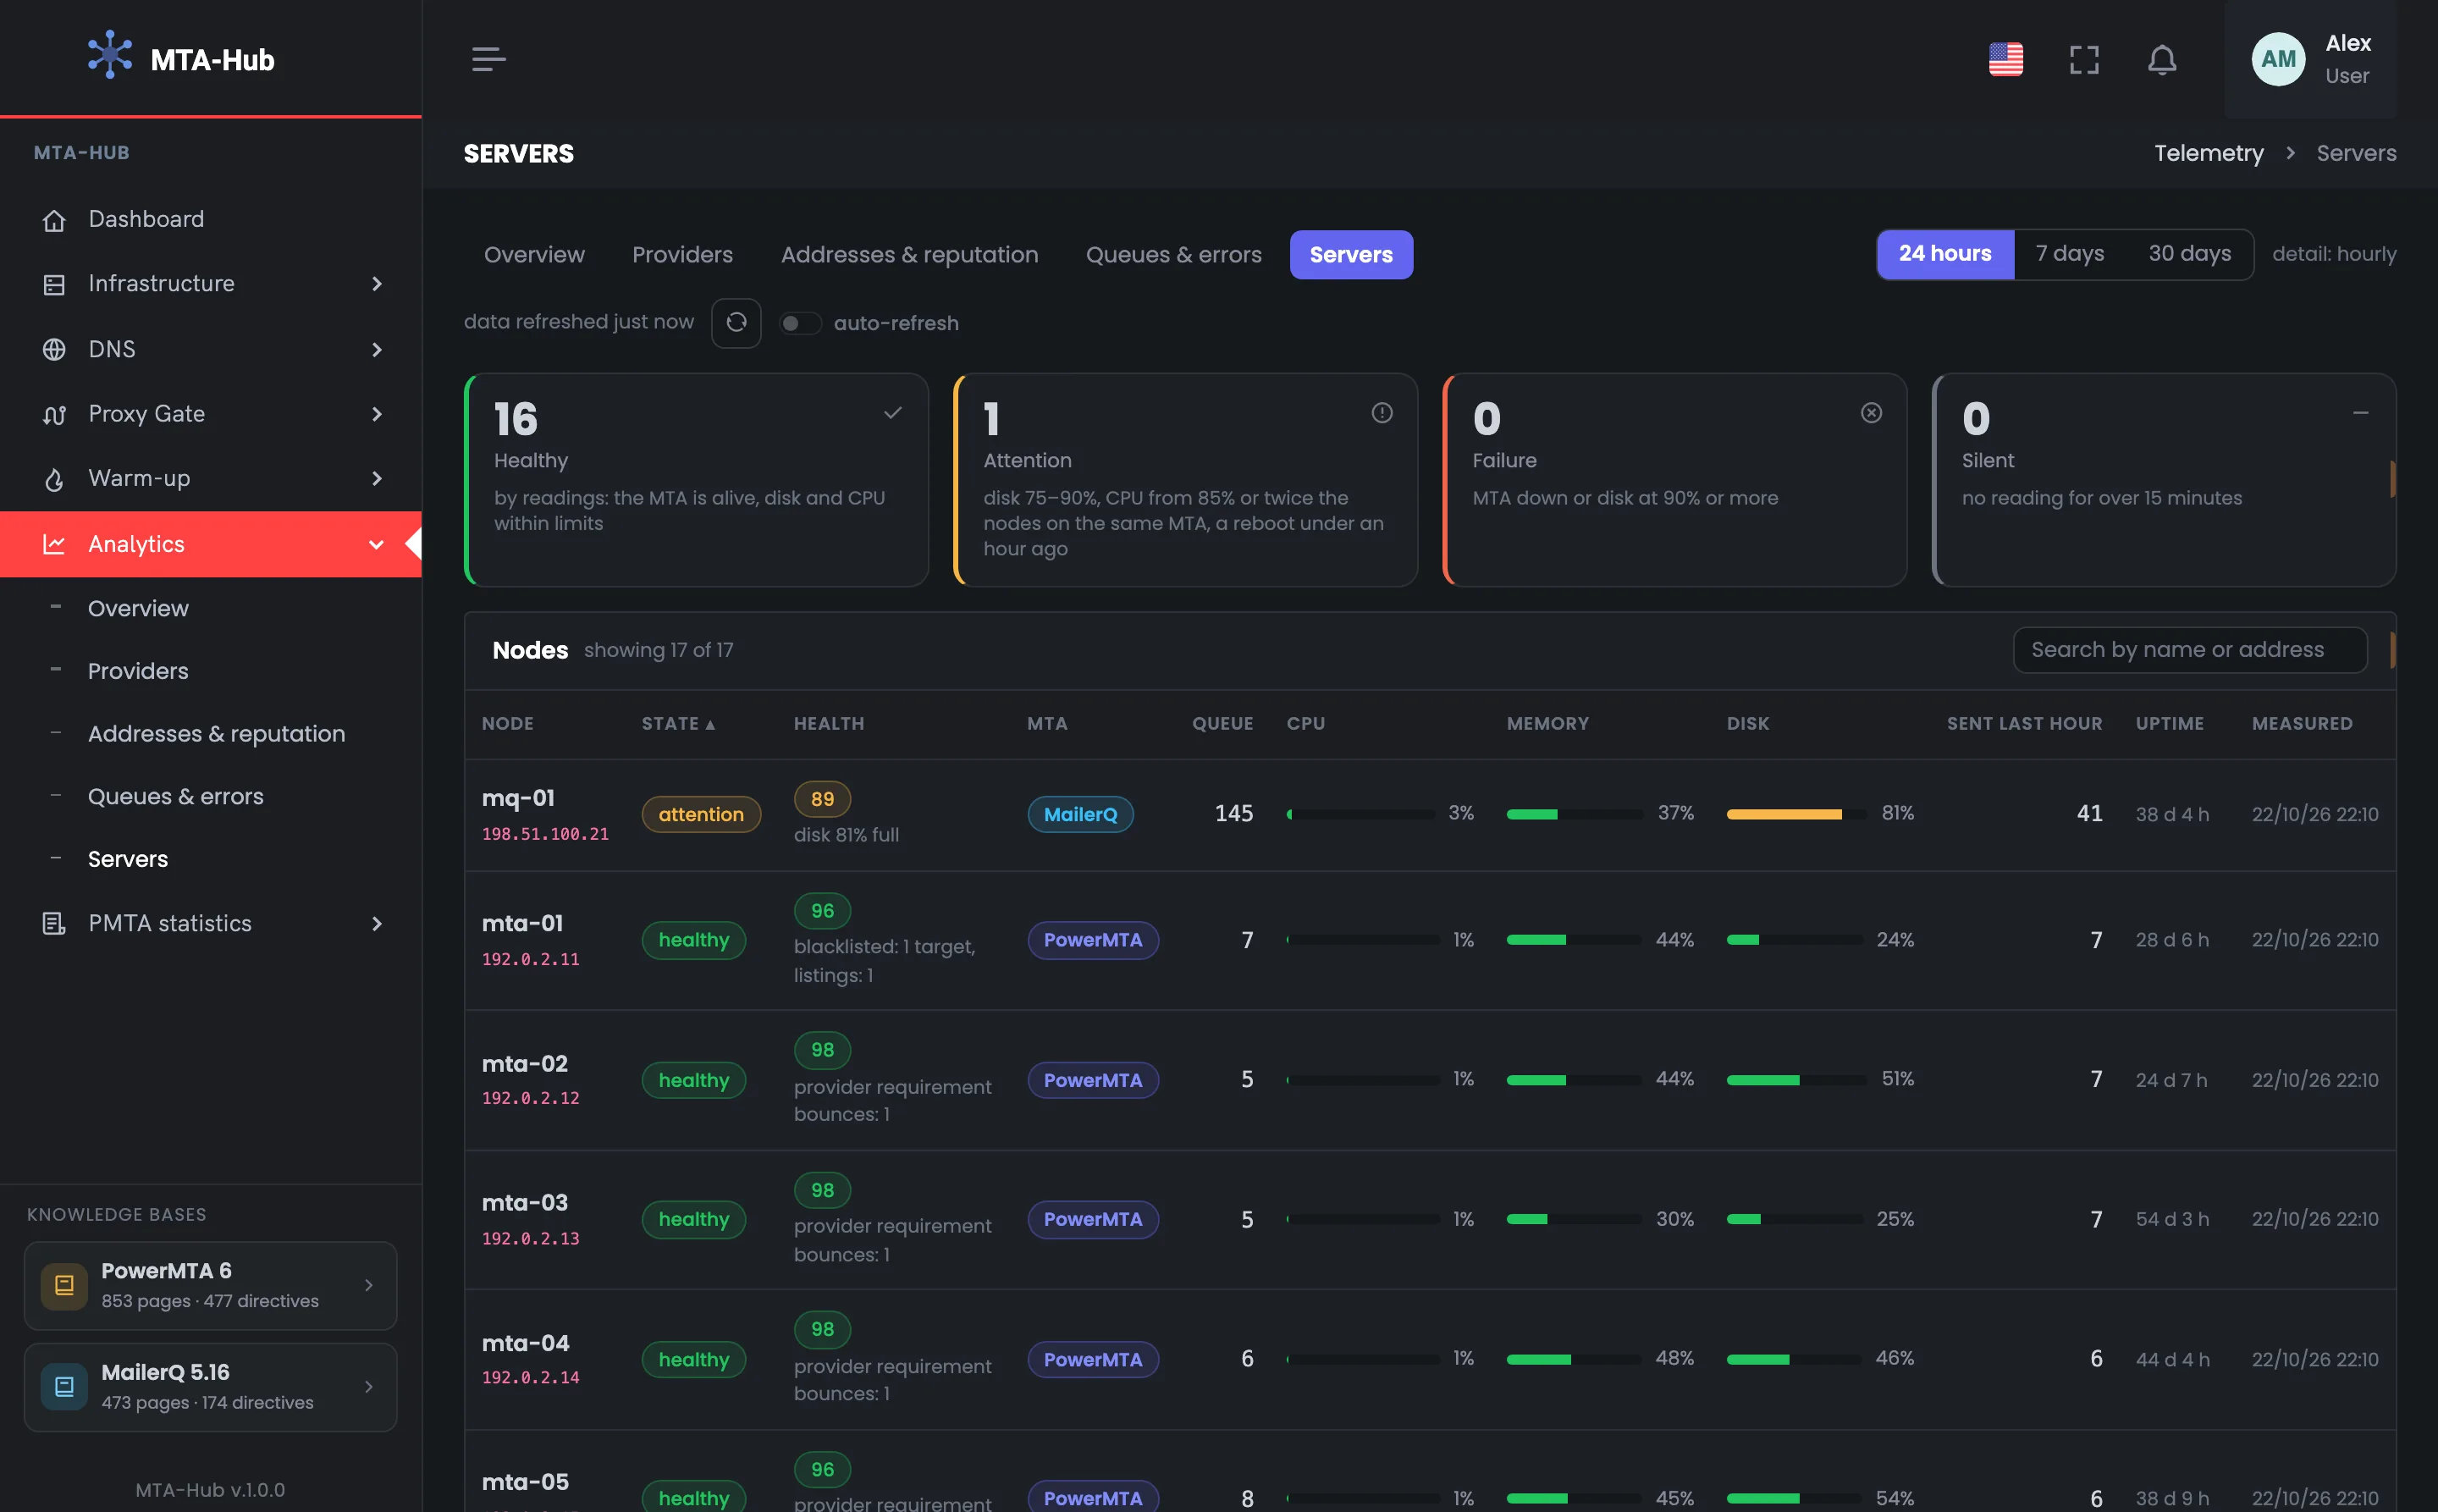
All your servers in one table: status, health score, MTA, queue, CPU, memory, disk, messages sent in the last hour, uptime and the time of the last measurement.
At the top — how many servers are healthy, need attention, have failed or have gone silent; at the bottom — which ones stand out from the rest, and why.
01 / Server status
Each sending server's status is set by clear thresholds for MTA health, disk, CPU and how fresh the measurement is — not by an impression from the charts. The tiles at the top show how many servers are healthy, need attention, have failed or have gone silent, and they work as a filter for the table.
The bars in the table are colored by the same thresholds: only the disk can turn red
Or the disk is 90% full or more.
Or CPU at 85% or more, twice as high as other servers on the same MTA, or a reboot less than an hour ago.
Its numbers are out of date — and it goes to the top of the list.
02 / Server load
MailerQ, together with its message broker, puts a heavier load on a server than PowerMTA does. So the Hub looks for excess CPU load among servers with the same MTA: PowerMTA servers are compared with each other, and MailerQ servers with each other. Otherwise both MailerQ servers would be flagged as overloaded every day.
The MailerQ database and broker server: the disk is 81% full, the bar is yellow, the score is 89. Worth checking what's growing: the logs or the queue.
MailerQ servers hold 145–152 messages in the queue and send 41–43 an hour; the transactional tx-01 and tx-02 hold 39–66 in the queue and send 54–62 an hour; the marketing servers, single digits.
03 / Who stands out from the fleet
“Who stands out” covers more than disk and CPU: it also includes a server's dropped score, addresses without a reverse DNS record, and MTA reports — a server can be running while its sending suffers. What breaks sending comes first. One problem — one row.
Worth checking what's growing: the logs or the queue.
Spam and complaints are the weakest part: one spam bounce in 24 hours.
Mailbox provider requirements are the weakest part: 217 bounces — Microsoft rejects the address.
One address without a reverse DNS record each.
The mq-01 score, dropped because of the same disk, doesn't get a second row: one problem — one row.
04 / New and silent servers
A server that hasn't sent anything yet doesn't get flagged with “reports not arriving”: by the MTA's own counter there were no messages, so there's nothing to check. A server that has gone silent, on the other hand, goes first as a red row — its numbers are out of date. This way monitoring doesn't mistake a new server for a broken one.
The rows are gray: there were no reports from the MTA, but by the MTA's own counter they haven't sent any messages either. Report delivery will be checked once they send their first messages.
A “not enough data” score comes with an explanation of why — for example, “nothing was sent”. The “Measured” column shows how fresh the numbers in the row are.
The table shows working servers only. Servers being prepared or retired are shown in “Infrastructure”, and the table caption gives their number.
05 / The interface in detail
Fleet status, the server table, the “Attention” filter and who stands out from the fleet. Above each screenshot: why the screen matters. Below it: what it shows.
The tab opens with the fleet status: four tiles show how many servers are healthy, need attention, have failed or have gone silent. Below is a table of all servers with the measurement time, queue, CPU, memory, disk and score. The tiles work as a filter, so a problem server is easy to find even in a large fleet.
Four fleet status tiles: how many sending servers are healthy, need attention, have failed or have gone silent. This is the first look at server monitoring — is everything fine with the hardware and the MTA. In the example, sixteen servers of seventeen are healthy and one needs attention — mq-01, with its disk 81% full; there are no failures and no silent servers. Clicking a tile leaves only the servers in that status in the table below. The Hub takes measurements from the servers itself, once a minute. Read the tiles by urgency: failure — the MTA isn't responding or the disk is 90% full or more; attention — disk at 75–90% or CPU at 85% or more; silent — no measurement for more than 15 minutes.
 Enlarge
The tiles work as a filter for the table below.
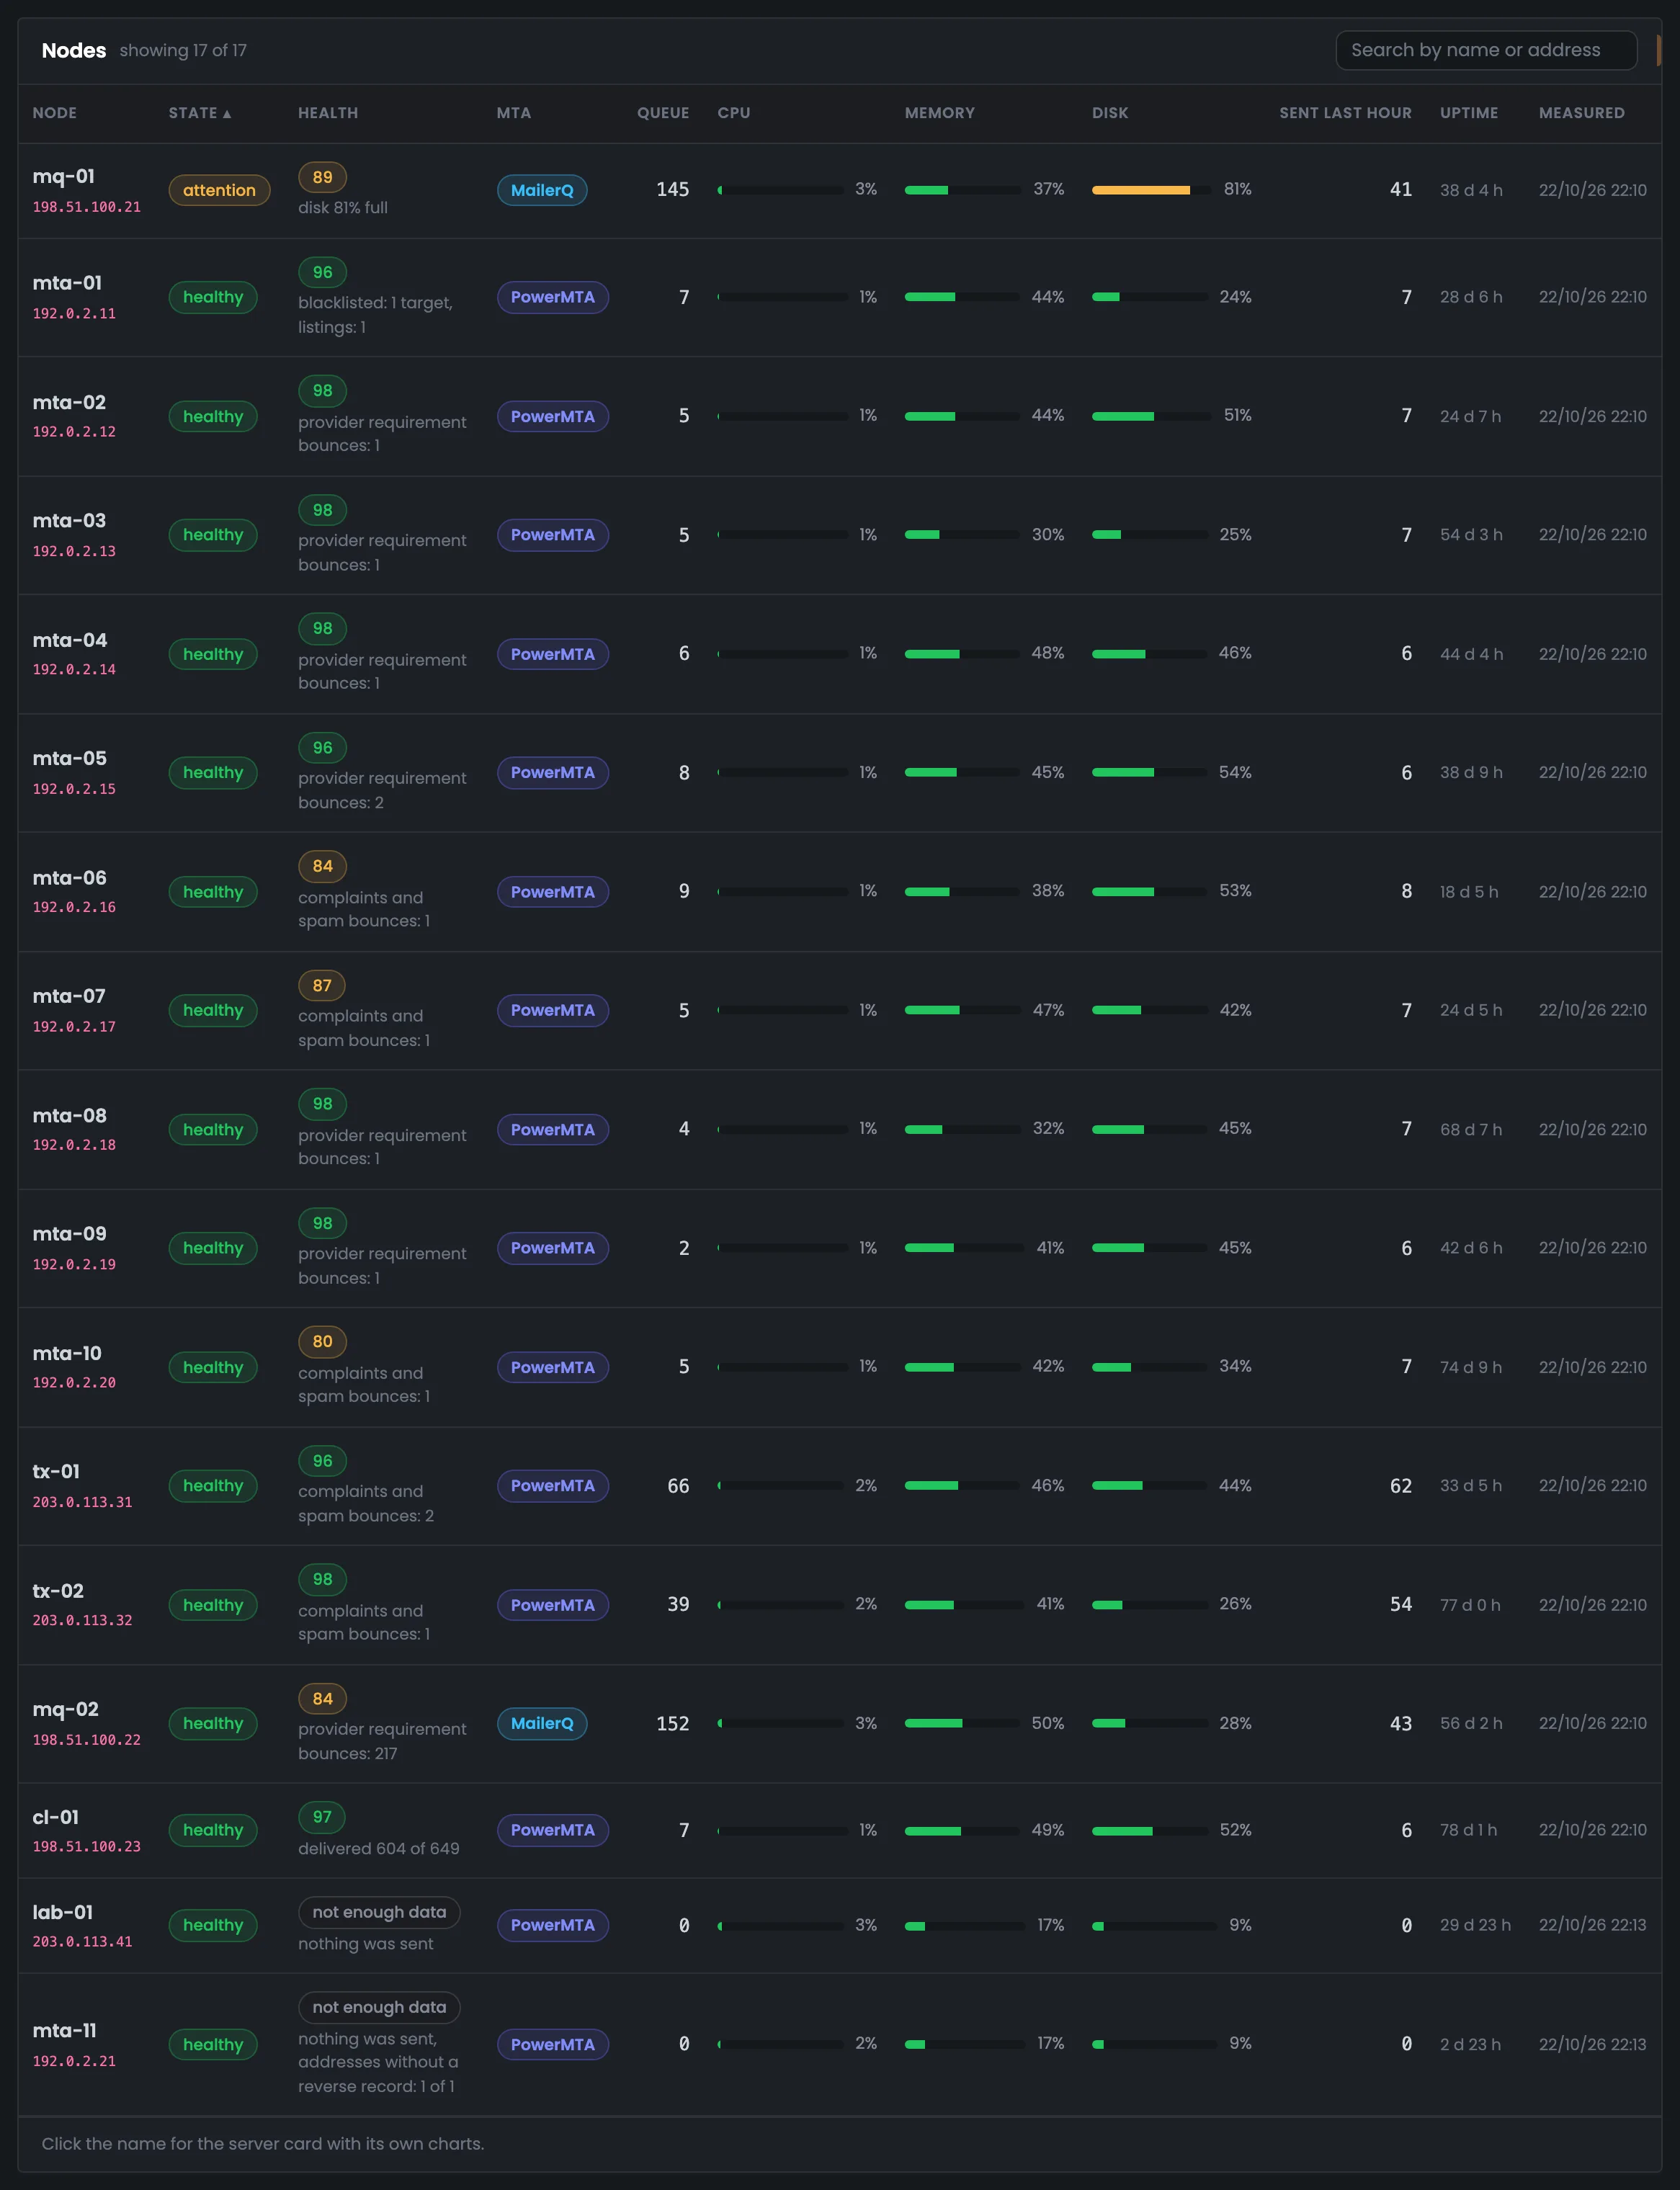
The tab's main table: all 17 sending servers, one row each — status, score, MTA, queue, CPU, memory, disk, messages sent in the last hour and the time of measurement. Use it to compare servers with each other and spot which ones are different. In the example, mq-01 is in “attention” because of its disk at 81%, mq-02, mta-06, mta-07 and mta-10 have a lower score, and lab-01 and mta-11 haven't sent anything yet. The “Measured” column shows how fresh the numbers in the row are. mq-02 scores 84 because of 217 bounces for mailbox provider requirements: that's the address Microsoft rejects, so the hardware isn't the issue. Only the disk can turn red in the bars.
 Enlarge
The bars are colored by the status thresholds: only the disk can turn red.
The table after clicking the “Attention” tile: one server is left — mq-01, and the caption says “showing 1 of 17”. This filter helps when you have many servers but only need to look at the problem ones. The row shows right away what's wrong: the disk is 81% full. The “attention ×” button above the table clears the filter and brings back the whole fleet. The “Failure” and “Silent” tiles work the same way: failed and silent servers are always shown first. The table shows working servers only; those being prepared or retired are shown in “Infrastructure”, and the table caption gives their number. Load is still compared with servers on the same MTA.
 Enlarge
This way one problem server doesn't get lost among sixteen healthy ones.
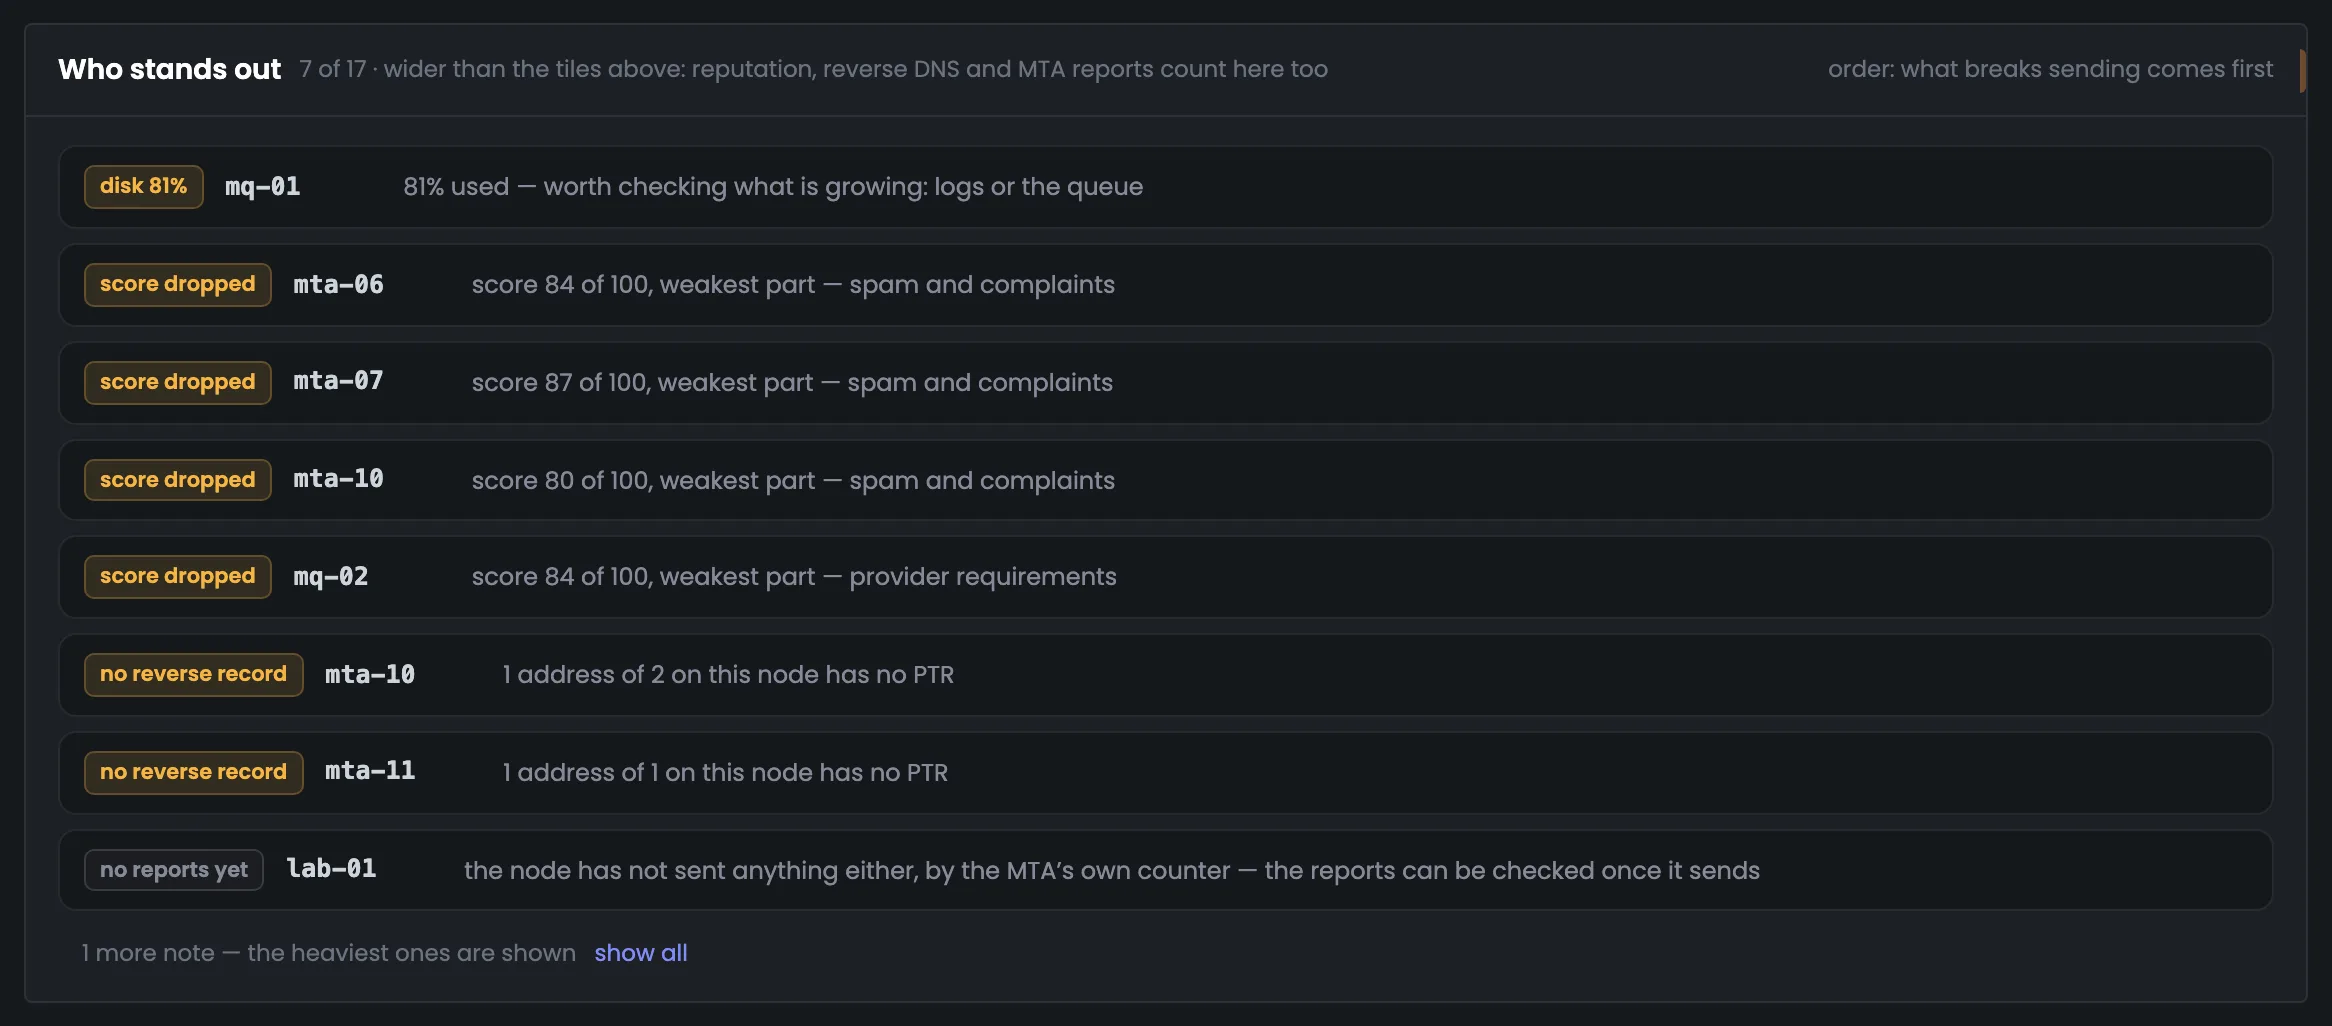
At the bottom are the servers that stand out from the fleet, each with its reason. What breaks sending comes first, and gray rows show what hasn't been checked yet. This block tells you which server to start with. One problem — one row, no repeats.
The “Who stands out from the fleet” block lists servers that differ from the rest, each with its reason. In the example there are seven of 17: mq-01's disk is 81% full and it's worth checking what's growing — the logs or the queue; mta-06, mta-07, mta-10 and mq-02 have a dropped score; mta-10 and mta-11 have addresses without a reverse DNS record. Gray at the bottom are lab-01 and mta-11, which haven't sent any reports yet because they haven't sent any messages either. Work through the rows from top to bottom. The mq-01 score, dropped because of the same disk, doesn't get a second row: one problem — one row. A single server in full — MTA status, queues and controls — is examined in monitoring.
 Enlarge
One problem — one row.
06 / Questions about servers
In short: how a server's status is determined, and why it's compared only with servers on the same MTA.
When the MTA isn't responding or the disk is 90% full or more.
Disk at 75–90%, CPU at 85% or more or twice as high as other servers on the same MTA, or a reboot less than an hour ago.
When there has been no measurement for more than 15 minutes. Such a server goes first, as a red row.
MailerQ with its broker puts a heavier load on a server than PowerMTA. Otherwise both MailerQ servers would always be flagged as overloaded.
A server can be running while its sending suffers: a dropped score, addresses without PTR, MTA reports.
By the MTA's own counter there were no messages — so there's nothing to check report collection against.
The Hub takes them from the servers itself, once a minute.
Working ones only: active, paused, unreachable and being rebuilt.
07 / Next step
Analytics shows the whole fleet. A single server in full — MTA status, queues and controls — is in monitoring.
All servers with their addresses and place in the diagram are on the Nodes page.