All your servers in one list: whether each one is working right now, what runs on it, its addresses and domains with their reverse DNS records, and its slot in the diagram.
Once a minute the Hub checks every server — load, memory, disk and the MTA queue — and anything that needs fixing rises to the top by itself.
The state of your sending servers — from a check every minute.
A node is a sending server the Hub manages: it runs an MTA (PowerMTA or MailerQ), it has IP addresses and domains bound to it, and it takes a slot in the diagram. The “active” status is set at installation and never changes by itself, so here the state is worked out from the latest check, which the Hub runs once a minute.
Your servers
01 · Servers17 · MTA on 17
02 · Online17 of 17
03 · Addresses28 · PTR on 27
04 · Need attention2
Once a minute the Hub takes a reading from every server — that is how you see whether it is alive
Checked every minute
Load, disk, MTA
On every server the Hub checks the CPU, memory, disk, MTA queue and whether the service is running. In the screenshot the last check was a minute ago.
HMTA-Hub
check
Online17 of 17
checked 4 min agoload and queue
A silent server
After 15 minutes
If there is no data for 15 minutes, the server is “silent”. Its resource bars fade out, so old percentages are not passed off as current ones. A stopped MTA service shows up at once.
NNode
no data
StateSilent
15 minutes without a checkbars fade out
02 / To-do list
Server problems — in a to-do list at the top.
The feed under the header gathers problems from all your sending servers: IP addresses without PTR, a full disk, a silent server, a stopped MTA service. It is a to-do list, not an event log: a line appears when there is something to do and disappears as soon as the problem is fixed.
Reverse DNS
mta-11
The second store’s new server was rented three days ago, and the hosting provider has not set up its reverse DNS record yet. Mailbox providers limit sending from addresses without PTR, so this has to be fixed before the mailing.
Nmta-11
PTR
Reverse DNS0 of 1
1 address of 28DNS and keys
Disk
mq-01
The disk of the first server in the MailerQ cluster is 81% full — it holds the database and the message broker. If the disk fills up, the MTA will stop accepting mail.
Nmq-01
disk
Disk used81%
line from 75%red from 90%
The feed also picks up a silent server, a stopped MTA service, a server without an MTA and an unsupported operating system.
03 / Node row
Everything about a sending server in one row.
One row is one server, and every column holds real data: what runs on it, where it sits in the diagram, how many IP addresses and reverse DNS (PTR) records it has, how loaded it is and when it was last checked. You don’t need to open the server’s card to judge its state.
Node
Name, role, address
Host, infrastructure, system and country; the dot on the left shows the state.
MTA and slot
Service and diagram
PowerMTA 6.0r3 · service running · “C-01 · sending”.
Addresses
With reverse DNS
Green — every address has a record, yellow — not all of them.
Resources and contact
From the latest check
CPU, memory, disk, queue, days without a reboot and time of the check.
A resource bar turns yellow from 85% for CPU, 90% for memory and 75% for disk, and red from 95, 97 and 90%. The disk threshold is stricter because a full disk stops the MTA.
04 / Connecting a server
Connect a server with its address and root password.
To connect a server, all you need is its address and the root password. The Hub checks access, creates its own key and uses it to log in from then on — the password is never used again.
Connect a node
01 · AccessAddress and root password
02 · CheckThe Hub logs in to the server
03 · Hub keyNo more password
04 · MTA installationThe next step
Server role — sending, sending and tracking, tracking or own proxy
New node
mta-12
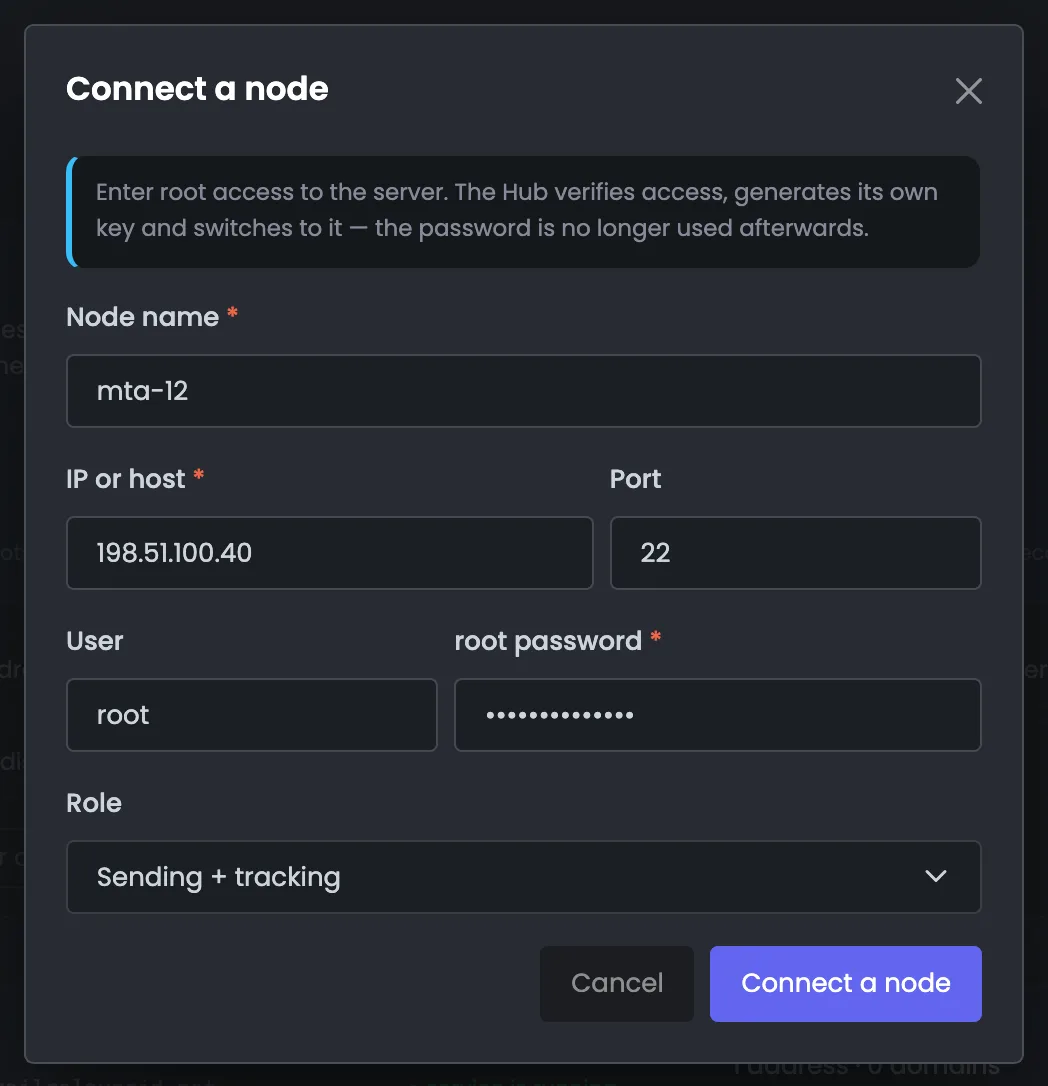
Name, SSH address and port, user, root password and role. In the example — mta-12 at 198.51.100.40 with the “Sending + tracking” role.
HMTA-Hub
SSH
Connect a nodemta-12
198.51.100.40:22sending + tracking
No slot
One click away
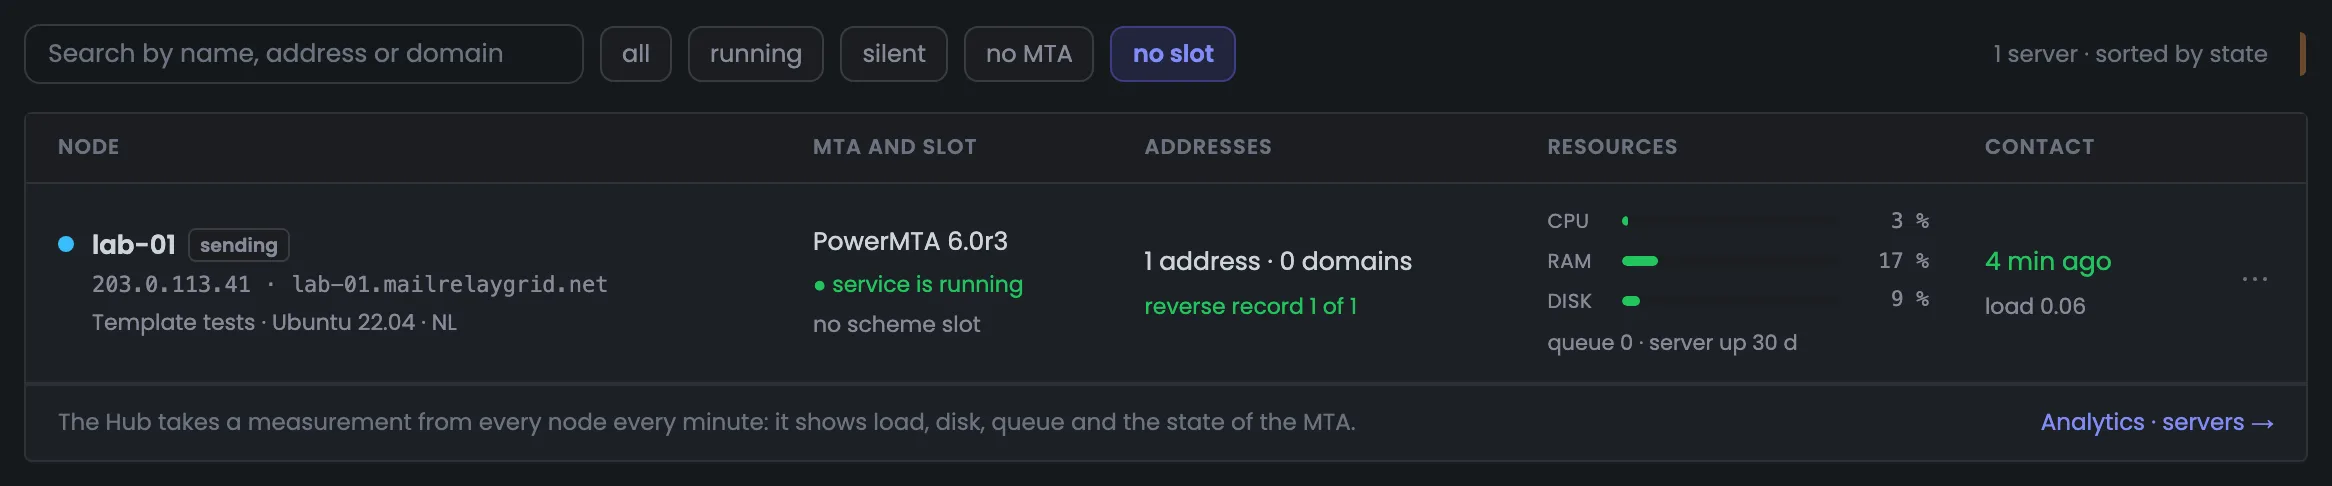
Servers that are running but don’t take a slot in the diagram don’t get lost: the “no slot” filter shows them at once. Here it is lab-01 from the “Template tests” group.
Nlab-01
filter
No diagram slotlab-01
PowerMTA runningTemplate tests
05 / The interface in detail
The “Nodes” section has 7 screens.
Four numbers, the to-do list, search, the server list, the row menu, the “no slot” filter and connecting a node. Above each screenshot: why the screen matters. Below it: what it shows.
Summary and to-do list
2 screens
The first two screens answer the main question of running sending servers — is everything fine right now? Four numbers show how many servers you have, how many are online, how many sending IP addresses there are and how many of them have PTR. Below them is a feed of what needs fixing. At the top right — a link to MTA installation and the “Connect a node” button.
01
All servers in four numbers
Servers, contact, addresses, attention
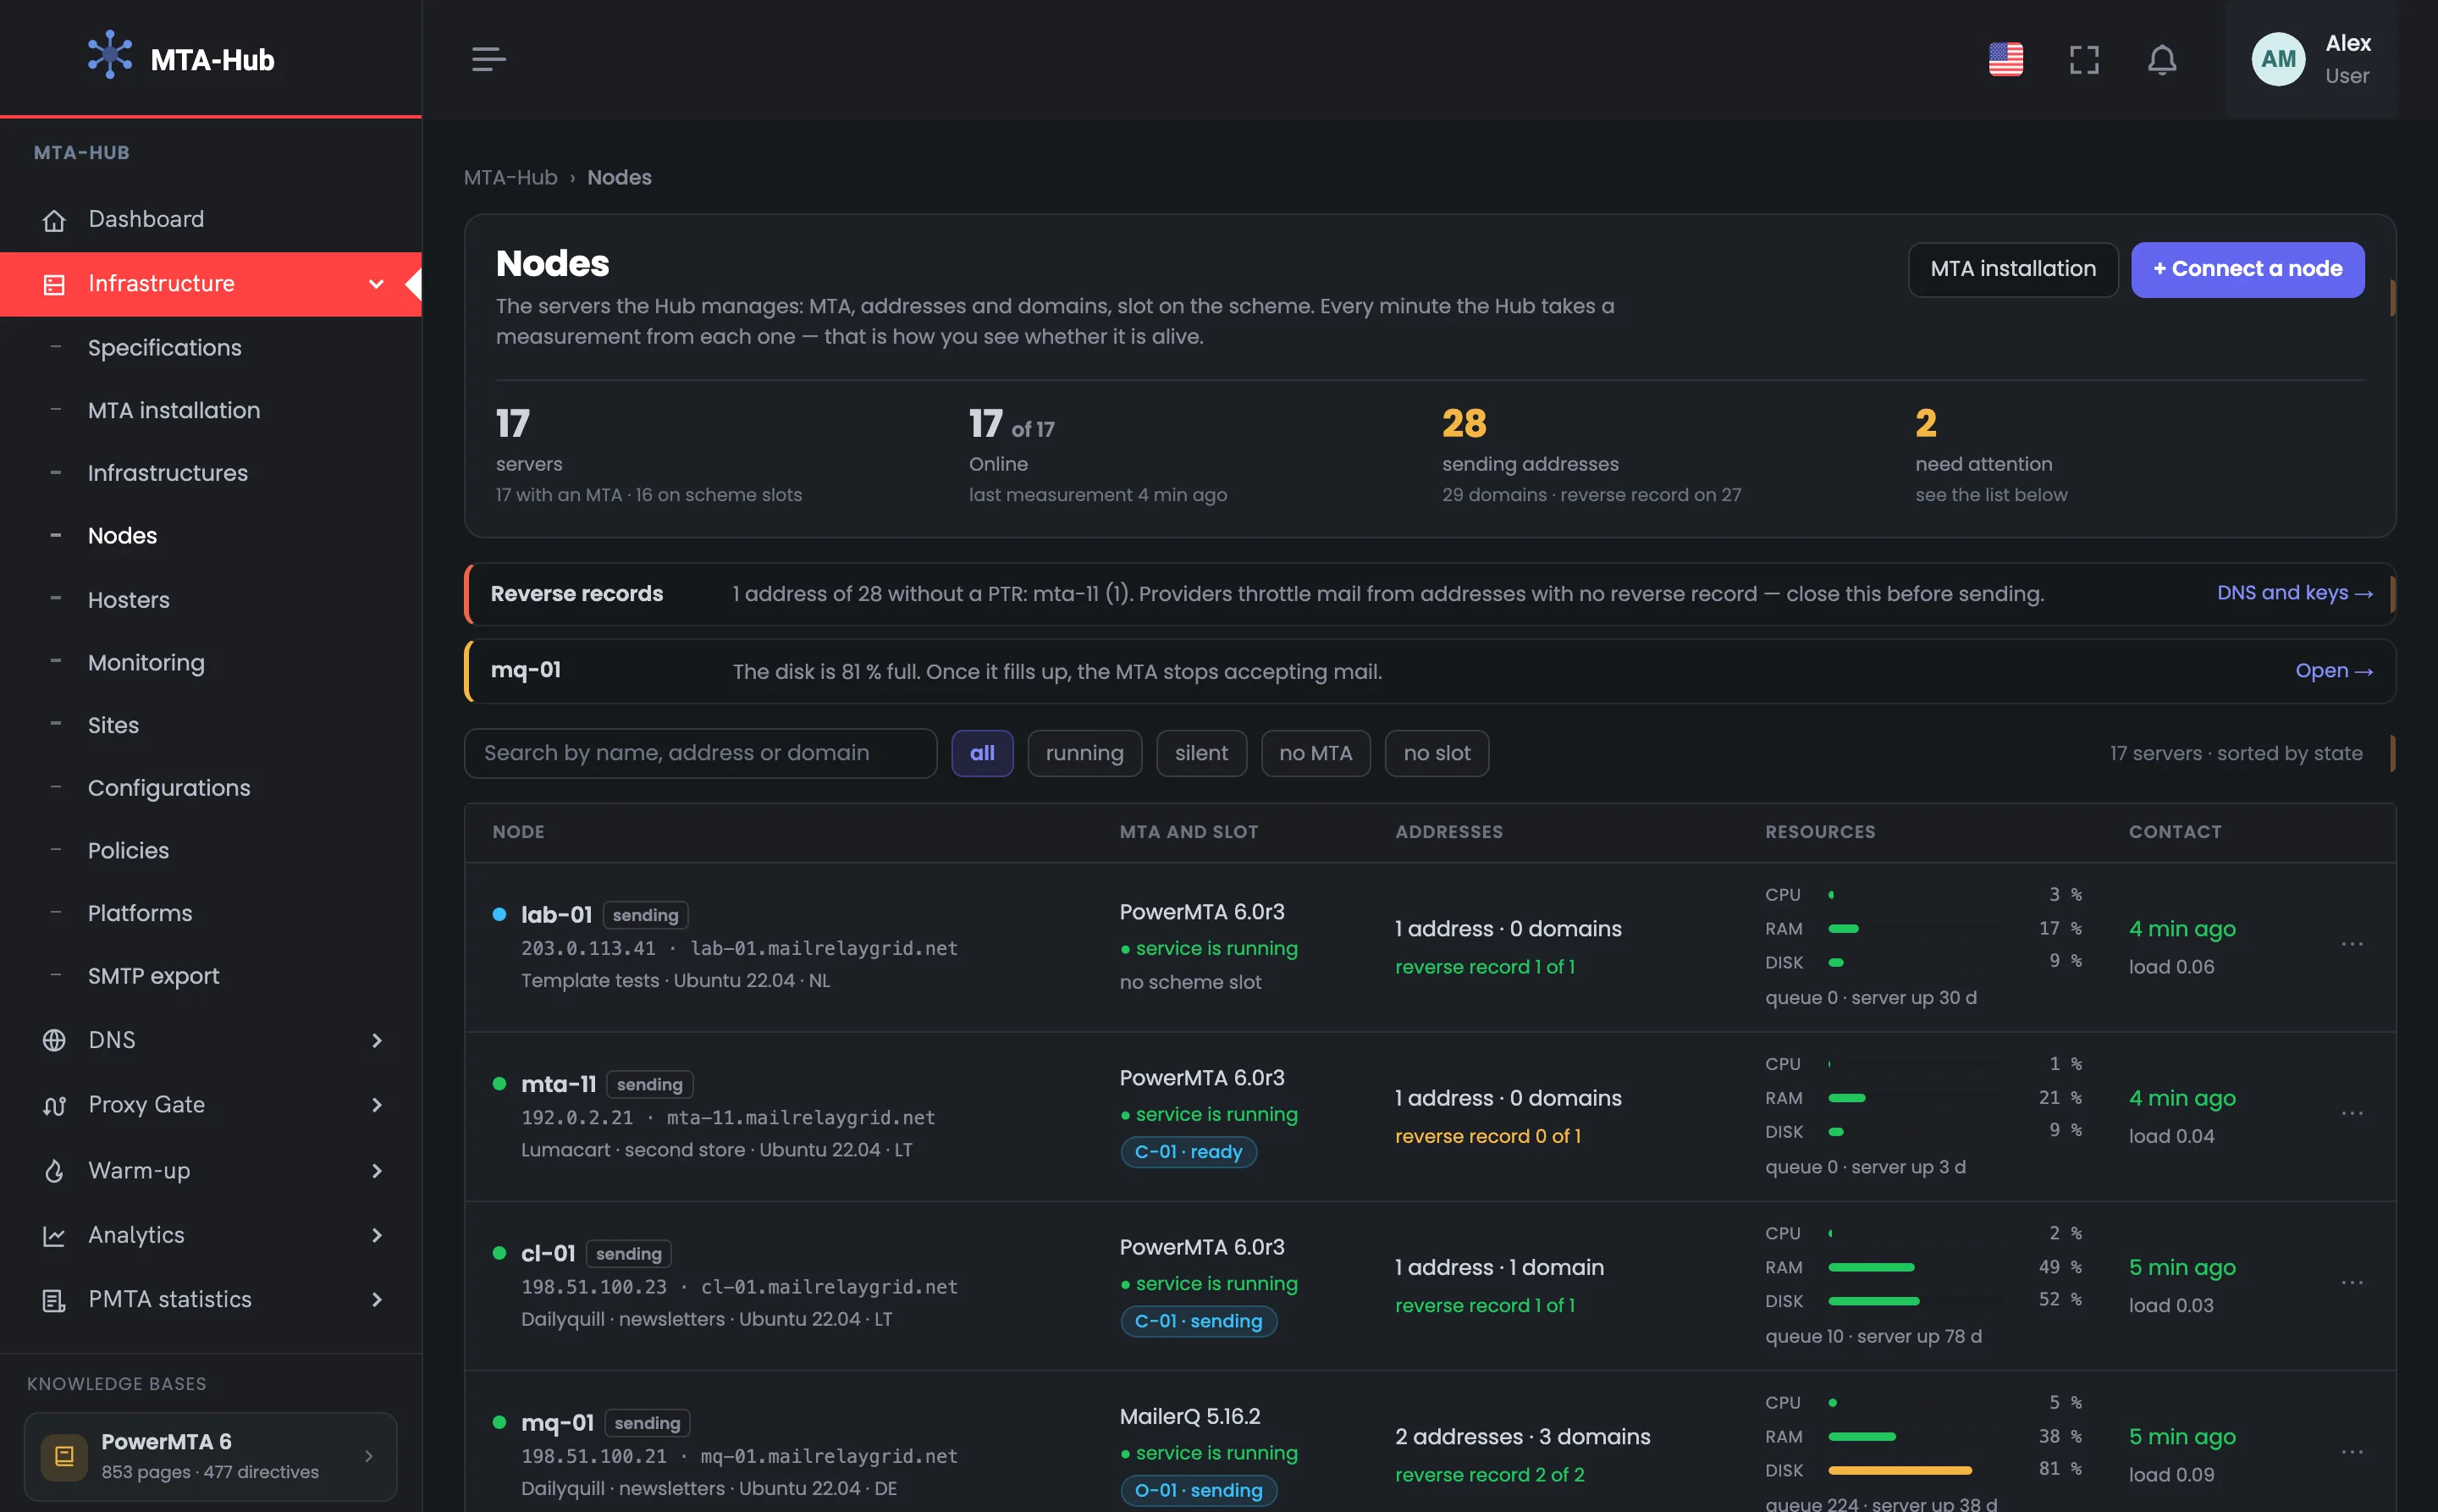
The header of the “Nodes” section sums up all your sending servers in four numbers. Here there are 17 servers, all 17 are online, there are 28 sending IP addresses, and only 27 of them have a reverse DNS record, so the address count is highlighted in yellow. The last number is how many problems are waiting in the feed below. One look at this header tells you whether you can start a mailing calmly or should deal with the to-do list first; on the right — “MTA installation” and “Connect a node”. Open this screen at the start of the working day or before starting a mailing. If “Online” is lower than the total number of servers, or “Need attention” is above zero, work through the feed below first and only then connect new servers.
EnlargeScreen 01 · All servers in four numbers. An example from the MTA-Hub interface.
Servers — 17 — MTA on 17, 16 in diagram slots.
Online — 17 of 17, last check 4 minutes ago.
Sending addresses — 28 — 29 domains, reverse DNS on 27; the number is yellow.
Need attention — 2 — lines in the feed below.
If some servers are silent, the caption under “Online” says how many.
02
What to fix
To-do list
A to-do list for all your servers: a line appears only when something needs doing on a server, and the color of the stripe on the left shows how urgent it is. Here there are two tasks. On the new server mta-11 the hosting provider has not set up the reverse DNS record yet, and mailbox providers limit sending from addresses without PTR — the link leads to “DNS and keys”. On mq-01, the first server of the MailerQ cluster, the disk is 81% full: if it fills up, the MTA will stop accepting mail. Work through the feed from top to bottom: a red line is hurting your mailing right now, a yellow one warns you in advance. A line disappears by itself as soon as the problem is fixed, so you don’t need to check separately whether the fix worked.
EnlargeScreen 02 · What to fix. An example from the MTA-Hub interface.
Reverse DNS — red — 1 address of 28 without PTR: mta-11; link “DNS and keys”.
mq-01 — yellow — disk 81% full; link “Open”.
The disk line appears from 75%, and from 90% the stripe turns red.
Node list
4 screens
Below is the list of PowerMTA and MailerQ nodes itself. Search and filters narrow it down to the servers you need, and sorting lifts the ones that need fixing to the top. Every row holds real data from the latest check, and the row menu leads to the node card, the MTA configuration and the diagram slot. The “no slot” filter shows servers outside the diagram.
03
Search and filters
Name, address, domain
The search and filter bar above the node list. You can search by server name, IP address or domain, and the filters keep only the group you need: all, running, silent, no MTA, no slot. On the right you see how many servers were found. The list is sorted by state — servers that need fixing come first — so in a large fleet a problem node won’t get lost in the middle of the table, and the top of the list works as a task queue. Searching by domain helps when a mailbox provider rejects mail from a particular domain and you need to find out which server it is on. The “silent” filter shows every server without a fresh check — open it if the “Online” number in the header has dropped.
EnlargeScreen 03 · Search and filters. An example from the MTA-Hub interface.
Search — by name, address or domain.
Filters — all, running, silent, no MTA, no slot.
Sorting — by state: what needs fixing comes first.
The other servers follow by name.
04
Node list
One server, one row
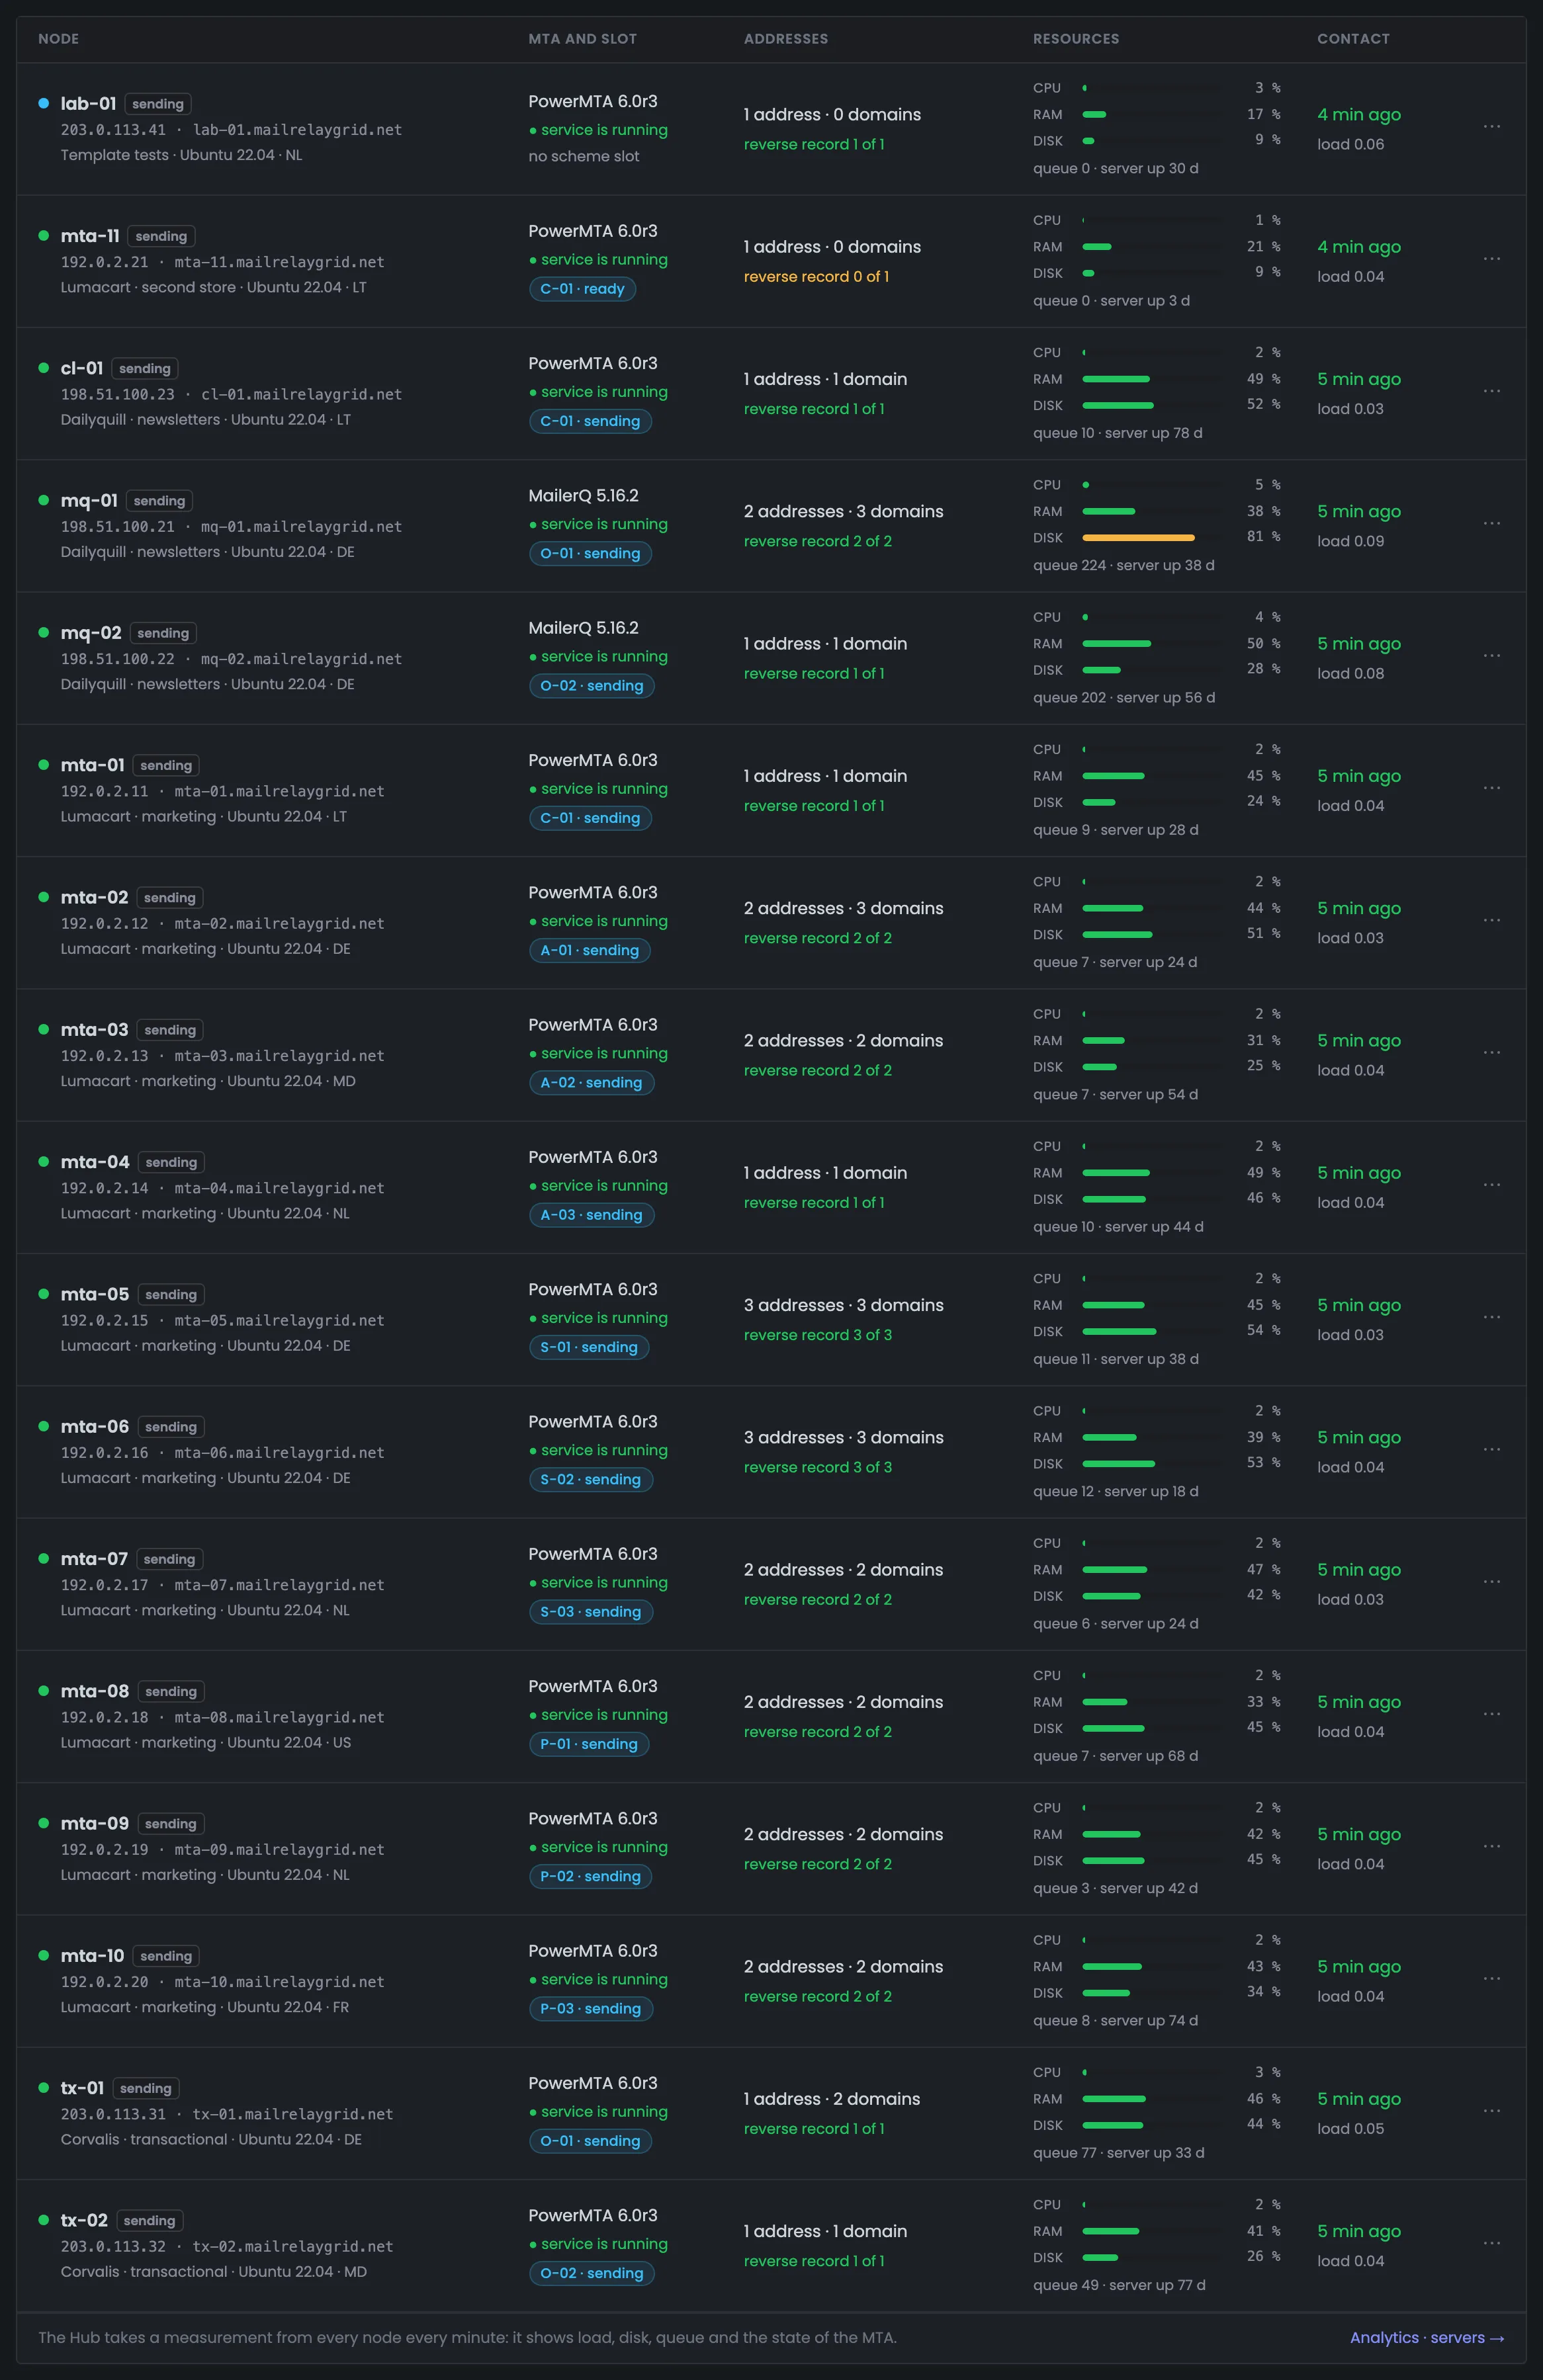
The main screen of the section is the node list, where one row describes one sending server in full: which MTA runs on it and whether the service is up, which diagram slot it takes, how many IP addresses it has and how many of them have PTR, how loaded the CPU, memory and disk are, and when it was last checked. The dot on the left sums up the state: green — all is well, blue — running but outside the diagram or without an MTA, yellow — silent, red — the MTA service is down. Scan the list by the colored dots and highlighted bars. If the disk bar has turned yellow, free up space in advance: the disk threshold is stricter because a full disk stops the MTA.
EnlargeScreen 04 · Node list. An example from the MTA-Hub interface.
Node — name and role, address and host, infrastructure, system and country.
MTA and slot — the MTA, whether the service is running, the diagram slot: “C-01 · sending” or “C-01 · ready”.
Addresses — addresses and domains, reverse DNS: green — on all, yellow — not on all.
Resources — CPU, memory, disk, MTA queue and days without a reboot.
Contact — time of the latest check and the load.
A silent server’s bars fade out: old percentages are not passed off as current ones.
05
Row menu
Node, configuration, diagram
The “⋯” menu at the end of a row gathers the actions for one server, so you don’t have to look for them across the Hub. From here you open the node card and go to the MTA configuration — for PowerMTA that is the stream and policy generator, for MailerQ — access and incoming mail. The “Diagram slot” item appears only for a server that takes a slot. The last item, “Remove from the Hub”, works only after you confirm it, so you can’t delete a server by accident. Most often you go from this menu to the MTA configuration to change sending settings, and to the diagram slot when the server needs to be replaced in that slot or the slot freed. The node card is for the details of a single server.
EnlargeScreen 05 · Row menu. An example from the MTA-Hub interface.
Open node — the server card.
Configuration — for PowerMTA, the stream and policy generator; for MailerQ, access and incoming mail.
Diagram slot — only for a server that takes a slot.
Remove from the Hub — with a confirmation.
In the screenshot the menu is open for mta-11 — the second store’s new server.
06
The “no slot” filter
Servers outside the diagram
The “no slot” filter shows servers that are running but don’t take any slot in the infrastructure diagram. Usually these are test machines: here it is lab-01 with PowerMTA 6.0r3 from the “Template tests” group, created by hand, with no diagram. Such a server is not part of the mailing plan but keeps running, and it is easy to forget about. Turn the filter on from time to time to see all servers outside the diagram and decide what to do with them. If a server should take part in mailings, assign it to a free slot in the infrastructure diagram; if it is no longer needed, remove it from the Hub through the row menu.
EnlargeScreen 06 · The “no slot” filter. An example from the MTA-Hub interface.
lab-01 — PowerMTA 6.0r3, service running, “no diagram slot”.
Group — “Template tests” — created by hand, no diagram.
Address — 1 address, reverse DNS 1 of 1.
Such servers don’t get lost: they are in the list, one click away.
Connecting
1 screen
A new server is connected in a separate window: name, SSH address and port, root password and role. The Hub checks access, creates its own key and logs in with it from then on — the password is no longer used. The next step after connecting is MTA installation.
07
Connect a node
Address, root password and role
The window for connecting a new sending server is the first step; after it the server appears in the node list. Enter the name, IP address and SSH port, the user and root password, and the role: sending, sending + tracking, tracking or own proxy. In the example, mta-12 at 198.51.100.40 is being connected. The password is needed only once — after that the Hub logs in with its own key, and the next step is installing an MTA on the server from the “MTA installation” page. Choose the role by the infrastructure diagram: it tells you which slot the server will take — sending, sending with tracking, tracking or proxy. If the connection fails, check the address, SSH port and password: the Hub starts by checking access.
EnlargeScreen 07 · Connect a node. An example from the MTA-Hub interface.
Node name — mta-12.
IP address and port — 198.51.100.40, 22.
User and root password — root and the password.
Role — sending, sending + tracking, tracking or own proxy.
The Hub will check access, create its own key and switch to it — the password is not used after that.
06 / Questions about nodes
Common questions about managing sending servers.
In short: how the Hub knows a server is alive, what goes into the to-do list and how a server is connected.
Address, SSH port, root password and server role — the Hub checks access and from then on logs in with its own key.
How does the Hub know a server is working?
From a check every minute: load, memory, disk, queue and the MTA service. The “active” status from installation plays no part here.
When is a server considered silent?
When there has been no data from it for 15 minutes. Its resource bars fade out so that old percentages are not passed off as current ones.
What goes into the to-do list?
Addresses without reverse DNS, a full disk, a silent server, a stopped MTA service, a server without an MTA and an unsupported operating system.
Why does reverse DNS matter so much?
Mailbox providers limit sending from an address without PTR. That is why every row shows the share of addresses that have a record, and an incomplete share is highlighted.
Does the Hub store the root password?
No. The password is needed once: the Hub checks access, creates its own key and logs in with it from then on.
What roles can a server have?
Sending, sending + tracking, tracking or own proxy.
What does “no slot” mean?
The server is running but doesn’t take a slot in the infrastructure diagram — a test server, for example. The filter shows such servers in one click.
Why does reverse DNS say “not checked”?
Reverse DNS records come from the latest DNS check. “Not checked” and “no record” are different answers, and the page never mixes them up.
07 / Next step
Install PowerMTA or MailerQ on the server.
Once the server is connected, the next step is to install an MTA on it: PowerMTA or MailerQ. Installation runs from the “MTA installation” page, step by step and with checks.
Once the MTA is running, you see a single server end to end — state, queues and controls — in Monitoring.