A specification is a calculation: how many servers, IP addresses and DNS accounts you need, and at which stages of your email campaigns. An email sending infrastructure is that same specification turned into a server diagram: the Hub creates slots, and you attach real machines to them. The summary shows how many slots are already filled and what actually sits in them.
All infrastructures
01 · Infrastructures5 · 4 from specifications
02 · Slots filled24 of 36 · 67%
03 · Servers17 · 28 addresses
04 · Need attention1
While a slot is empty, its stage does not work — no matter how many servers sit at other stages
State from the facts
Not a manual flag
The Hub decides “running”, “warming up”, “built”, “building” and “not started” from what actually sits in the slots and sends mail — not from a flag someone set by hand.
HMTA-Hub
from the facts
Diagram slotRunning
MTA installed — readysent in the last 24 hours
Problem in a slot
Wrong server
If the server in a slot seriously doesn't match the plan — the wrong MTA, or outbound port 25 is blocked — the slot gets the “problem” state and goes on the to-do list.
NNode
check
Diagram slotProblem
wrong MTAport 25 blocked
02 / Sending stages
How many slots are filled at each stage.
Each infrastructure shows how many slots are filled at each stage of your campaigns — for example, list cleaning, activation, segmentation and the sales series. If cleaning is built but activation is empty, the campaign will go no further — and the “Next” line tells you plainly where to look.
Three infrastructures from the exampleData from the screenshots
Building
2 of 14
Created four days ago: the first server at the list cleaning stage and the DNS account for its zones are in place. Activation, segmentation and the sales series — 0 of 3 each.
SDiagram
stages
Slots filled2 of 14 · 14%
cleaning 1 of 1others 0 of 3
Next
Activation
Of the 12 free slots, three are at the “Activation” stage, and without it the chain stalls. For an infrastructure like this, the “Open the diagram” button is highlighted — that is where slots are assigned.
HMTA-Hub
hint
Waiting for a server12 slots
3 at activationOpen the diagram
Built
14 of 14
All four stages of the chain are fully built: 10 servers and 4 DNS accounts. 10 slots are running, 4 more are ready.
SDiagram
stages
Slots filled14 of 14 · 100%
all 4 stages20 addresses
Next
Warm-up in progress
The addresses are ramping up: volume grows gradually, and full-scale sending starts after warm-up. In “parallel” mode, some addresses are already sending.
HMTA-Hub
hint
StateWarming up
parallel modepeak 7,000 a day
Built
3 of 3
Corvalis transactional email: two servers at the “Offer” stage and a DNS account. Two slots are running, the third is ready.
SDiagram
stages
Slots filled3 of 3 · 100%
offer 2 of 2DNS 1 of 1
Next
Build complete
Every slot is filled and sending. From here, you watch delivery and reputation on the diagram and in monitoring.
HMTA-Hub
hint
StateRunning
production modepeak 12,000 a day
03 / To-do list
Where the build has stalled — a to-do list.
The feed under the header names infrastructures where the build has stalled or a slot does not match the plan. It is a to-do list, not an event feed: once the problem is gone, so is the line. The link on the right leads to where you fix it.
Red stripe
Slot with a problem
The server in the slot seriously doesn't match the plan: the wrong MTA or port 25 is blocked.
Empty diagram
Build not started
The slots exist, but there is not a single server — the line shows the date since when the diagram has been empty.
Light-blue stripe
One stage built
Like the second store: cleaning is ready, the other stages are waiting for servers.
Earlier calculation
Slots outside the plan
Left over from an earlier version: put the servers back to work or remove the slots.
04 / Group without a diagram
A manual server group without a diagram.
You can also create an infrastructure by hand — simply as a group of servers. Manual groups, servers outside diagrams and the archive are shown separately and do not mix with infrastructures built from specifications.
Manual group
No slots or stages
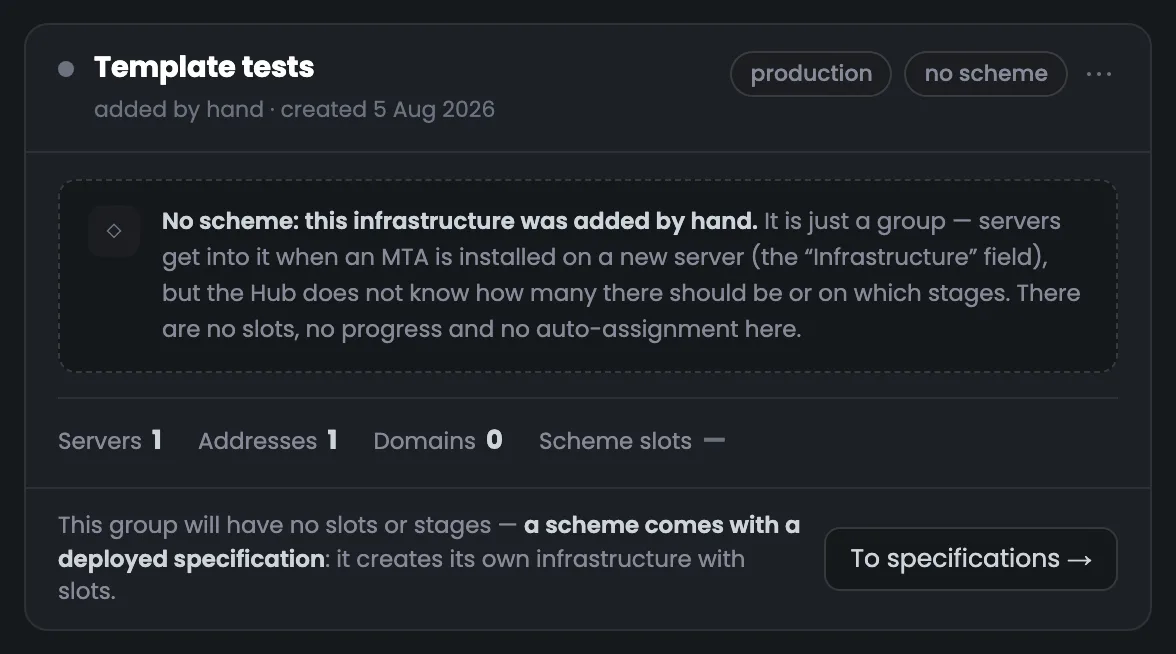
A name, a purpose and a mode — nothing else. It has no slots, stages or progress: servers join the group when an MTA is installed on them, but the Hub does not know how many there should be.
GGroup
by hand
No diagramTemplate tests
no slotsno stages
A diagram comes from a specification
The “Deploy” button
An infrastructure with a diagram is created with the “Deploy” button in an approved specification: the Hub itself creates slots for servers and DNS accounts for each stage of the calculation.
HMTA-Hub
deploy
From a specificationSlots by stage
servers and DNSpeak from the calculation
Only an empty infrastructure can be removed: first free the filled slots on the diagram — the servers themselves keep working.
05 / The interface in detail
The “Infrastructures” section has 8 screens.
Four numbers, a to-do list, four cards in different states, filters and creating a group. Above each screenshot: why the screen matters. Below it: what it shows.
Summary and to-do list
2 screens
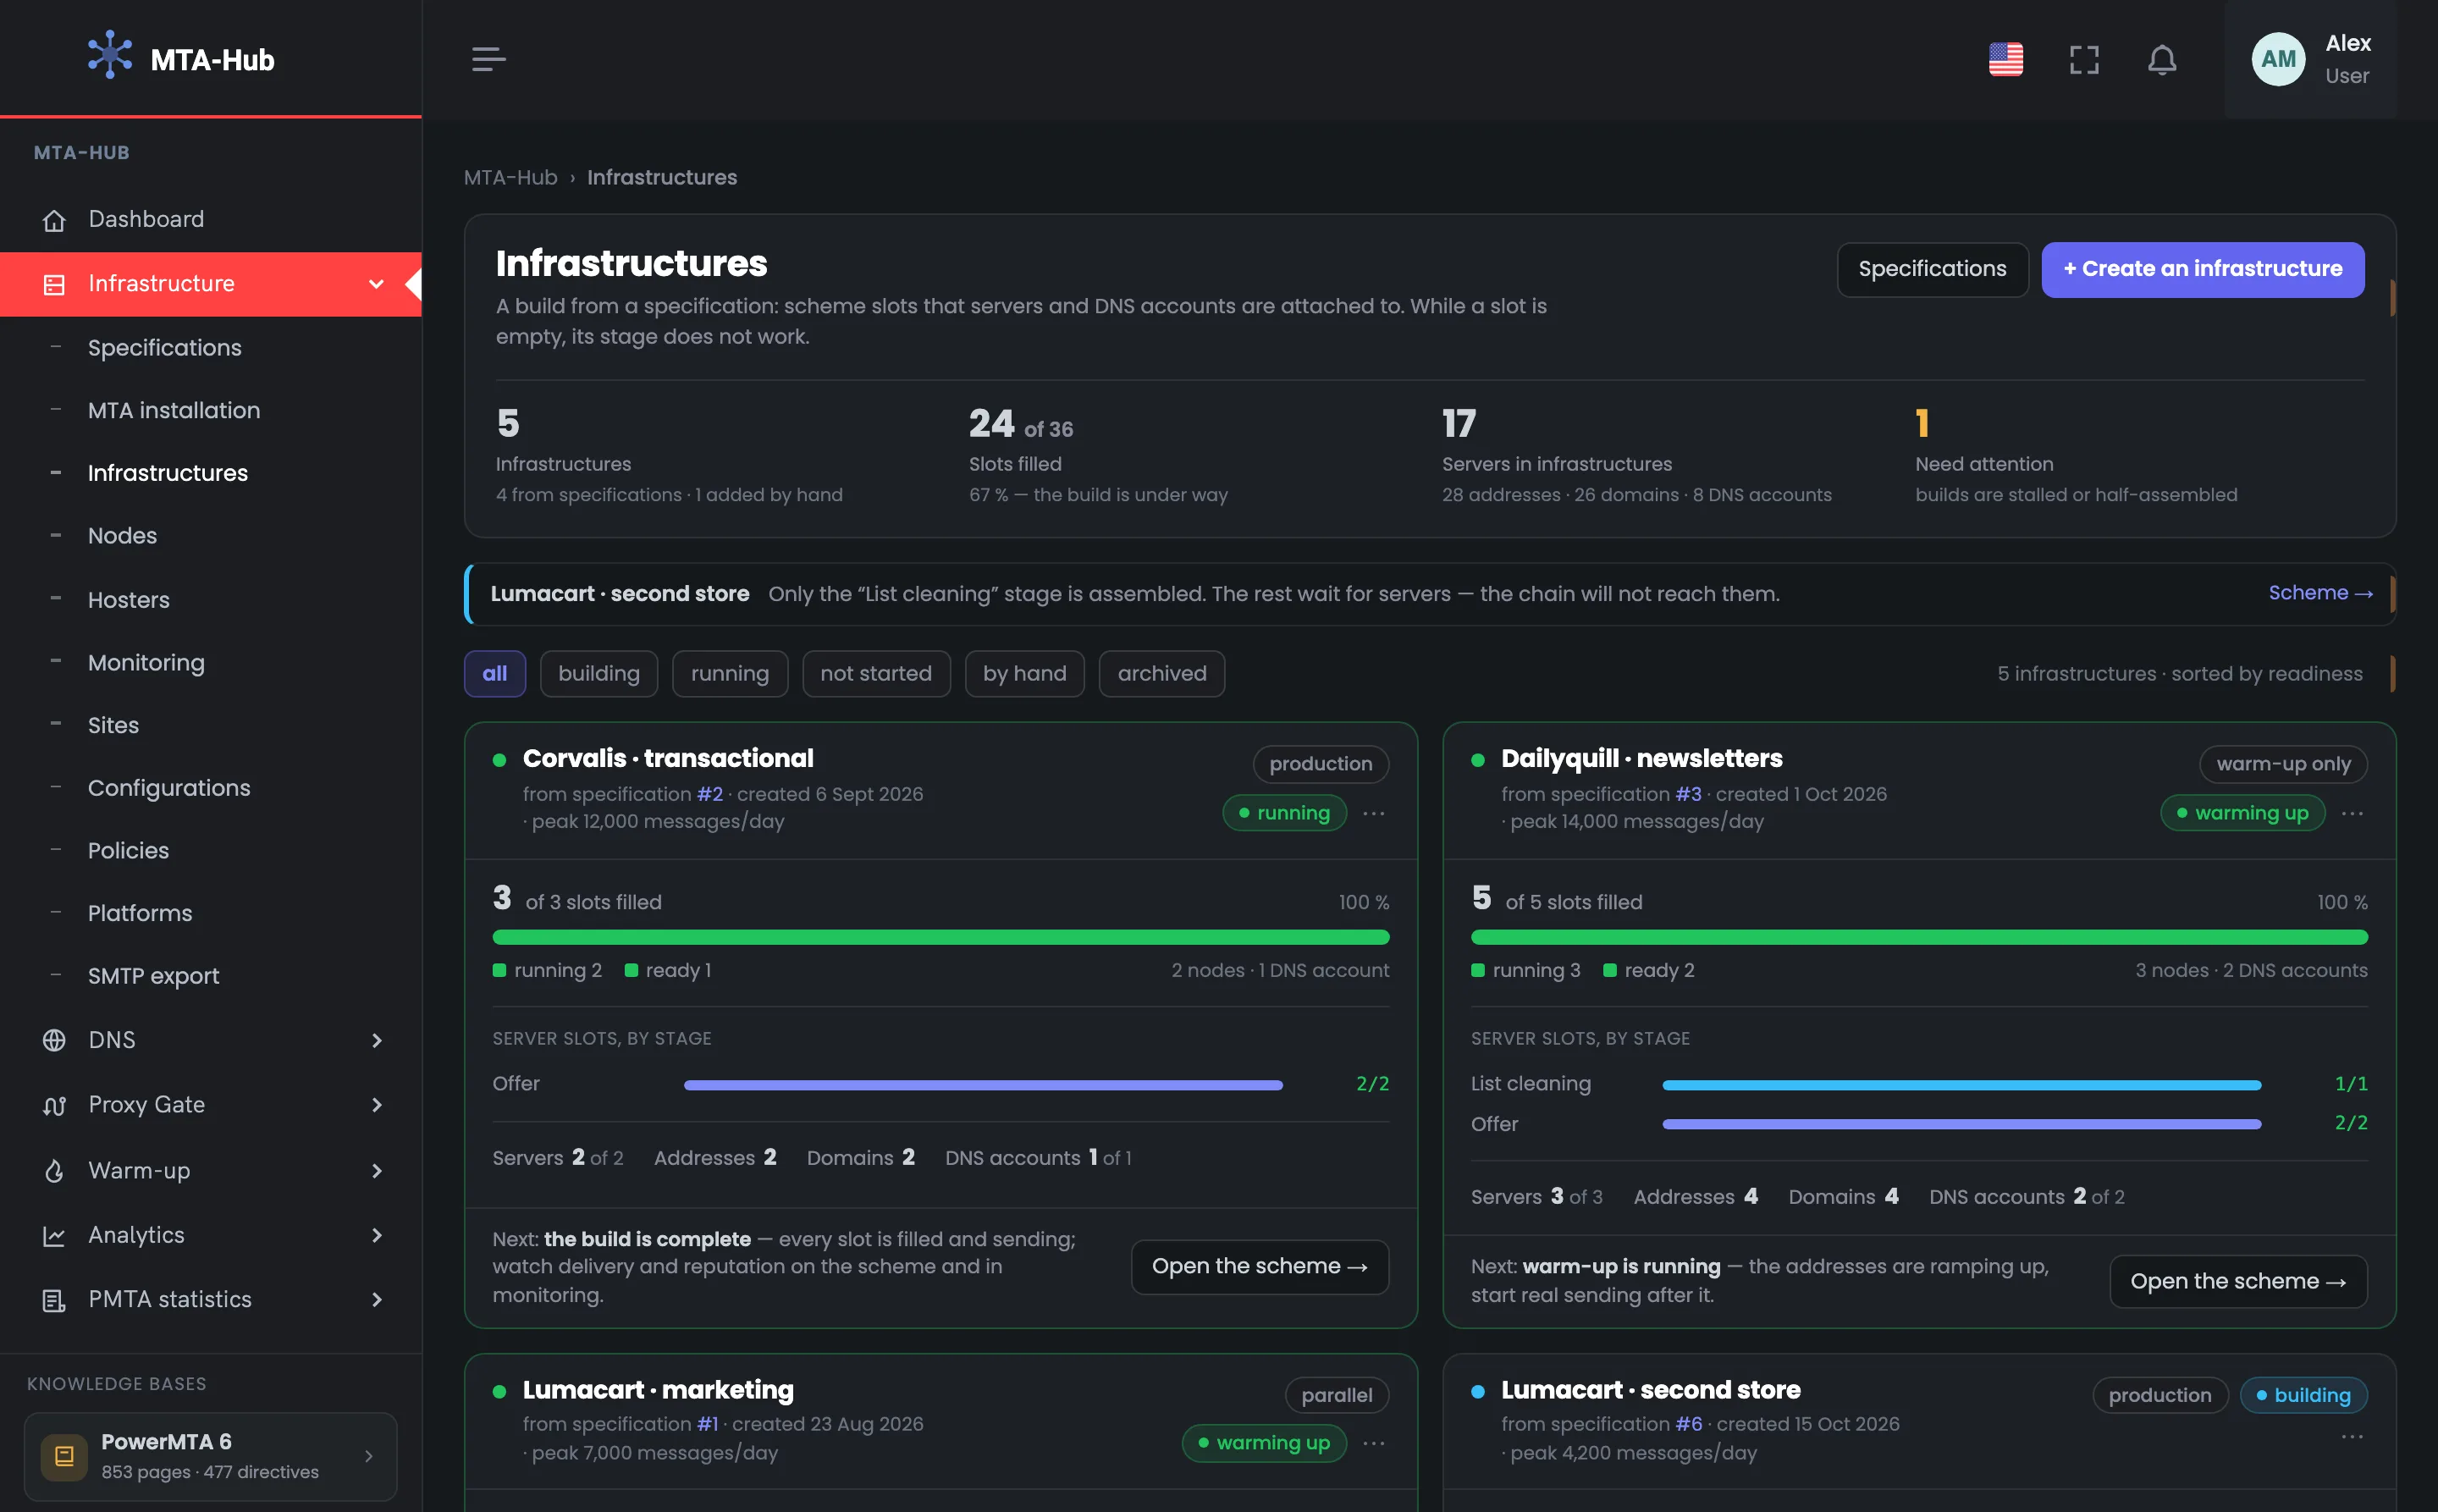
The first two screens show how the build of your whole email sending infrastructure is going — not mail statistics. Four numbers tell you how many infrastructures there are, how many slots are filled, how many servers and addresses are already in place and what needs attention. Below is the to-do list: infrastructures where something has stalled, with a link to where you fix it.
01
What is built across all diagrams
Four numbers about the build
The section header sums up your whole email sending infrastructure in four numbers about the build. There are 5 infrastructures here, 4 of them from specifications; 24 of 36 slots are filled, or 67%; the diagrams hold 17 servers with 28 addresses, and one infrastructure needs attention. These numbers show how ready the infrastructure is overall and how many slots are still waiting for servers. On the right — a link to “Specifications” and the “Create an infrastructure” button. Open the section when you need to know how many more servers to buy and attach: the gap between filled and total slots is how much building is left. If “Need attention” is above zero, start with the feed below.
EnlargeScreen 01 · What is built across all diagrams. An example from the MTA-Hub interface.
Infrastructures — 5 — 4 from specifications, 1 added by hand.
Slots filled — 24 of 36 — 67%, the build is under way.
Servers in infrastructures — 17 — 28 addresses, 26 domains, 8 DNS accounts.
Need attention — 1 — builds that have stalled or are half done.
Connected servers that belong to no infrastructure are left out of the totals but not lost — a line “N more outside the diagrams” appears for them.
02
What to fix
To-do list
The to-do list names infrastructures where the build has stalled and explains why. Here there is one line: Lumacart's second store has only the “List cleaning” stage built, while the other stages are waiting for servers — the email chain will never reach them. The link on the right leads to the diagram, where slots are assigned. Lines are sorted by urgency, so it is easy to work through the list from top to bottom, and a fixed problem disappears from it by itself. An empty list means every build is moving. Check here after you attach each server: if the line is gone, the stage is built and the chain can move on.
EnlargeScreen 02 · What to fix. An example from the MTA-Hub interface.
Lumacart · second store — only the “List cleaning” stage is built.
Why it matters — the other stages are waiting for servers — the chain will not reach them.
Diagram — a link to where slots are assigned.
Slots with a problem come first, then builds not started, then half-built ones and slots outside the plan.
Infrastructure cards
4 screens
Next comes a card for each infrastructure. Four examples show a running one, one warming up, an unfinished one and a manual group without a diagram. Each shows the filled slots, the stages, what actually sits there and a “Next” line suggesting the next step. A stage has the same color here as in the specification and on the diagram.
03
A running infrastructure
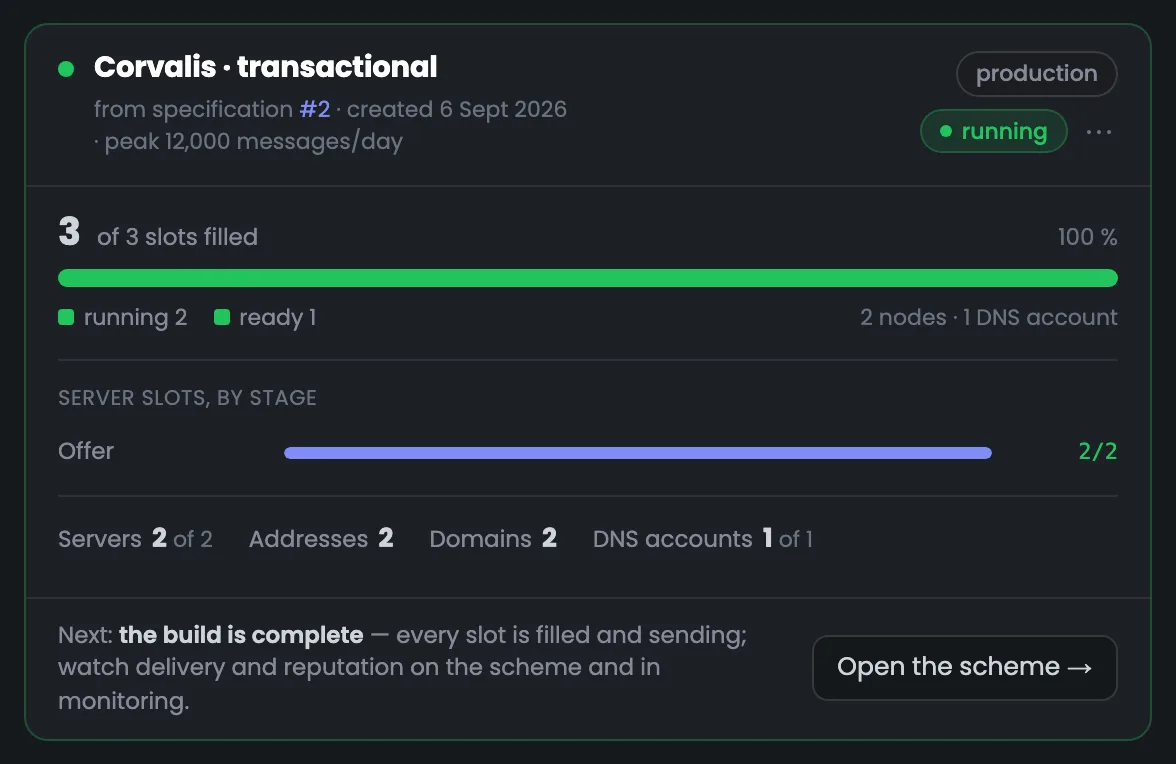
Corvalis transactional email
The card of a running infrastructure — this is what a finished build looks like. Corvalis transactional email was built from specification #2: all 3 of 3 slots are filled, two are running and one more is ready; two servers sit at the “Offer” stage. The mode is “production”, the peak is 12,000 emails a day. The “Next” line says the build is complete: delivery and reputation are now watched on the diagram and in monitoring. Open a card like this to make sure the build is finished and you can move on to watching the sending. If a slot in a running infrastructure gets the “problem” state — for example, the wrong MTA or port 25 blocked — it shows up on the to-do list again.
EnlargeScreen 03 · A running infrastructure. An example from the MTA-Hub interface.
Header — specification #2, created Sep 6, peak 12,000 emails a day; mode “production”, state “running”.
Slots filled — 3 of 3 — 100%: 2 running, 1 ready; 2 nodes and 1 DNS account.
By stage — “Offer” — 2 of 2.
What is actually there — 2 servers, 2 addresses, 2 domains, 1 DNS account.
Next — the build is complete — delivery and reputation are watched on the diagram and in monitoring.
A stage has the same color here as in the specification and on the diagram.
04
Warm-up in progress
Lumacart marketing
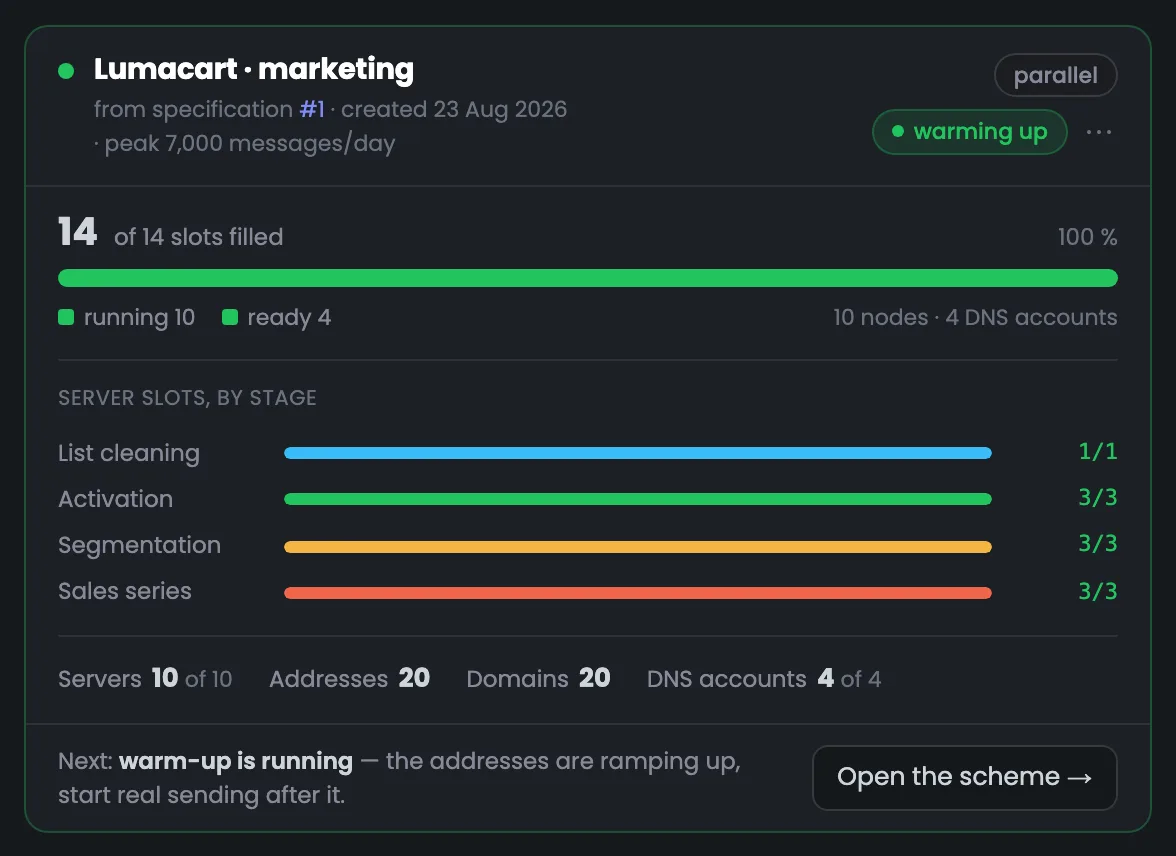
The Lumacart marketing setup is an infrastructure that is fully built but still warming up. All 14 slots across four stages are filled: 10 servers with 20 addresses and 4 DNS accounts; 10 slots are running, 4 are ready. The “Next” line reminds you that warm-up is in progress: volume grows gradually, and full-scale sending starts after it. The card makes it clear that you are no longer waiting for servers here, but for warm-up to finish. While it runs, follow it in the “Warm-up” section, and in monitoring watch how mailbox providers accept the new addresses. Volume grows gradually up to the peak of 7,000 emails a day.
EnlargeScreen 04 · Warm-up in progress. An example from the MTA-Hub interface.
Slots filled — 14 of 14 — 10 running, 4 ready; 10 nodes and 4 DNS accounts.
By stage — cleaning 1/1, activation 3/3, segmentation 3/3, sales series 3/3.
What is actually there — 10 servers, 20 addresses, 20 domains, 4 DNS accounts.
Next — warm-up in progress — full-scale sending starts after it.
“Parallel” mode: some addresses are already warmed up and sending, others are still warming up.
05
Build under way
Lumacart second store
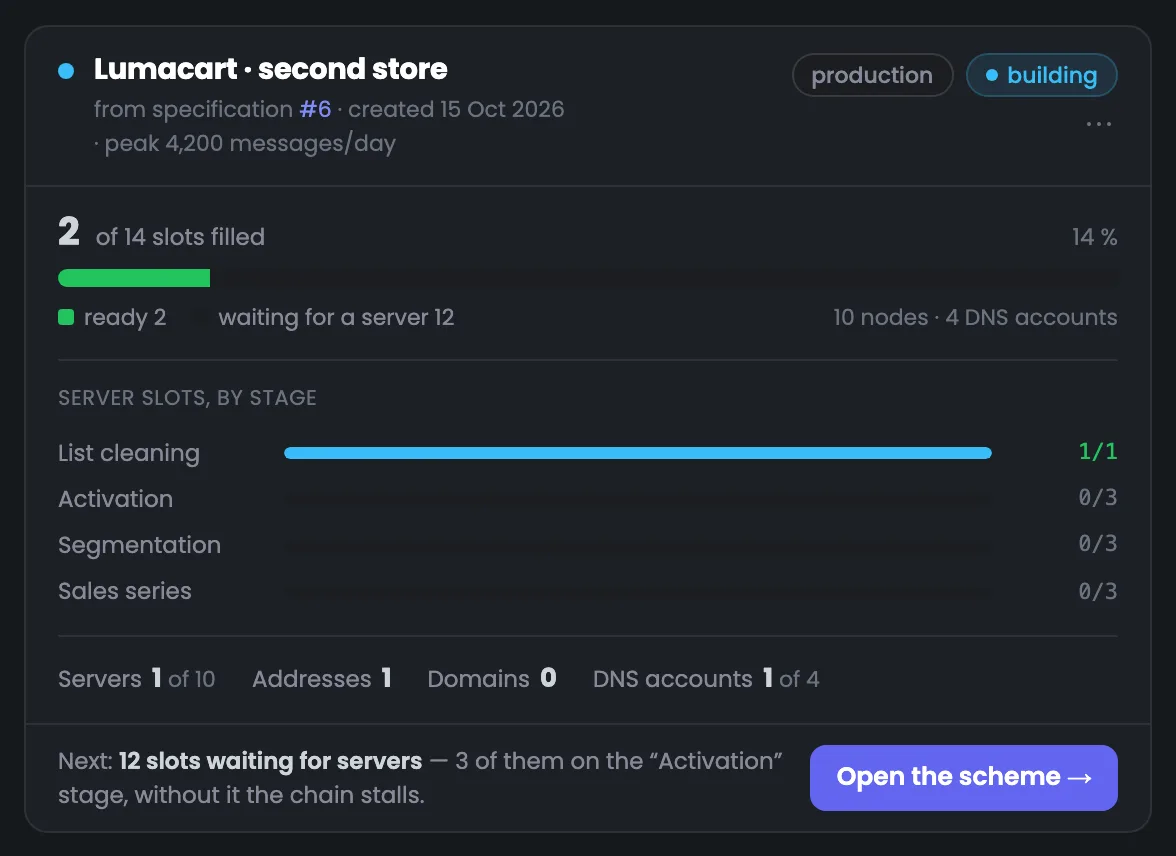
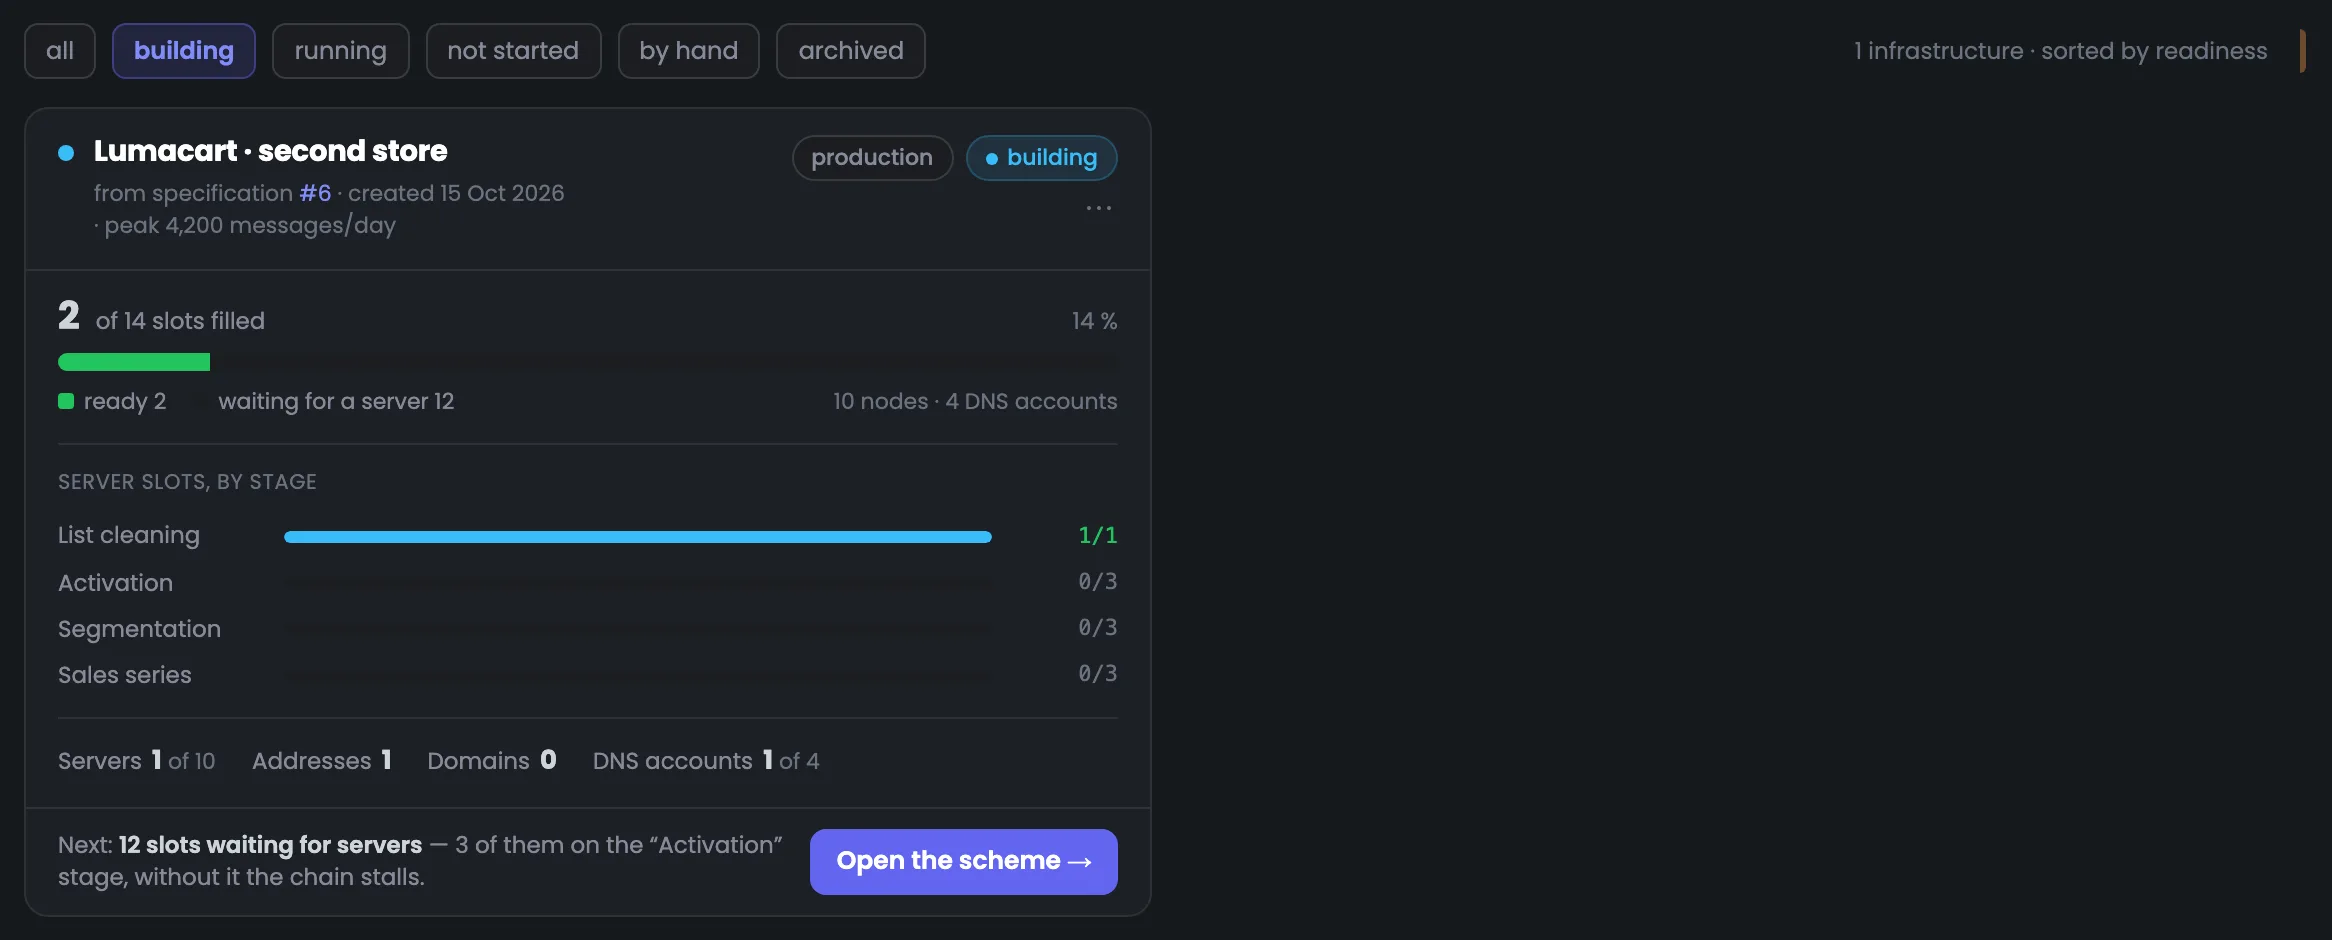
The card of an unfinished infrastructure: Lumacart's second store was created four days ago, and only 2 of 14 slots are filled. The stages show at once where it is empty: list cleaning is built, while activation, segmentation and the sales series are at 0 of 3 each. The “Next” line points out the main thing: of the 12 free slots, three are at the “Activation” stage, and without it the email chain stalls. Servers are assigned to these slots on the diagram — the “Open the diagram” button on such a card is highlighted. Open cards like this first: an empty stage holds up the whole chain, no matter how many servers sit at the neighboring ones.
EnlargeScreen 05 · Build under way. An example from the MTA-Hub interface.
Slots filled — 2 of 14 — 14%: 2 ready, 12 waiting for a server.
By stage — cleaning 1/1, the other three stages 0 of 3 each.
What is actually there — 1 server of 10, 1 address, 0 domains, 1 DNS account of 4.
Next — 12 slots are waiting for servers, 3 of them at the “Activation” stage; without it the chain stalls.
For an infrastructure like this, the “Open the diagram” button is highlighted: that is where slots are assigned.
06
Group without a diagram
Created by hand
The card of a group without a diagram — an infrastructure created by hand. It has only a name, a purpose and a mode, with no slots, stages or progress: servers join the group when an MTA is installed, but the Hub does not know how many there should be. A group like this is handy when you just want to keep servers together, test ones for example. If you need a diagram with slots and stages, the card's button leads to specifications: only an infrastructure created from a calculation has a diagram. If the group has grown and needs a plan with slots and stages, calculate a specification and deploy it — then you get a full diagram.
EnlargeScreen 06 · Group without a diagram. An example from the MTA-Hub interface.
Why there are no slots — servers join the group when an MTA is installed, but the Hub does not know how many there should be.
Button — leads to specifications — only an infrastructure from a specification has a diagram.
Manual groups are shown separately and do not mix with infrastructures from specifications.
Filters and creation
2 screens
At the bottom — six filters by state and the create window. The filters quickly find infrastructures that are building, running, not started or archived. The window creates only a group without a diagram: an infrastructure with a diagram comes from an approved specification via the “Deploy” button.
07
Filters
Six filters by state
Filters by state help you quickly find the right infrastructures when there are many. There are six: all, building, running, not started, by hand and archived; the screenshot has “building” selected, which shows every unfinished build. Within the list, running ones come first, and ties go to the one with the larger share of filled slots. The “all” filter shows everything except archived infrastructures, and the number of cards found is shown on the right. The “not started” filter shows diagrams where slots exist but there is not a single server — builds like this are easy to forget — and “archived” holds what is no longer in use.
EnlargeScreen 07 · Filters. An example from the MTA-Hub interface.
Filters — all, building, running, not started, by hand, archived.
“All” — everything except archived.
Sorting — running ones first, ties by the share of filled slots.
On the right — how many cards were found.
08
Create an infrastructure
Group without a diagram
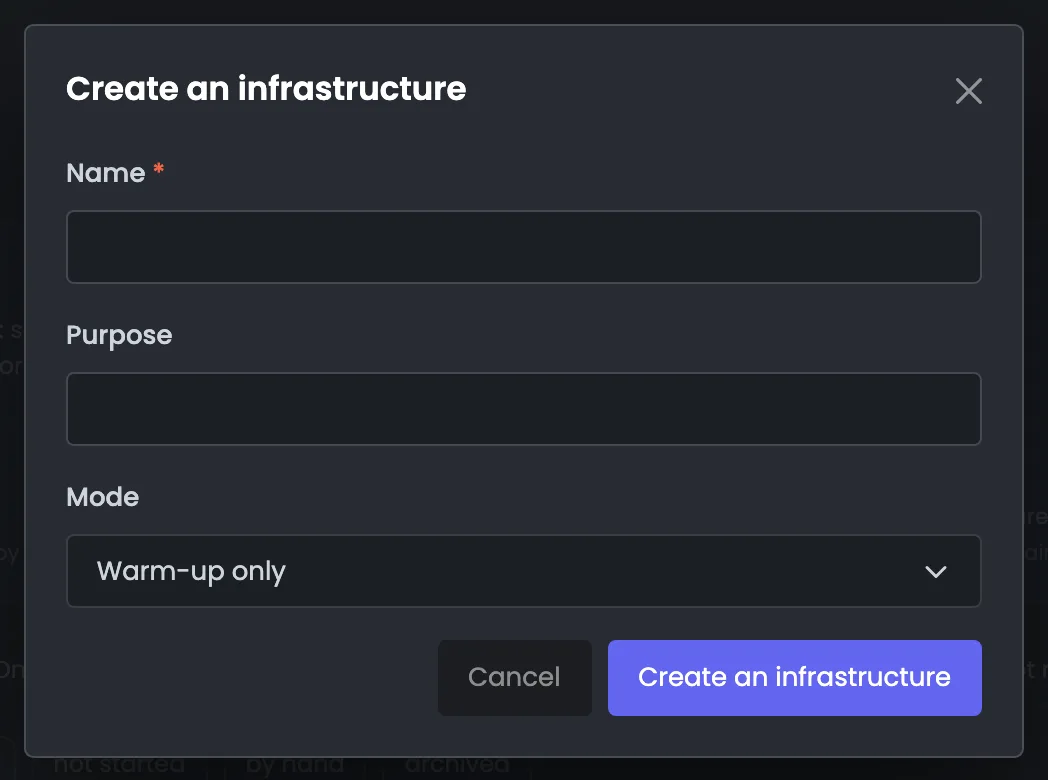
The “Create an infrastructure” window adds a group of servers without a diagram. You only enter a name, the group's purpose and a mode: production, warm-up only or parallel. Such a group gets no slots or stages — it is simply a way to keep servers together. If you need a full email sending infrastructure with a diagram of slots and stages, you do not create it here but with the “Deploy” button in an approved specification — then the Hub itself creates slots for servers and DNS accounts. Open this window when you need to group test or temporary servers without waiting for a calculation.
EnlargeScreen 08 · Create an infrastructure. An example from the MTA-Hub interface.
Name — the group's name.
Purpose — what the group is for.
Mode — production, warm-up only or parallel.
An infrastructure with a diagram is created differently — with the “Deploy” button in an approved specification.
06 / Questions about infrastructures
Common questions about sending infrastructure.
In short: how an infrastructure differs from a specification, how its state is worked out and what to do about an empty stage.
2 of 14 slots filled: the stages show where it is empty, and the “Next” line tells you where to look.
How is an infrastructure different from a specification?
A specification is a calculation: how many servers, addresses and DNS accounts you need. An infrastructure is that same calculation turned into a diagram with slots that you attach real machines to.
How does the Hub work out the state?
From the facts: what sits in the slots and whether it sends mail. An MTA is installed on the server — the slot is “ready”; it sent mail in the last 24 hours — “running”.
What does a “problem” in a slot mean?
The server seriously doesn't match the plan: the wrong MTA, or outbound port 25 is blocked.
Why isn't my campaign sending even though the servers are in place?
Most likely there is an empty stage: if cleaning is built but activation is empty, the chain goes no further. The card's stage breakdown shows this at once.
How do I create an infrastructure with a diagram?
With the “Deploy” button in an approved specification. The Hub itself creates slots for servers and DNS accounts for each stage of the calculation.
What is a group without a diagram for?
To simply keep servers together — test ones, for example. It has no slots, stages or progress.
Can I delete an infrastructure?
Only an empty one. First free the filled slots on the diagram — the servers themselves keep working.
What are slots outside the plan?
Slots left over from an earlier version of the calculation. You decide: put the servers back to work or remove the slots.
07 / Next step
Assign servers on the infrastructure diagram.
The card tells you what is built and what comes next, while slots are assigned on the infrastructure diagram: there you see each slot, its stage and the server in it.
An infrastructure with a diagram is born from an approved specification — with the “Deploy” button.