Email sending infrastructure diagram: from your list to the mailbox provider
Infrastructure diagram. The whole path of an email in one picture.
One picture holds the source list, the mailing stages with hosting accounts and servers inside them, the domain zones, reverse DNS records and the recipients’ mailbox providers.
On top of the plan — what is really there: which slots hold real servers, how Google and Microsoft accept your mail, how many bounces there are.
A specification works out how many servers, addresses and domains you need. The sending infrastructure diagram shows how it all fits together and what is already working: the “Plan · Actual” switch changes the numbers in the header and in the stage blocks. An empty slot is visible at once — it is a gray tile.
Lumacart · marketing summary
01 · Deliverability97.3% over 14 days
02 · Bounces1,641 hard
03 · Build100% · 14 of 14
04 · To the offer80 days
05 · Status1 problem
The Hub says “No problems” only when everything is in order: the slots with servers, the addresses and the domains
Honest shares
Never rounded up
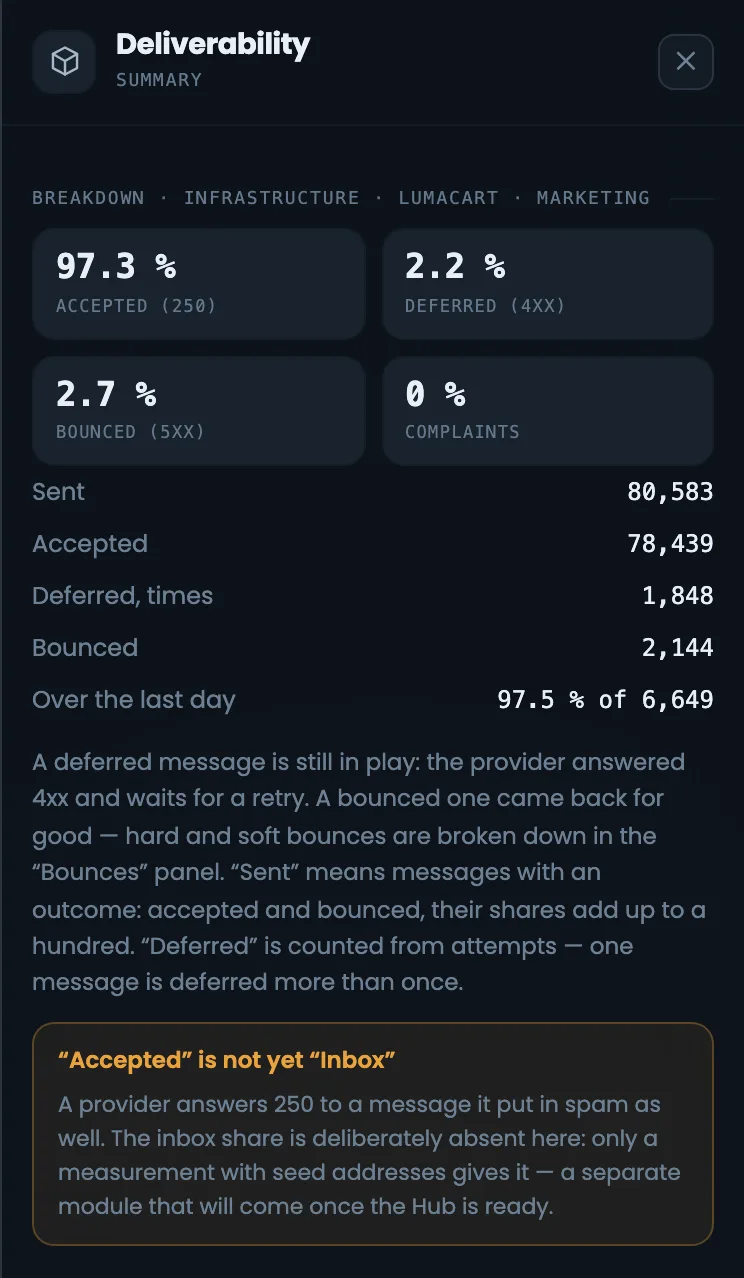
Shares are never rounded in your favor: while even one email has not been delivered, you will see “97.3%”, not “100%”. Deferred emails (4xx) are not counted — the same email can be deferred several times.
MMTA
14 days
Deliverability97.3%
78,439 of 80,583today 97.5%
One problem
Domain in DNS
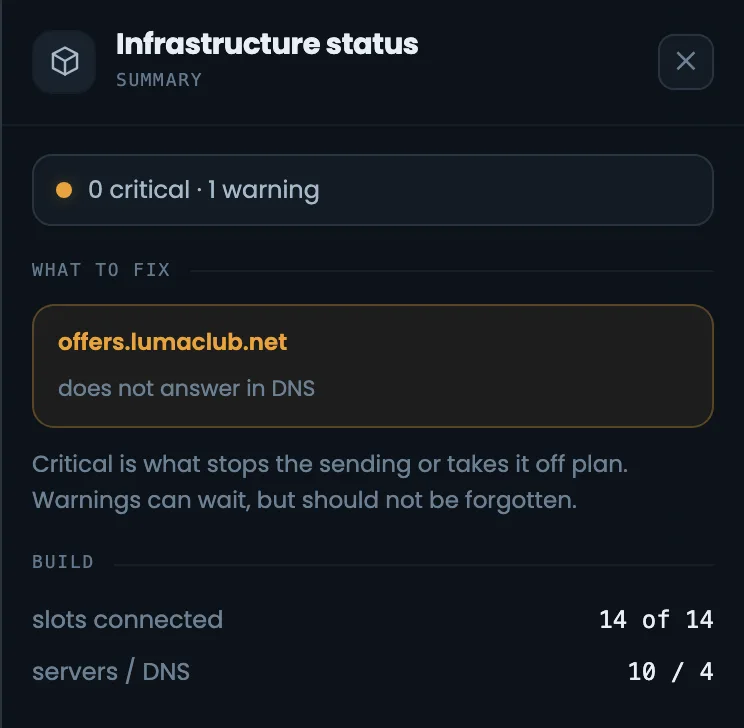
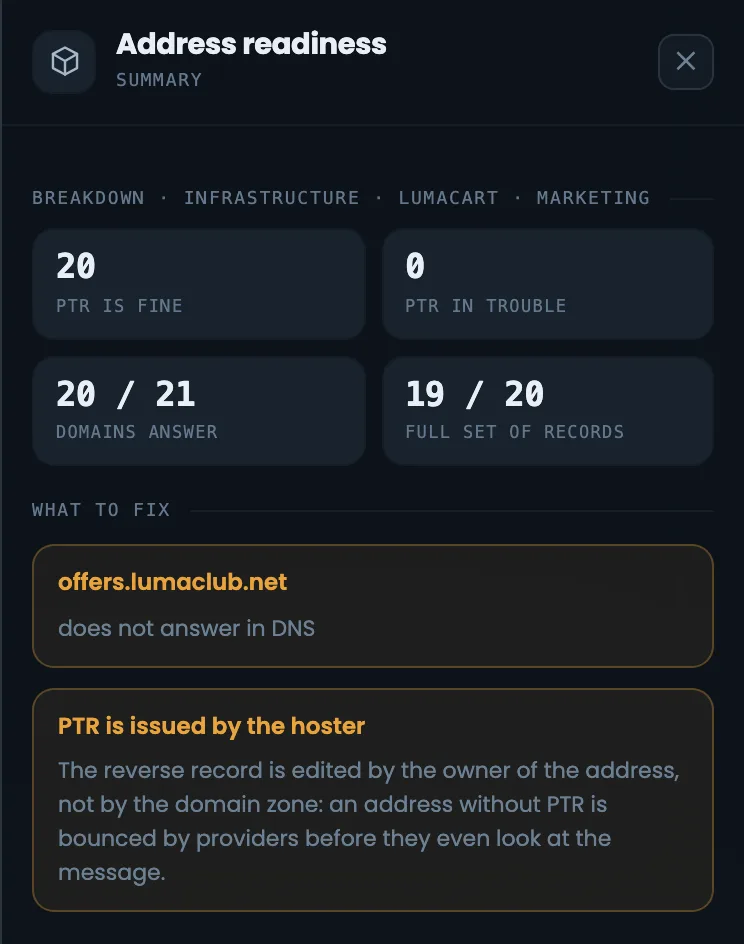
Status brings together the slots, the servers and the readiness notes for addresses and domains. Here there is one problem — a domain does not answer in DNS yet. Clicking it opens the same list in the right panel.
HMTA-Hub
status
Status1 problem
0 criticaldomain not answering
02 / Email sequence
The list funnel and the email sequence by stage.
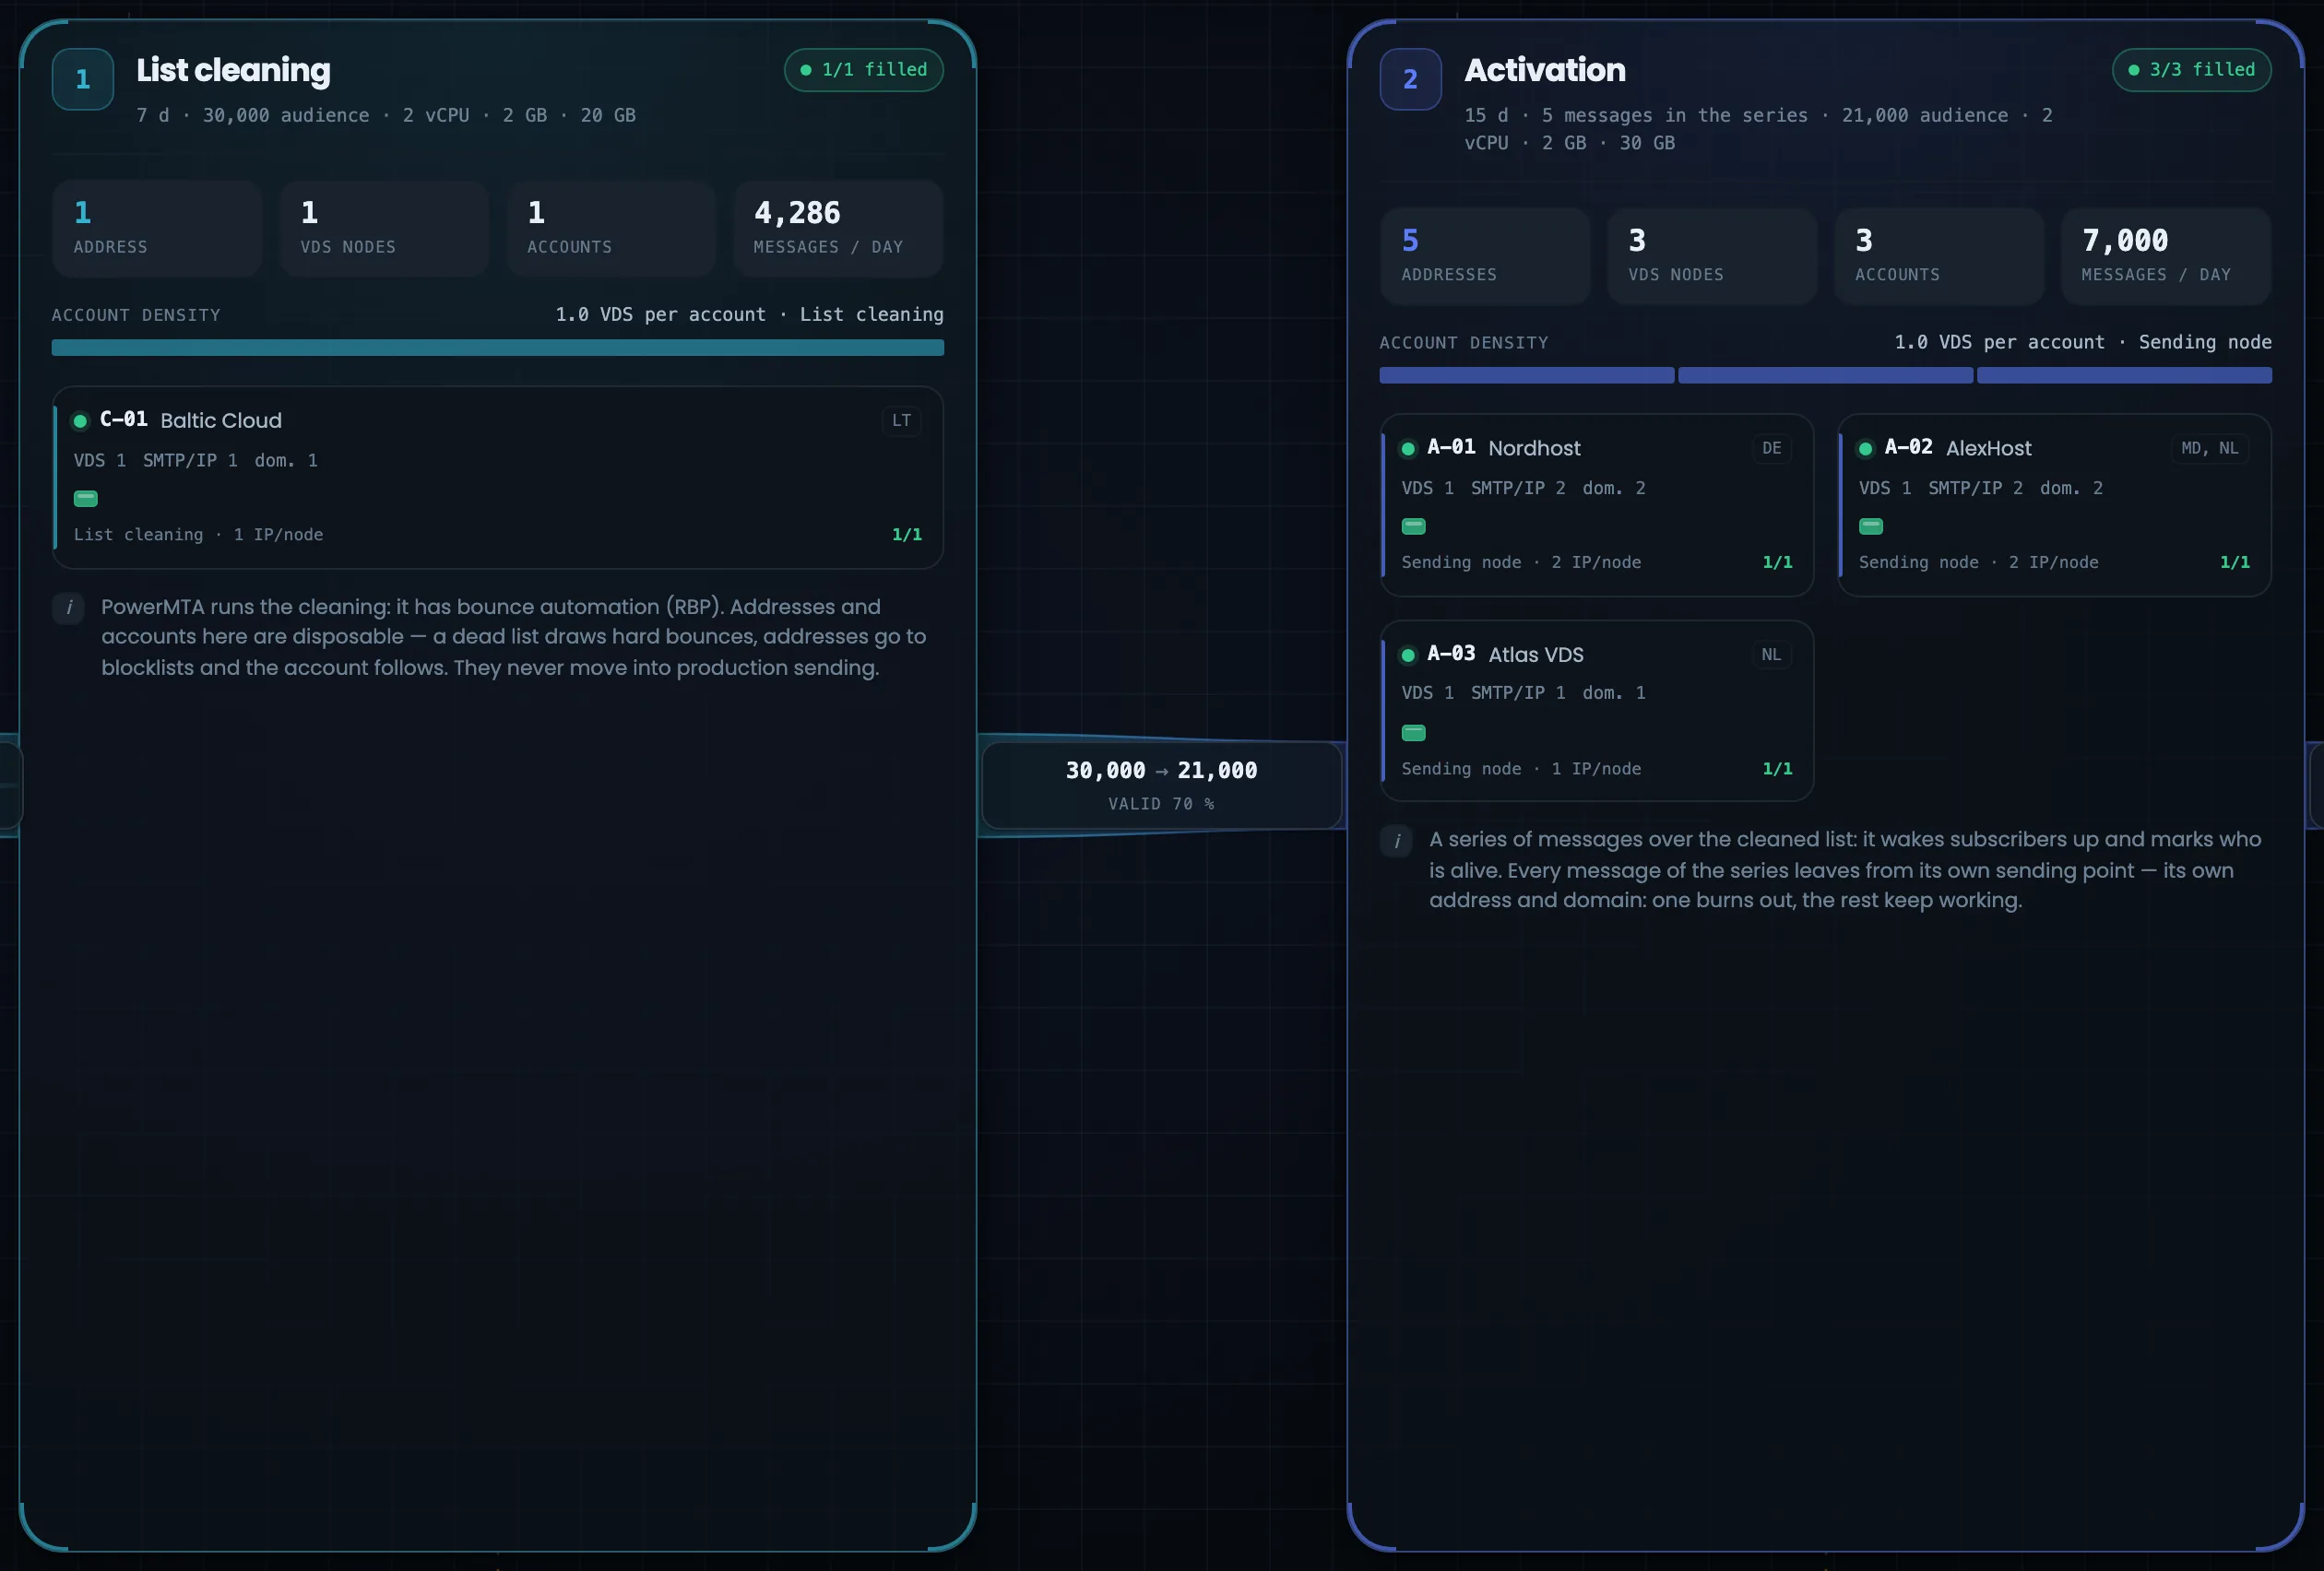
List → cleaning → activation → segmentation → sales series. Between the stages run flow ribbons with the list funnel numbers: the ribbon width shows the volume, the color shows the stage. Everything stands in the order an email travels, and each stage shows its addresses, servers and hosting accounts.
Funnel
01 · List30,000
02 · Cleaning21,000 valid · 70%
03 · Activation5,250 responded · 25%
04 · Segmentation1,050 in segments · 20%
Each stage has its own color — the same as in the specification and on the infrastructure card
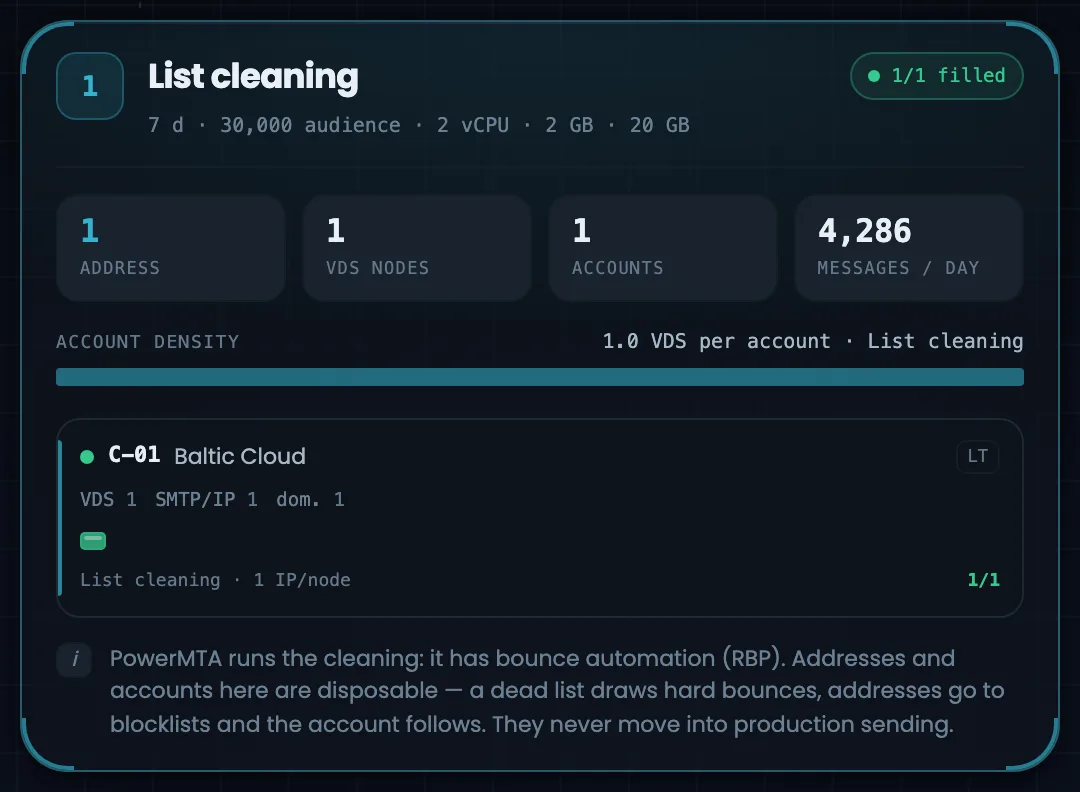
Cleaning
1 address
This stage is disposable: its address works on an old list and ends up on blacklists, so it is never moved into the main sending. Cleaning has its own hosting provider — if that account is blocked, the main sending is not affected.
1Stage
cleaning
List cleaning1 address · 1 account
4,286 a day7 days
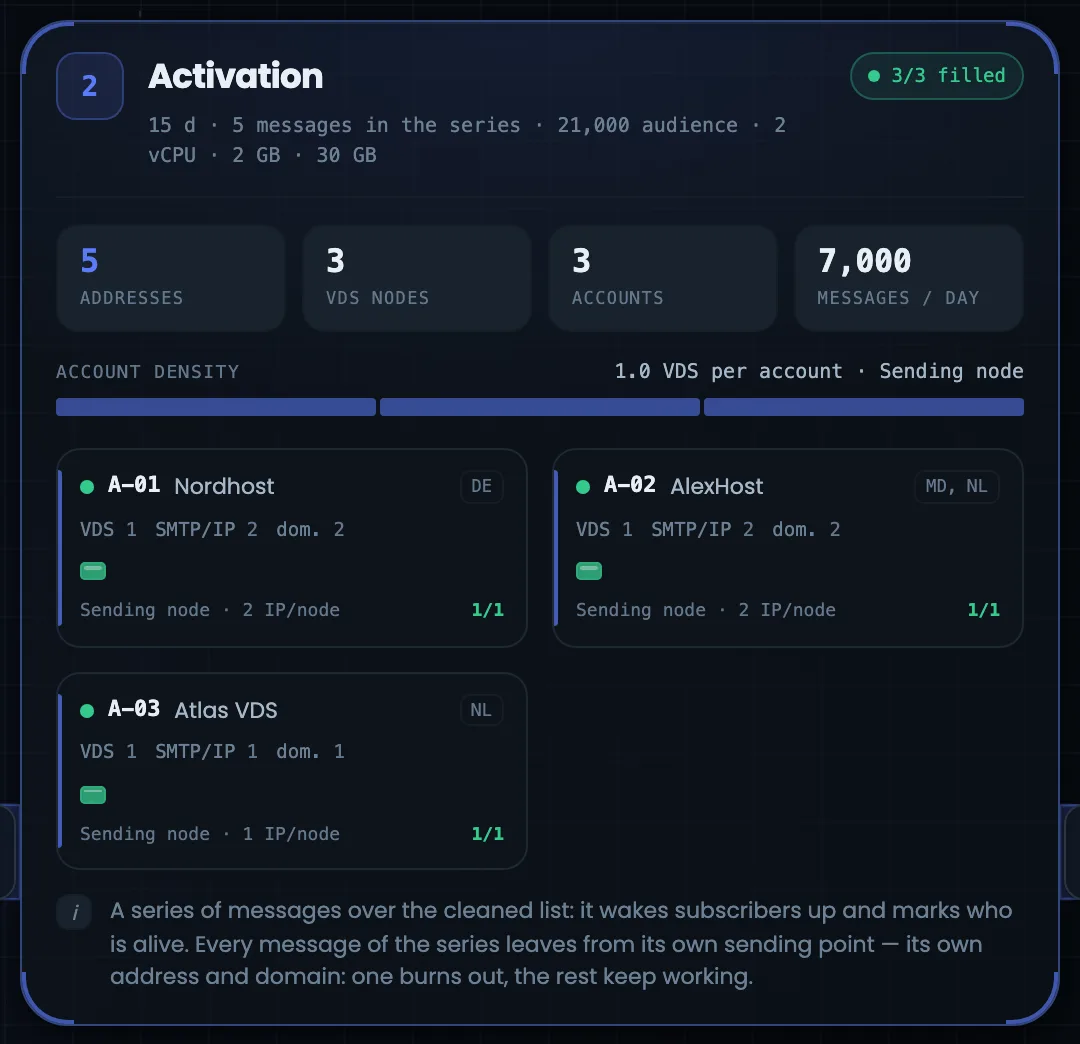
Activation
5 addresses
One address for each email in the series: if one address damages its reputation, the rest keep working. Three accounts at different hosting providers — Nordhost, AlexHost and Atlas VDS.
2Stage
activation
Activation5 addresses · 3 VDS
7,000 a day15 days
A tile on an account card is a slot for a server: green — ready or sending, yellow — assigned but not checked, red — a problem, gray — free.
03 / Result and reasons
How mailbox providers accept your mail — and why.
To the right of the chain — how mailbox providers accept your mail; further right — why exactly: blacklists, reverse DNS, zone records, queues, automatic protection, warm-up. Select a stage or a server, and both columns show data for it alone.
Mailbox providers
Each one separately
Google 97.8%, Microsoft 96.8%; “Other” always comes last. Each provider sets its limit for each address separately.
Blacklists
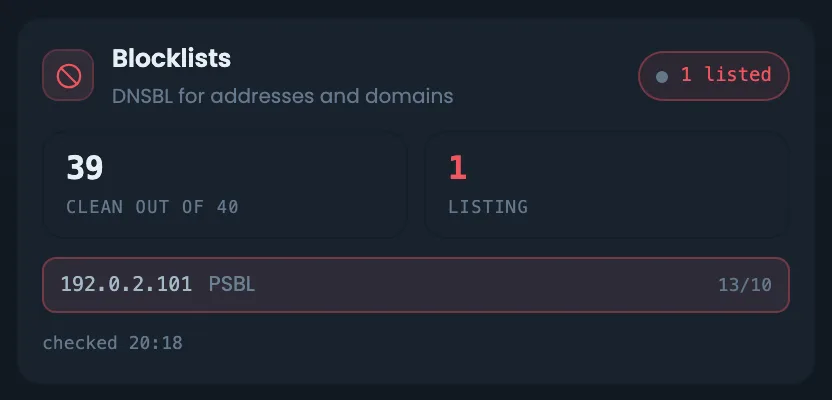
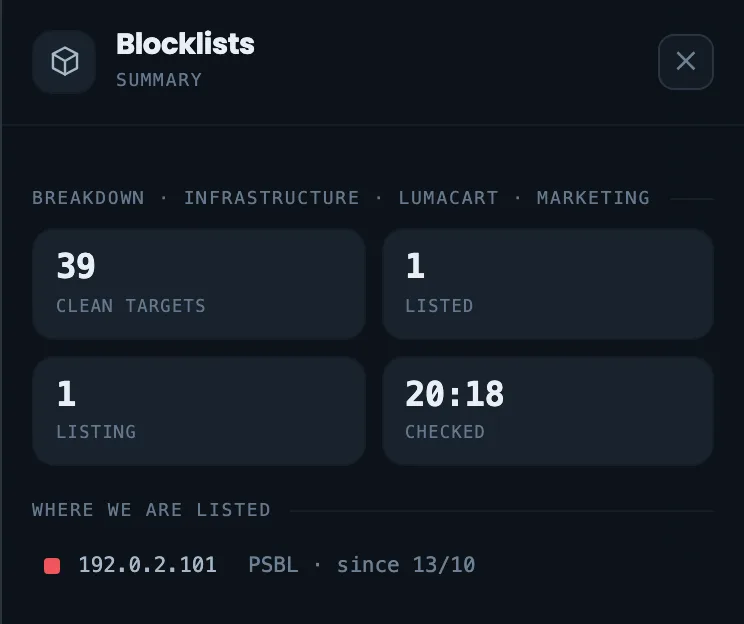
Cleaning address in PSBL
This is exactly what you expect from cleaning — which is why its address is never moved into the main sending.
Reverse DNS
PTR = HELO = A
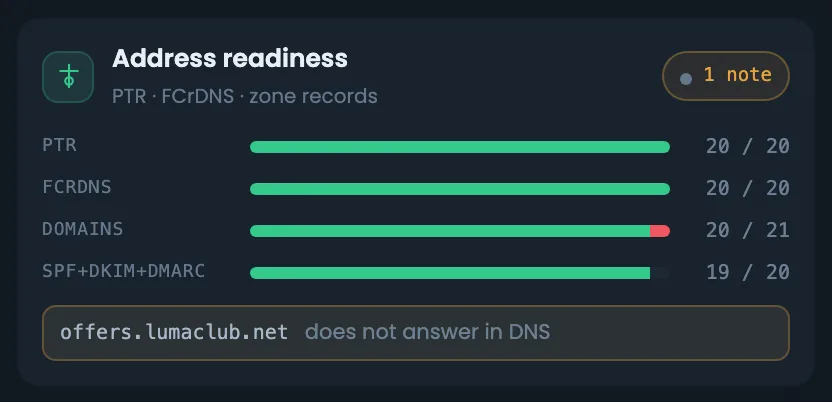
A separate row: PTR is set by the hosting provider, not by whoever manages the zone. If one of the three does not match, it is as if there were no record.
Automation
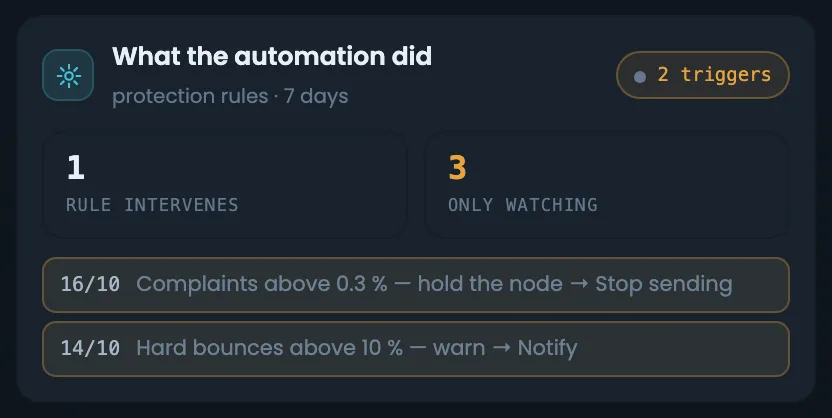
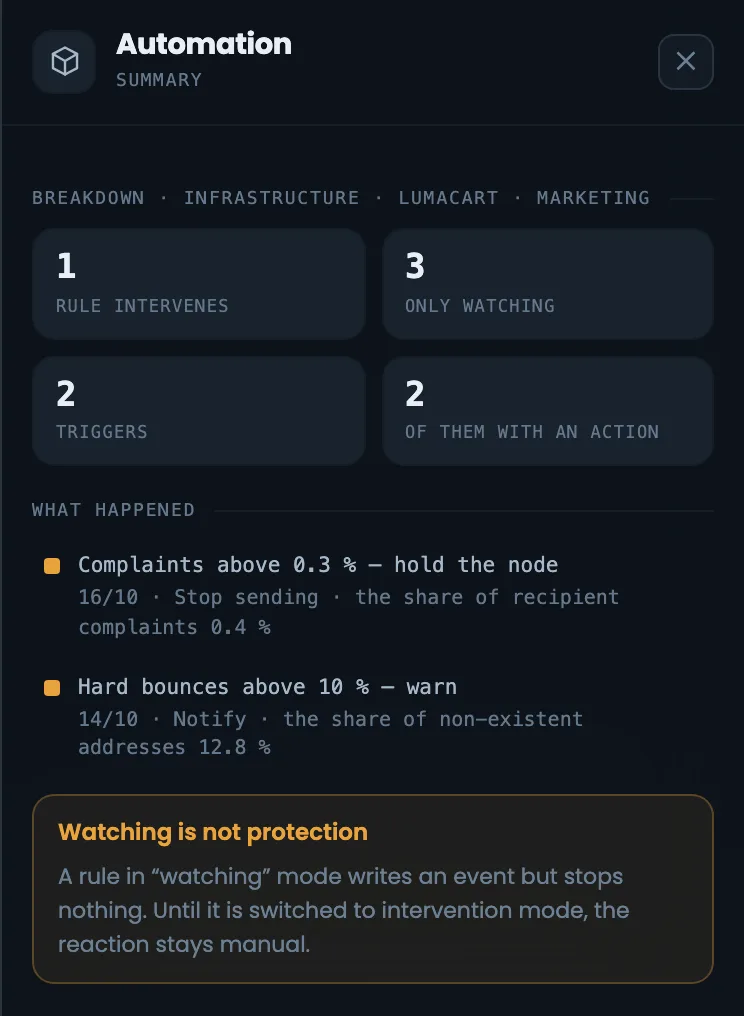
Stepped in or watching
A watching rule only records the event — you cannot mistake it for one that acts.
“Accepted” does not yet mean “in the inbox”: the inbox share is not shown here; a separate seed-address module will provide it.
04 / Working with the diagram
Connecting servers right on the diagram.
Click any block and a panel opens on the right with details and actions: connect a server to a slot, replace it or free the slot. Drag the diagram with the mouse, the wheel changes the zoom, and the smaller the diagram, the fewer details it shows.
Empty slot
Connect a server
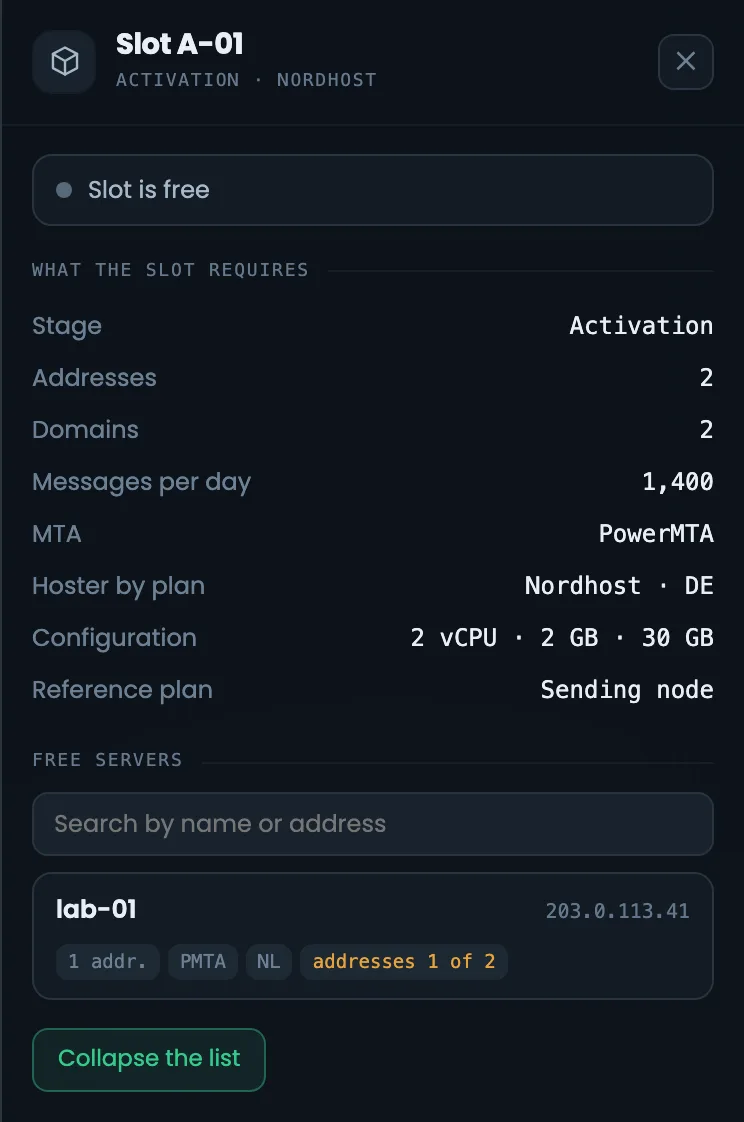
Click a free tile and a list of suitable servers appears on the right, each marked with what it lacks: for example, “addresses 1 of 2”. “Assign free servers” places all free servers into empty slots in one go.
HMTA-Hub
slot
Free slotConnect a server
what is missingAssign free servers
Keys and layers
Full screen
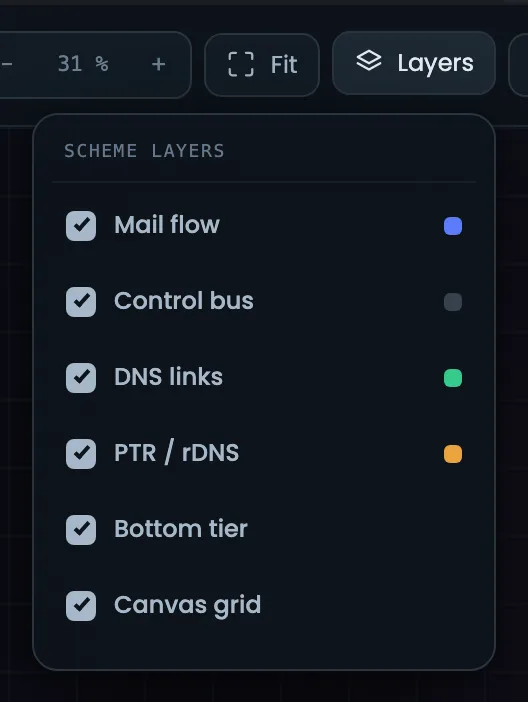
F — fit the diagram, I — panel, 1…4 — go to a stage, + and − — zoom, Esc — clear selection. Flow, control, DNS, reverse DNS and the grid can be hidden as layers. Full screen — for a large monitor or showing it to a client.
KKeys
controls
KeysF · I · 1…4
+ and − zoomEsc
05 / Interface in detail
The infrastructure diagram interface — 24 screens.
The whole canvas, the header and summary, the stages, mailbox providers and reputation, the bottom rows and the right panel for each object. Above each screenshot: why the screen matters. Below it: what it shows.
Diagram canvas
4 screens
First — the whole infrastructure diagram: how it looks in the panel and in full screen. Then the header with the build name, totals and tools, the six-cell summary and the left column — the core, the profile and limits, the source list and the mailing client. These screens answer what this infrastructure is and whether everything is fine with it.
01
The whole diagram
In the panel and in full screen
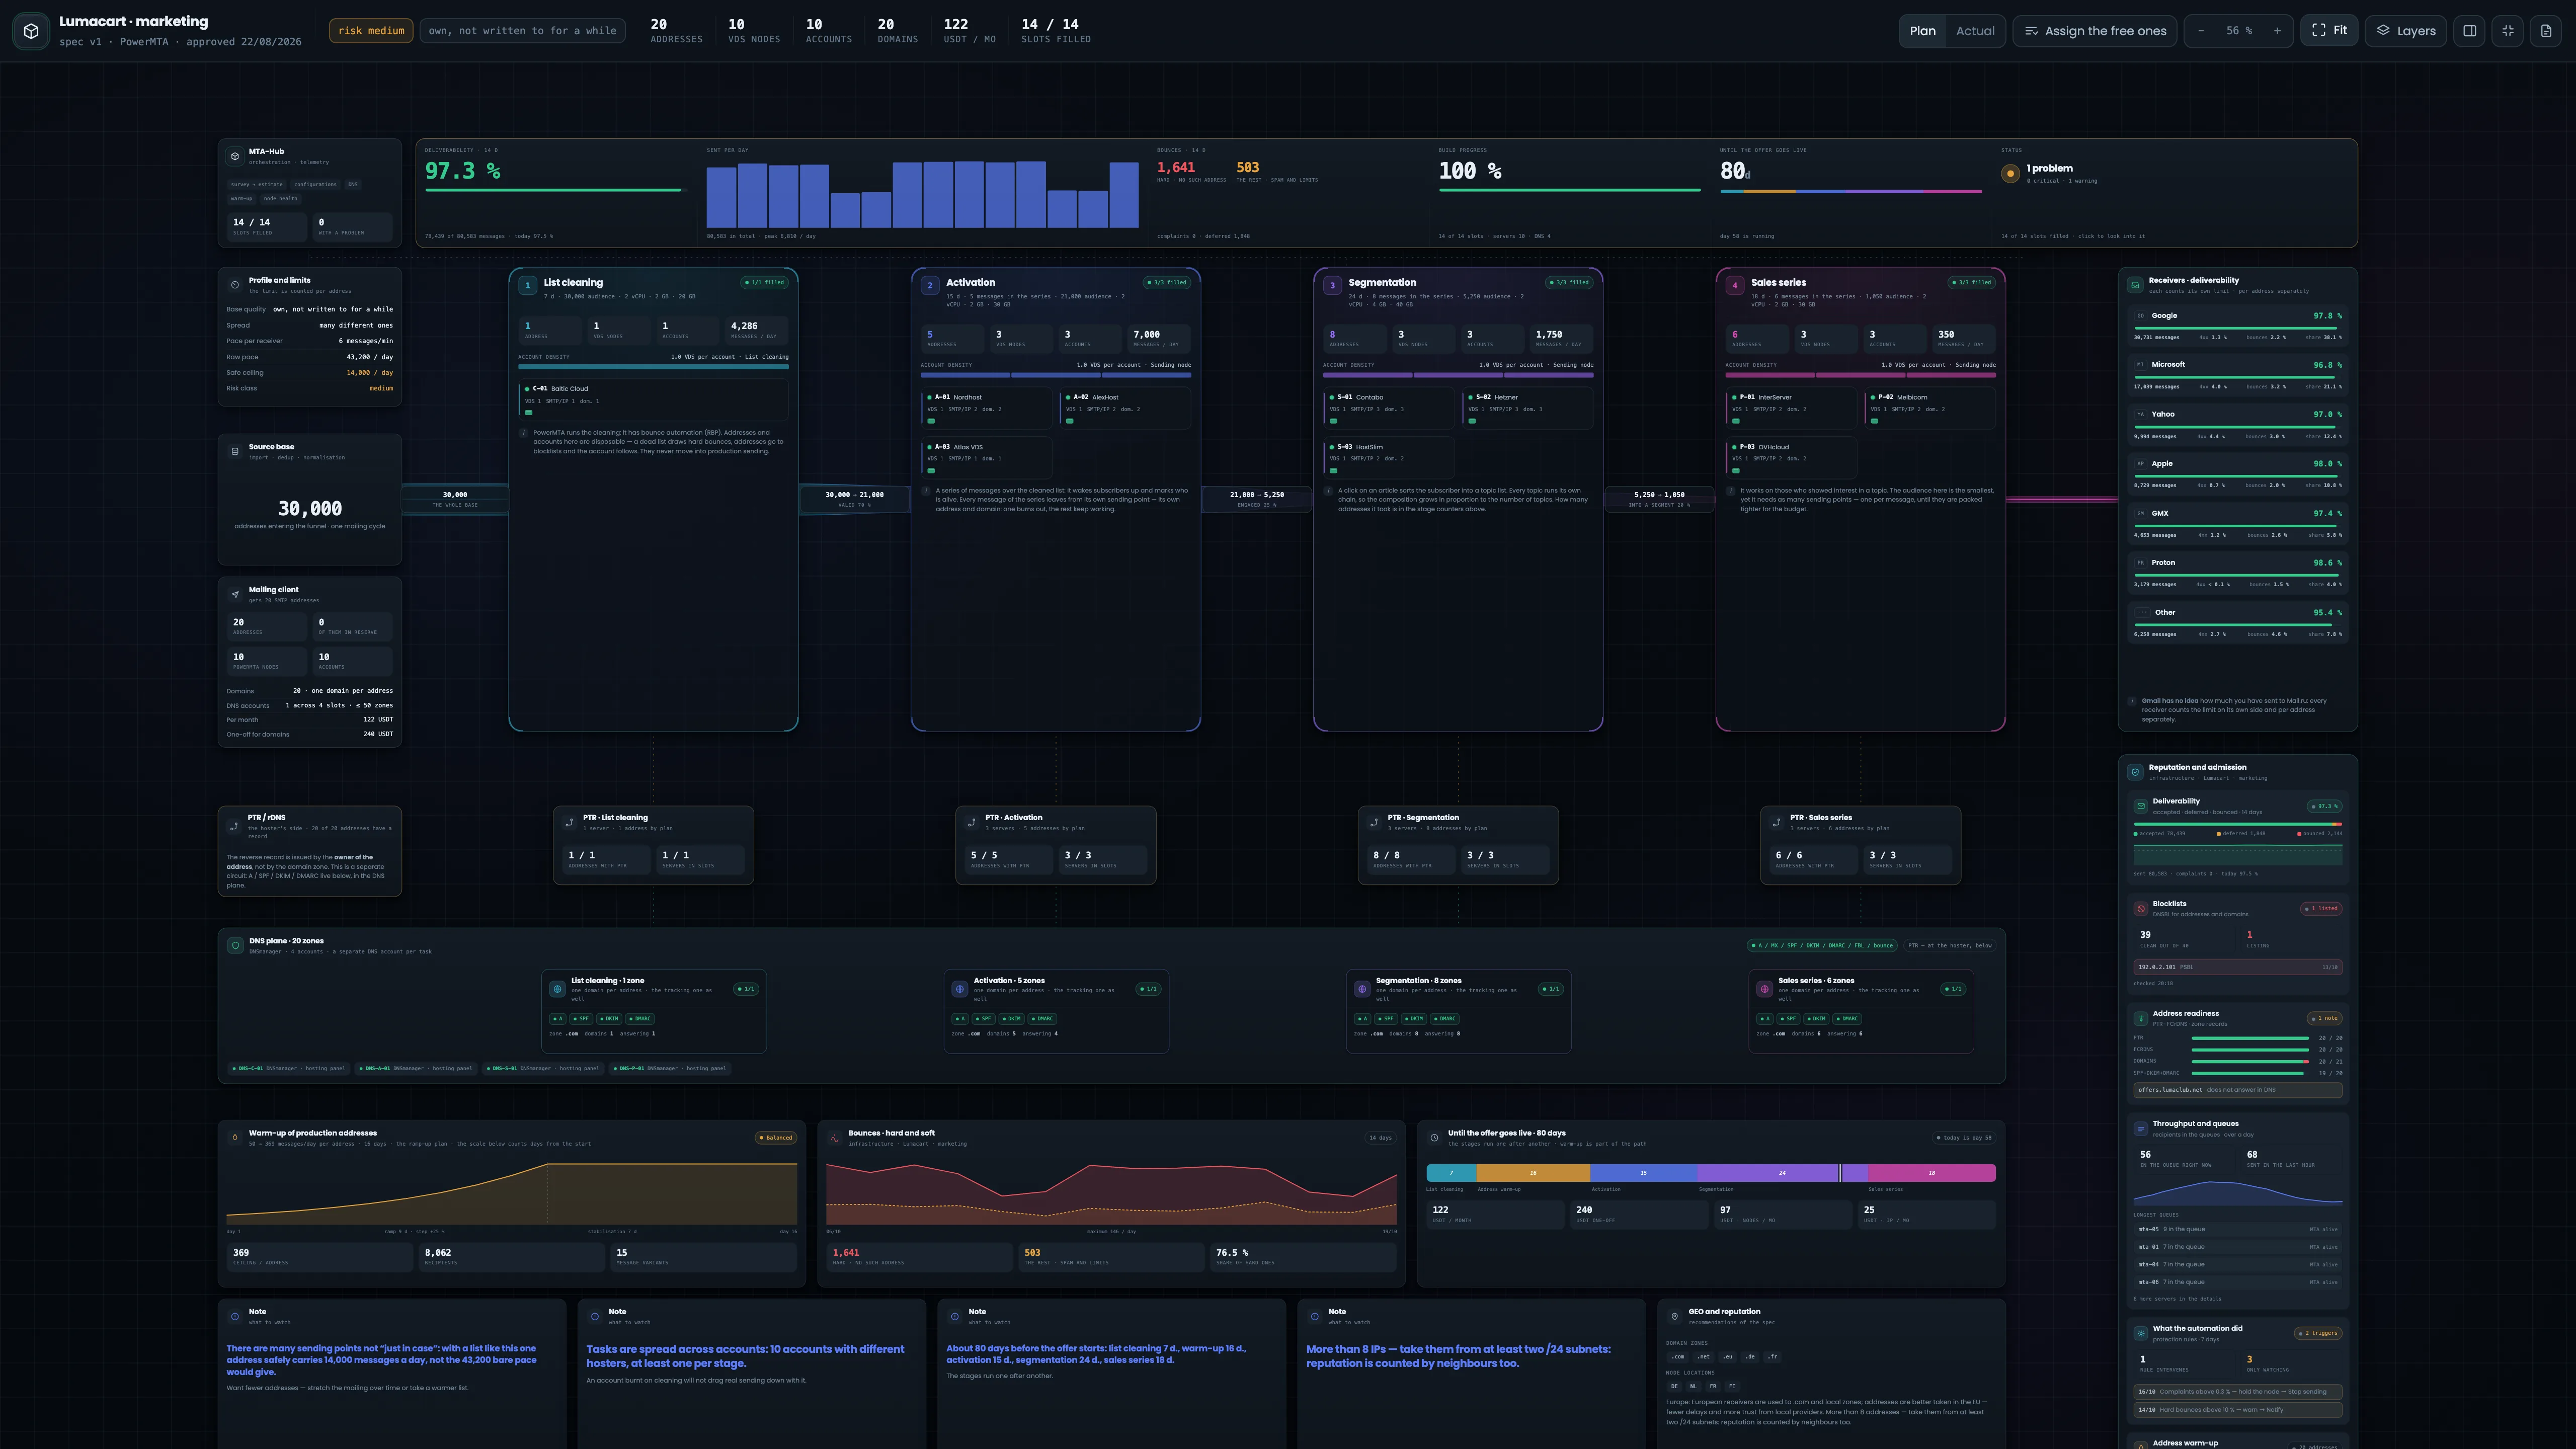
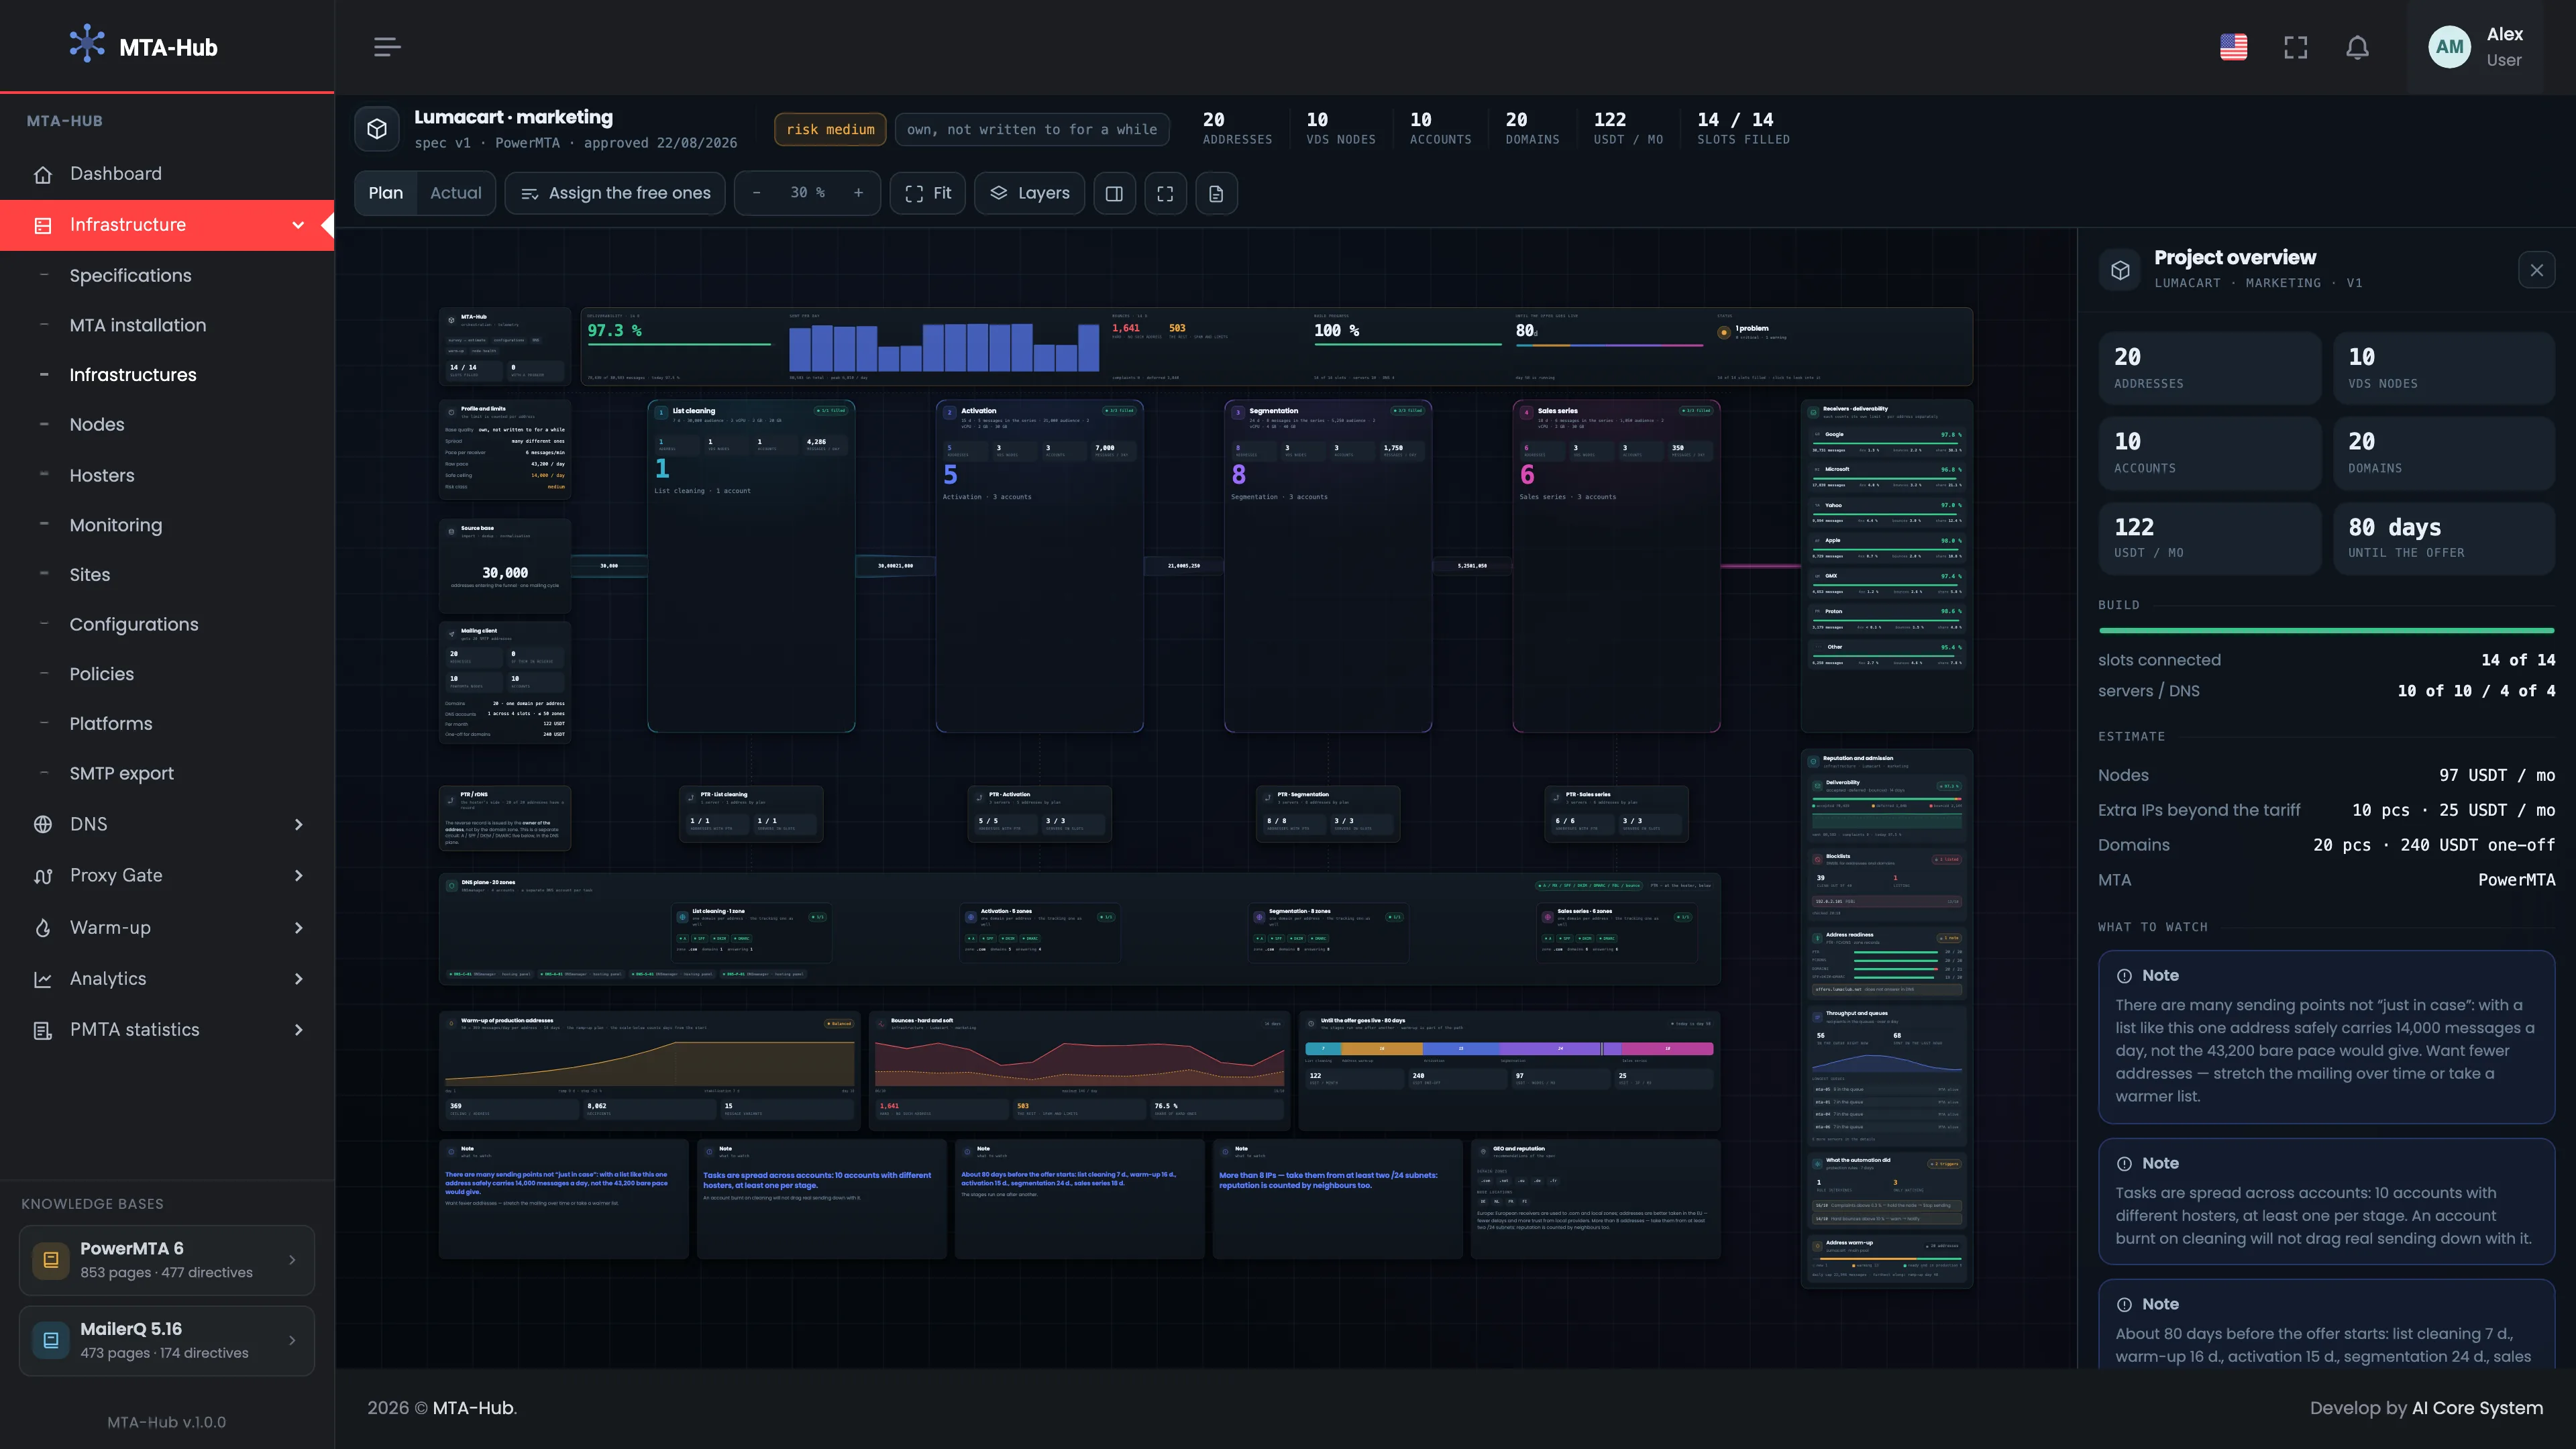
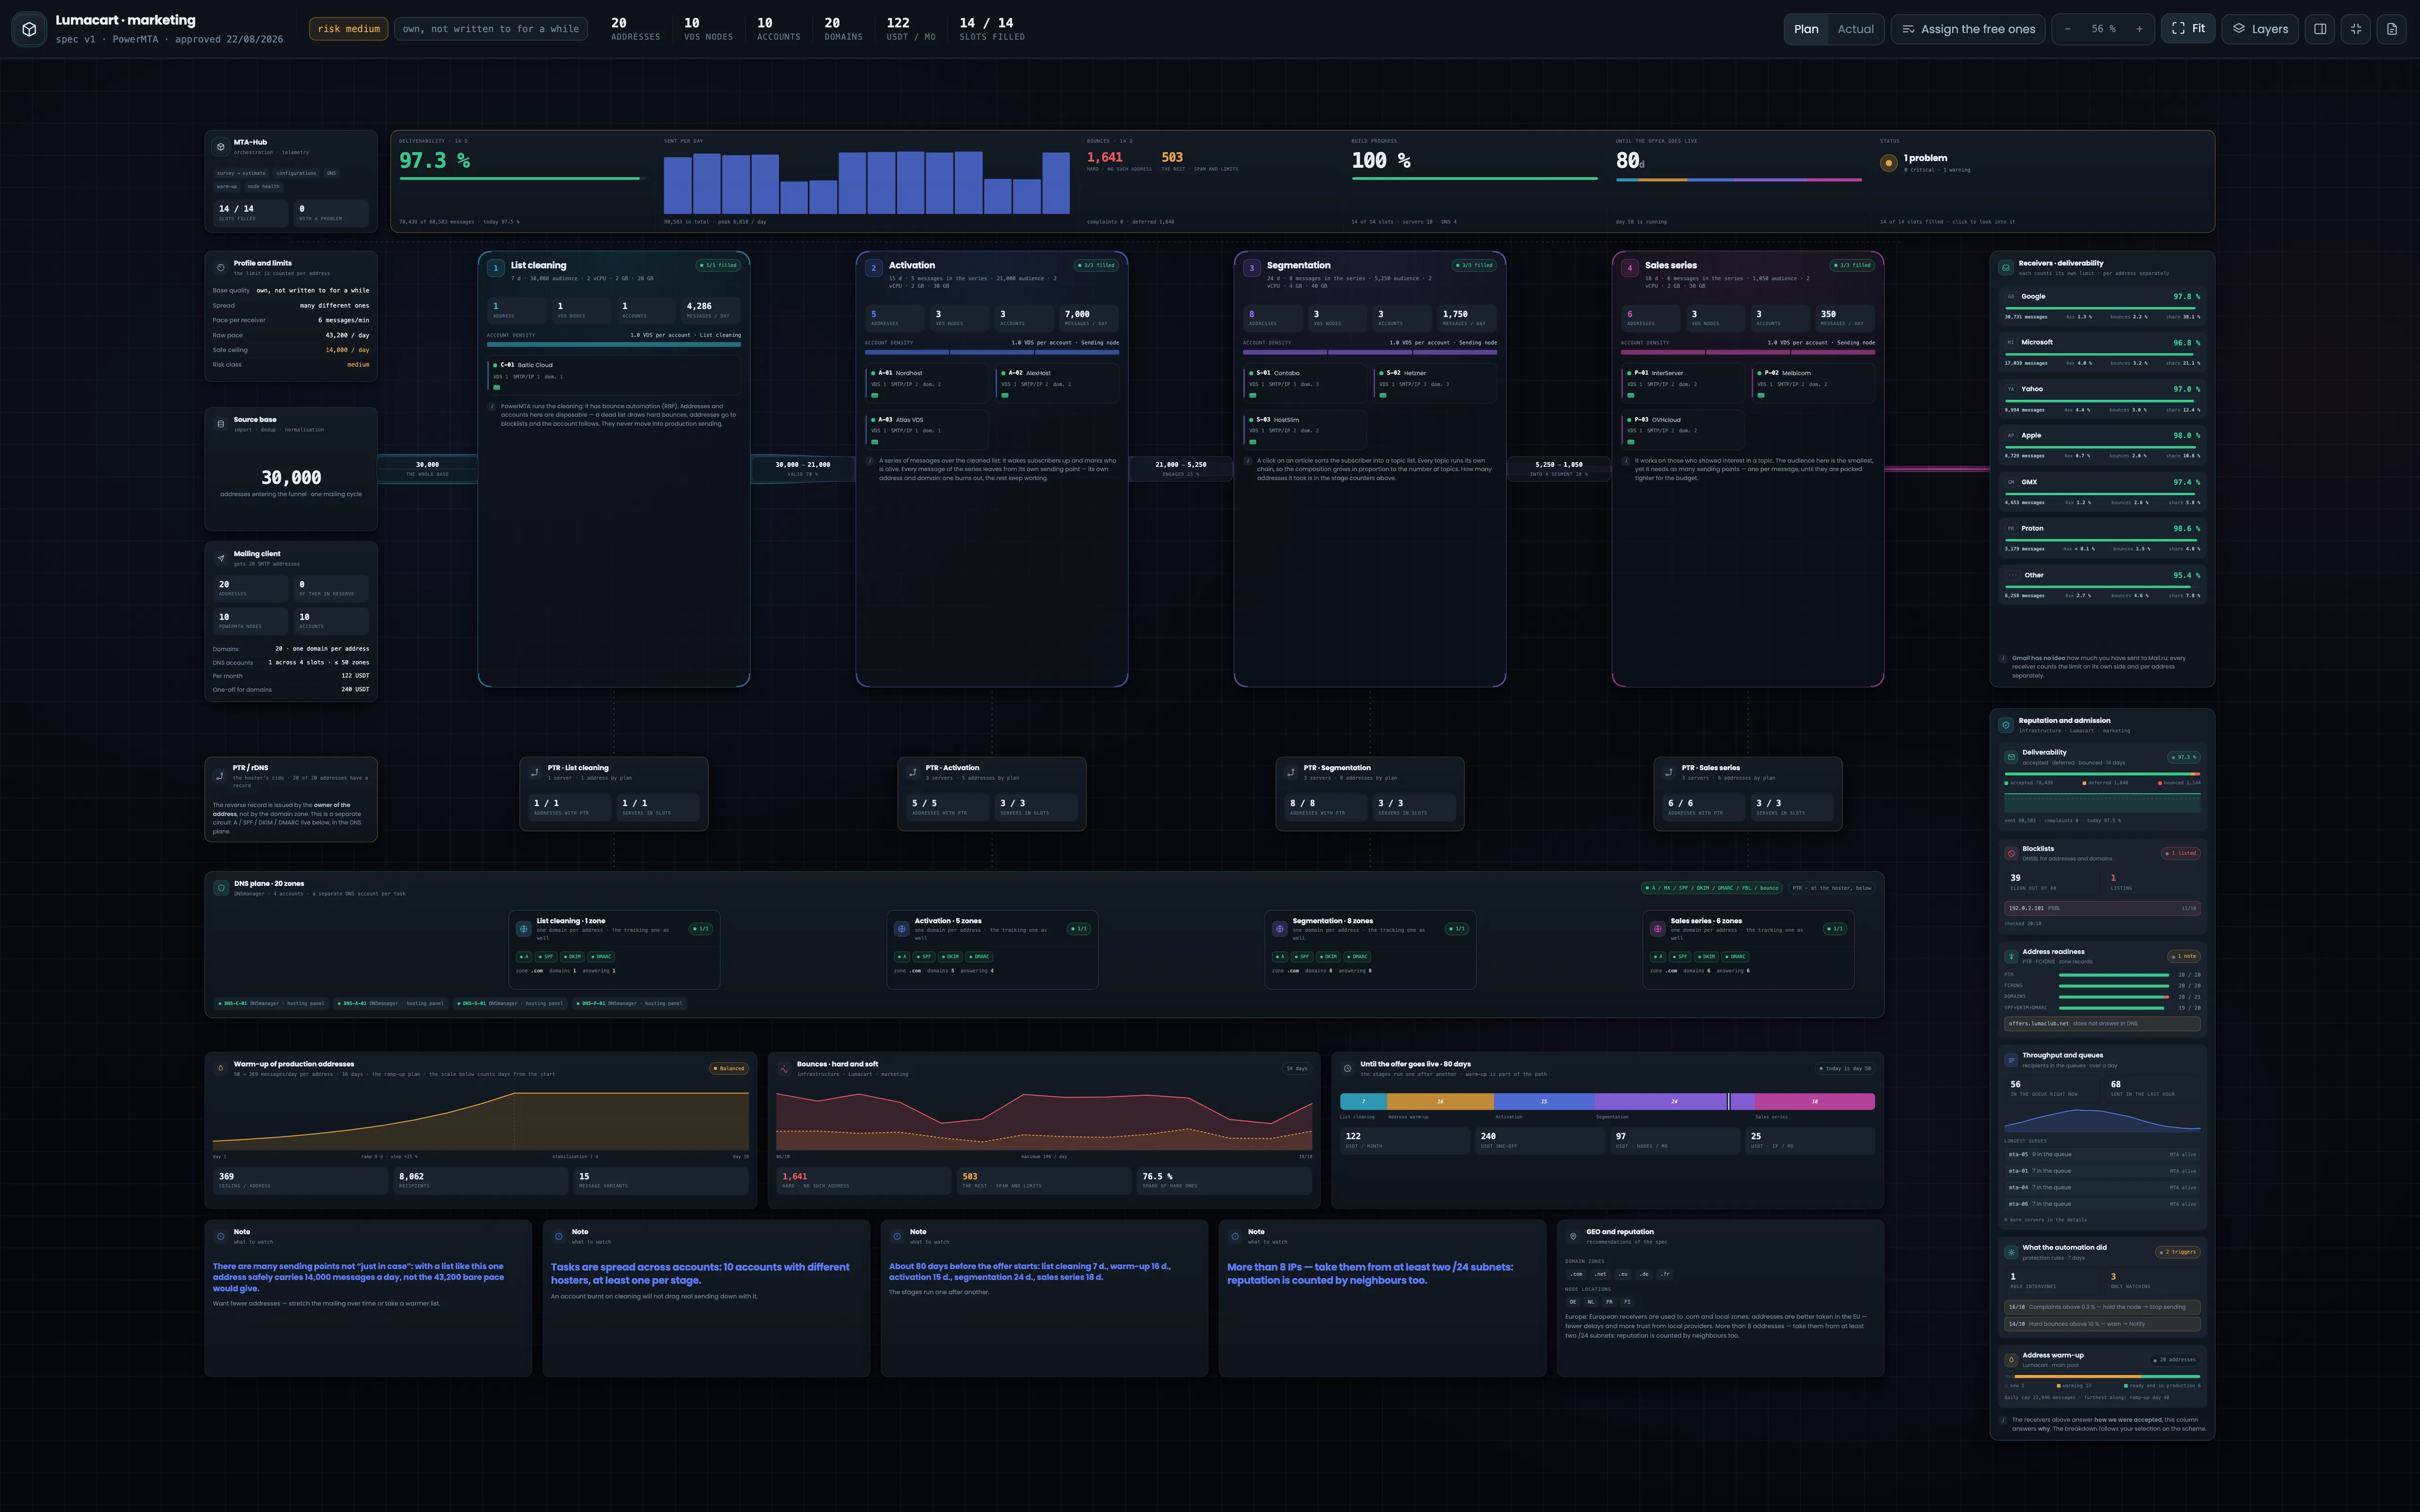
This is how the infrastructure diagram looks when it opens: the panel around it, the diagram fitted next to the right panel, which shows the project overview. The second screenshot is in full screen and without the panel, for a large monitor or showing it to a client. Even from afar the stages show large address counts, so the proportions between stages are clear at once. At the top — the summary; on the left — the list and limits; in the center — the chain of stages; on the right — mailbox providers and reputation; at the bottom — PTR, DNS and the bottom row. Open the diagram when you need to see one infrastructure as a whole: what is planned, what is built and how it works. Start with the summary at the top, then click the block you need — details open on the right.
EnlargeEnlargeScreen 01 · The whole diagram. An example from the MTA-Hub interface.
From afar — the stages show large address counts: 1 on cleaning, 5 on activation, 8 on segmentation, 6 on the sales series.
Layout — summary at the top, list and limits on the left, stages in the center, mailbox providers and reputation on the right, PTR, DNS and the bottom row below.
The proportions between stages are clear at once, even before the numbers.
02
Header
What this build is and what you can control
The diagram header tells you what this build is and what you can control; four screenshots — its four parts. The name gives the infrastructure, the specification version, the MTA and the approval date, and the tags show the risk level and list quality from the specification questionnaire. The totals count addresses, servers, accounts, domains, costs and filled slots, and the “Plan · Actual” switch takes them from the estimate or from the connected servers. On the right — tools for working with the canvas. Switch “Plan · Actual” to compare the estimate with what is really in place: the difference in the totals shows at once how many addresses, servers or domains are still missing.
If the setup has been cut back to fit the budget, a red tag appears here: emails share one address.
03
Summary
Is everything in order
The six-cell summary is a quick answer to whether everything is in order with the infrastructure. The cells go from result to build: deliverability, sending per day, bounces, build progress, time to the offer and status. Here the build is 100% ready, and there is one problem — a domain does not answer in DNS yet. Each cell opens its own detailed breakdown in the right panel, so you are one click from a number to its cause. Start with the summary every time you open the diagram: if “Status” shows a problem, click the cell and fix it before dealing with anything else.
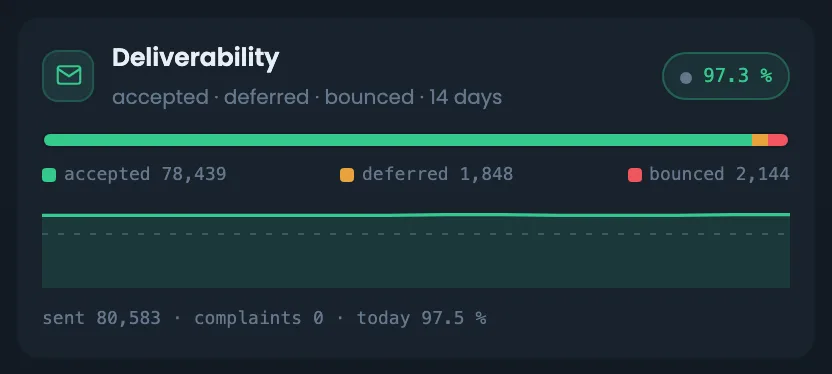
Deliverability over 14 days — 97.3% — 78,439 of 80,583, today 97.5%.
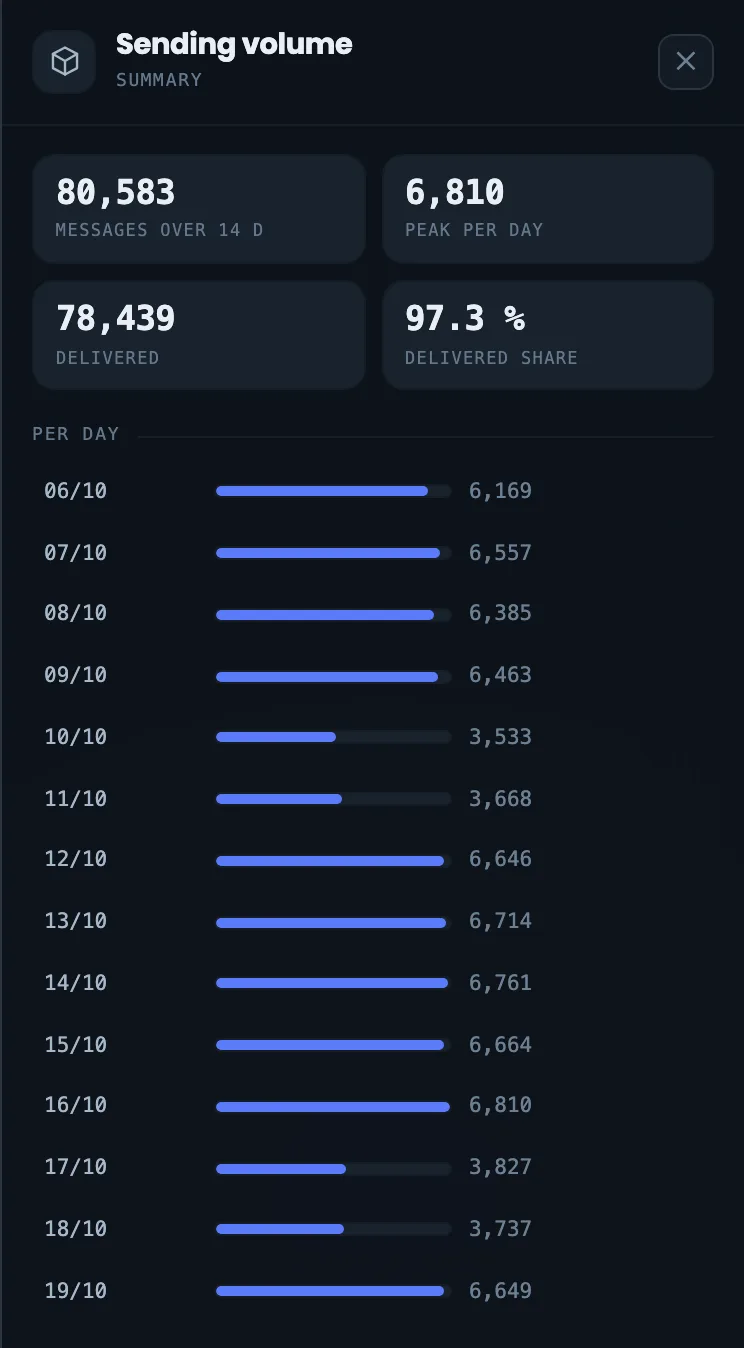
Sent per day — 80,583 in total, peak 6,810 a day.
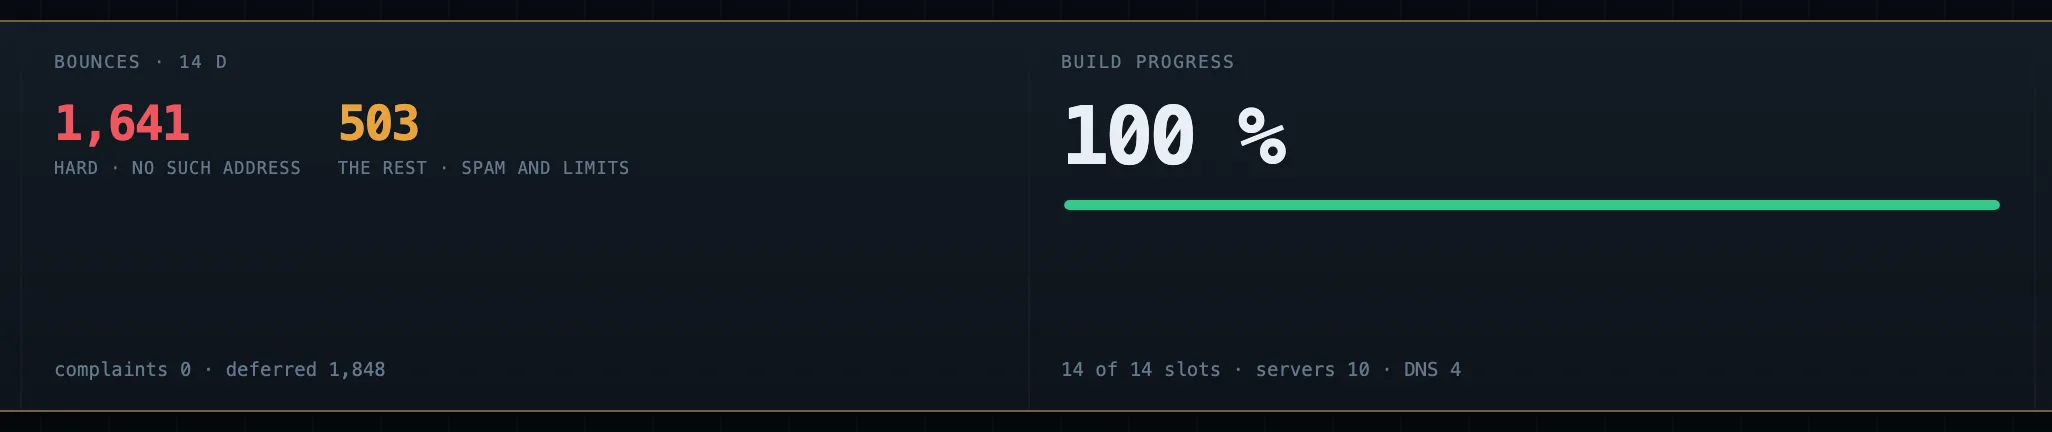
Bounces — 1,641 hard and 503 others.
Build progress — 100%.
Until the offer — 80 days.
Status — 1 problem.
Deferred emails (4xx) are not part of deliverability.
04
Left column
Core, profile, list, client
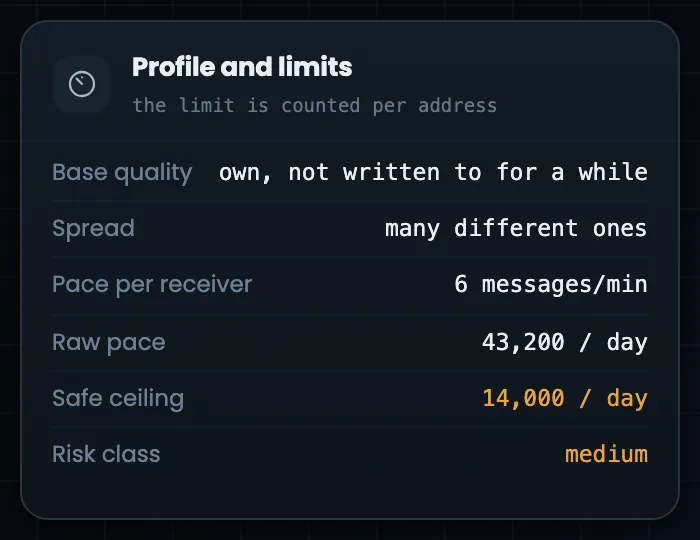
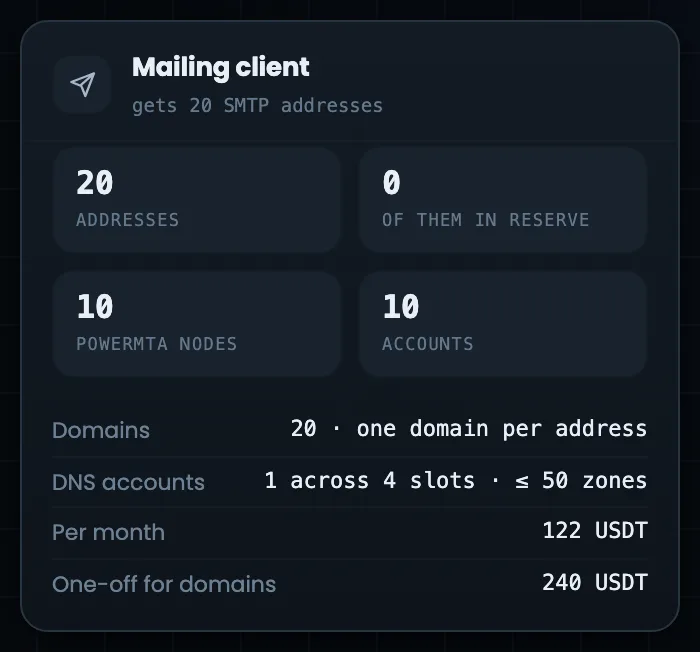
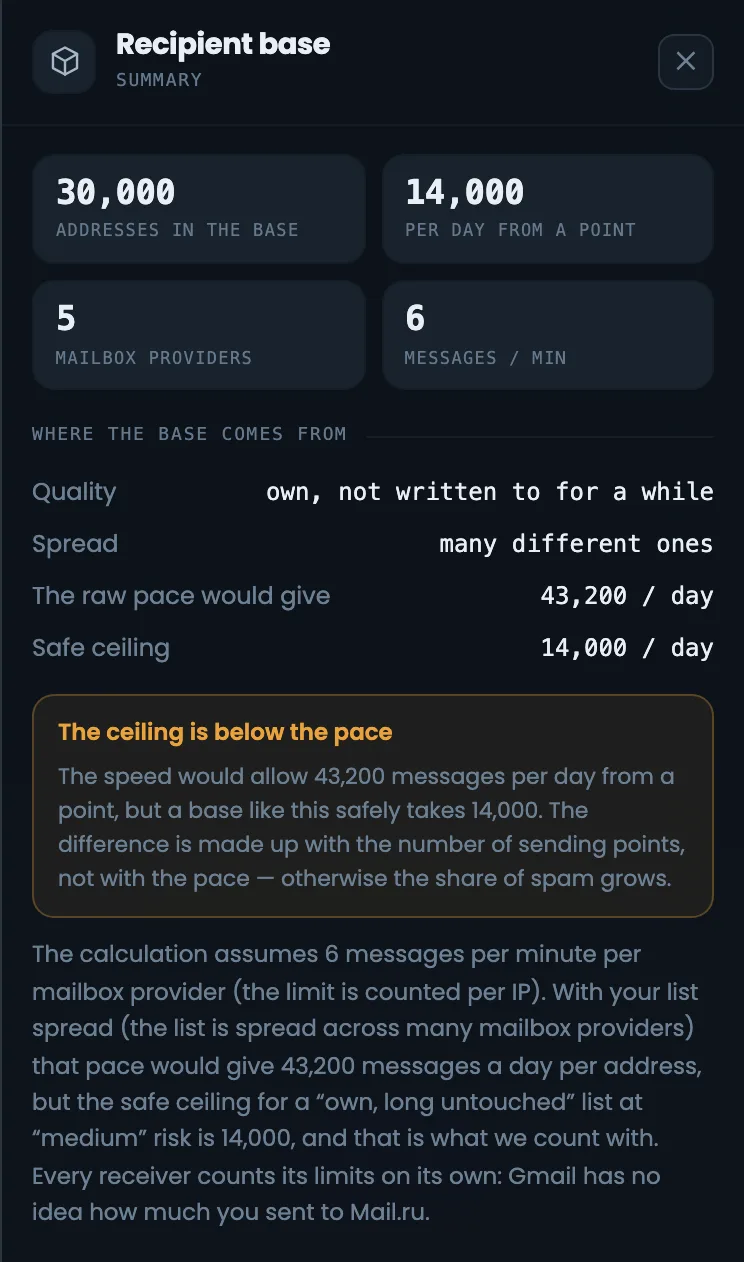
The left column shows what the whole estimate rests on. The MTA-Hub block is the control center and the number of filled slots. “Profile and limits” shows the list quality, the speed per mailbox provider and two limits per address: the maximum speed and the safe limit for a list like this, which the estimate uses. Below — the source list at the top of the funnel, and what your email platform gets: SMTP addresses, servers and accounts. The column shows where the number of addresses in the plan came from. Look here when a client asks why there are so many addresses: with a list like this one address can safely send 14,000 emails a day, not 43,200.
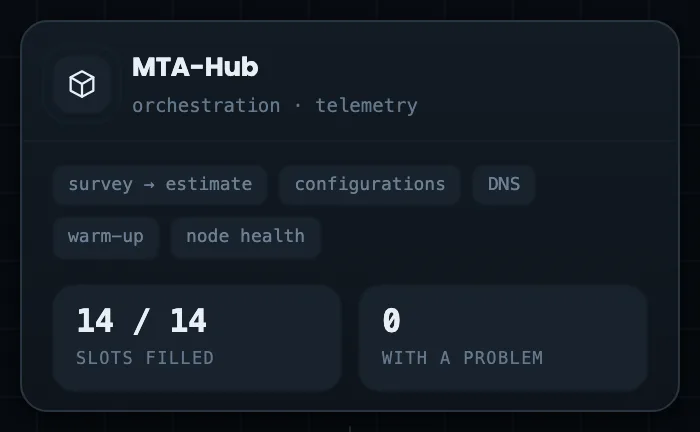
MTA-Hub — the control center; 14 of 14 slots filled.
Profile and limits — 6 emails a minute per address, maximum 43,200, safe — 14,000 a day.
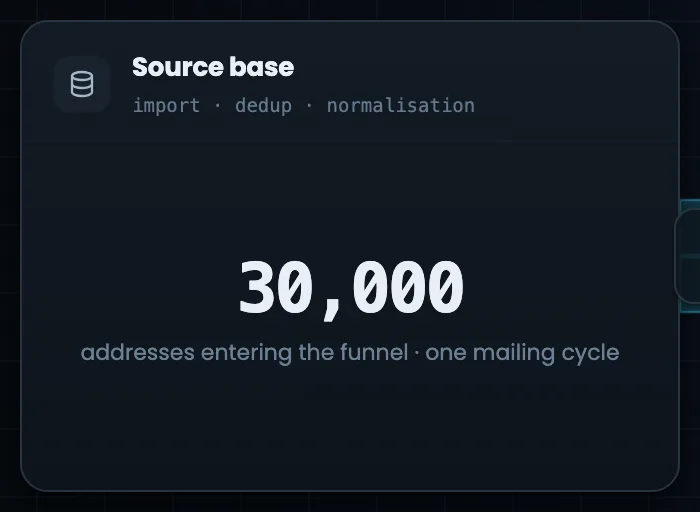
Source list — 30,000 addresses, one cycle.
Mailing client — 20 SMTP addresses on 10 servers in 10 accounts.
The estimate uses the safe limit, not the maximum speed.
Stages and providers
4 screens
In the center — the email sequence: stages with funnel ribbons, stage blocks with hosting accounts and slot tiles. On the right — the mailbox providers that accept your mail, and six reputation and admission blocks that explain why acceptance is the way it is. Select a stage or a server, and the right-hand columns show data for it alone.
05
Chain of stages
Flow ribbons between stages
The chain of stages is the heart of the diagram: from left to right runs the path of an email from the list to the sales series. Between the stages stretch flow ribbons with the list funnel numbers: how many addresses moved on and what share of the previous step that is. The ribbon width shows the volume, the color shows the stage. The ribbons show at once how many recipients drop out at each step and how far the list shrinks by the sales series. If the share at some step is much lower than expected, select that stage on the diagram and look at its bounces and mailbox providers. The ribbons also help when talking to a client: the path from 30,000 addresses to segments is visible without tables.
EnlargeScreen 05 · Chain of stages. An example from the MTA-Hub interface.
From cleaning to activation — 21,000 valid out of 30,000 — 70%.
Next — 5,250 responded — 25%, 1,050 in segments — 20%.
Width and color — volume and stage.
The stage color is the same as in the specification and on the infrastructure card.
06
Stage block
What it does, what it is built from, whether everything is in place
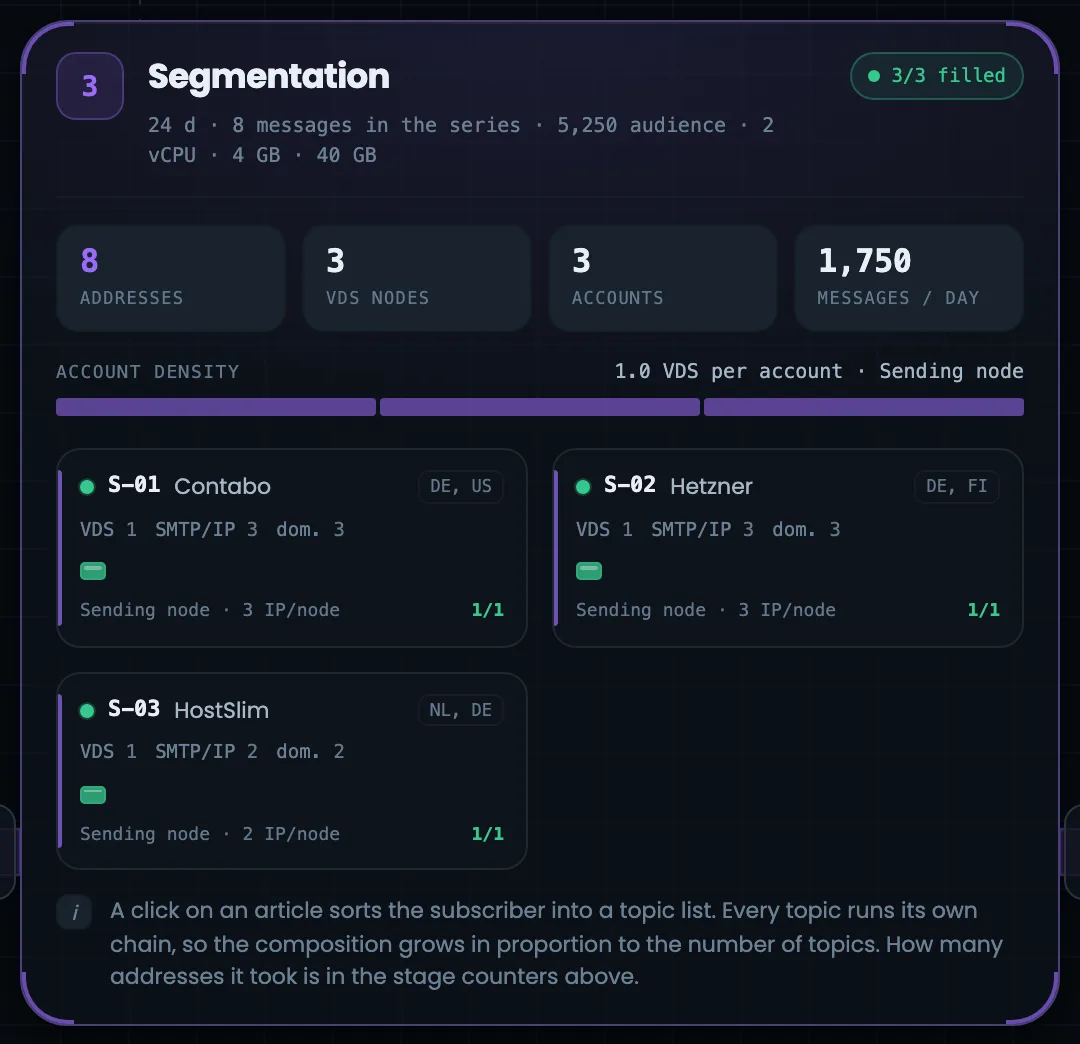
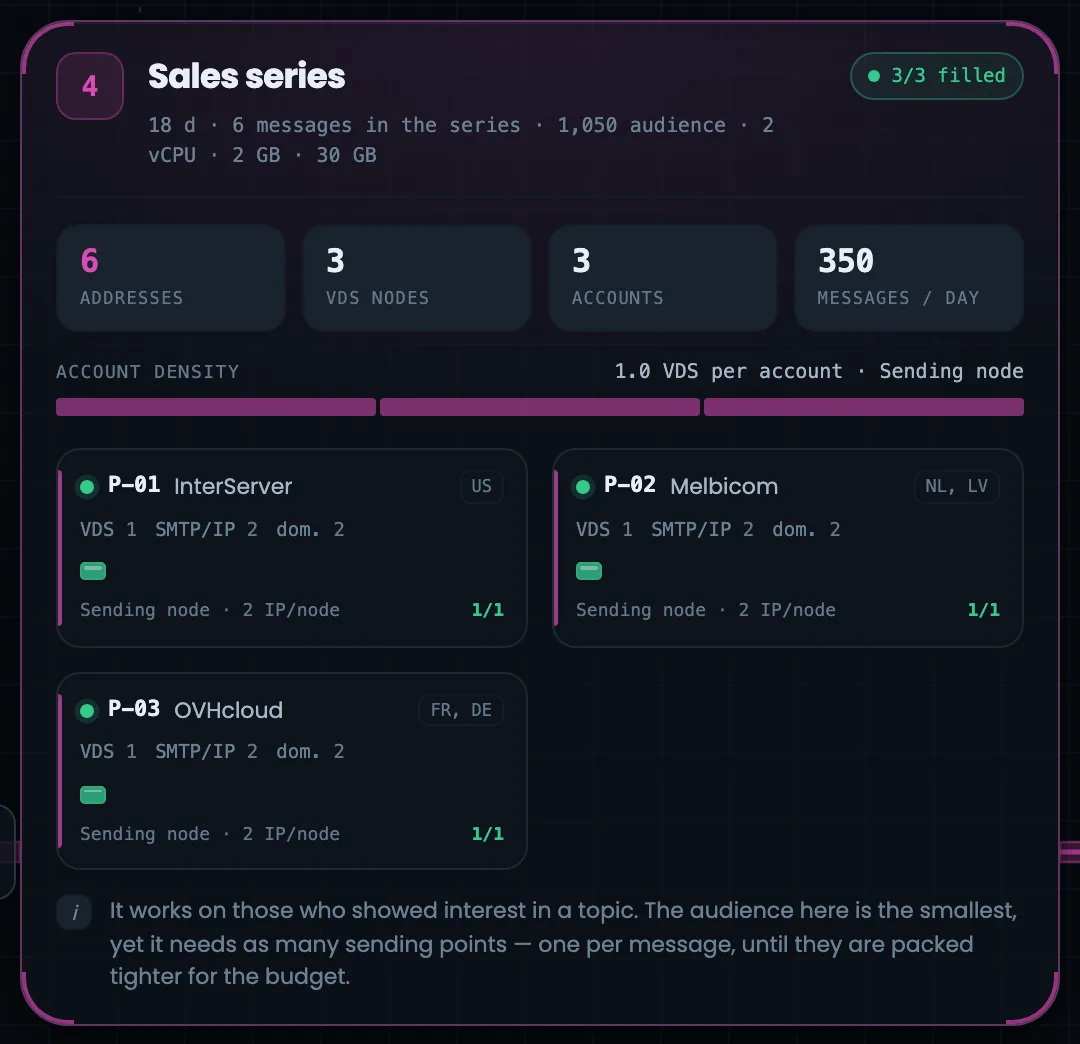
A stage block answers three questions: what the stage does, what it is built from and whether everything is in place; four screenshots — the four stages of the chain. Account cards show the hosting provider, the country and the server slot tiles: green — ready or sending, yellow — assigned but not checked, red — a problem, gray — free. Cleaning has one address and one account — the stage is disposable; activation has five addresses, one for each email in the series. Click a tile and the slot opens on the right. Watch the “3/3 filled” line in the block header: if fewer slots are filled, this is the stage to complete first.
Header — number, name, “3/3 filled”, duration, emails in the series, audience, configuration.
Counters — addresses, servers, accounts, emails a day.
Account density — how many servers sit in one account.
Account cards — code, hosting provider and country, slot tiles.
Note — why the stage is needed, in words.
The hosting providers differ on purpose: blocking one account does not stop the others.
07
Mailbox providers
How your mail is accepted
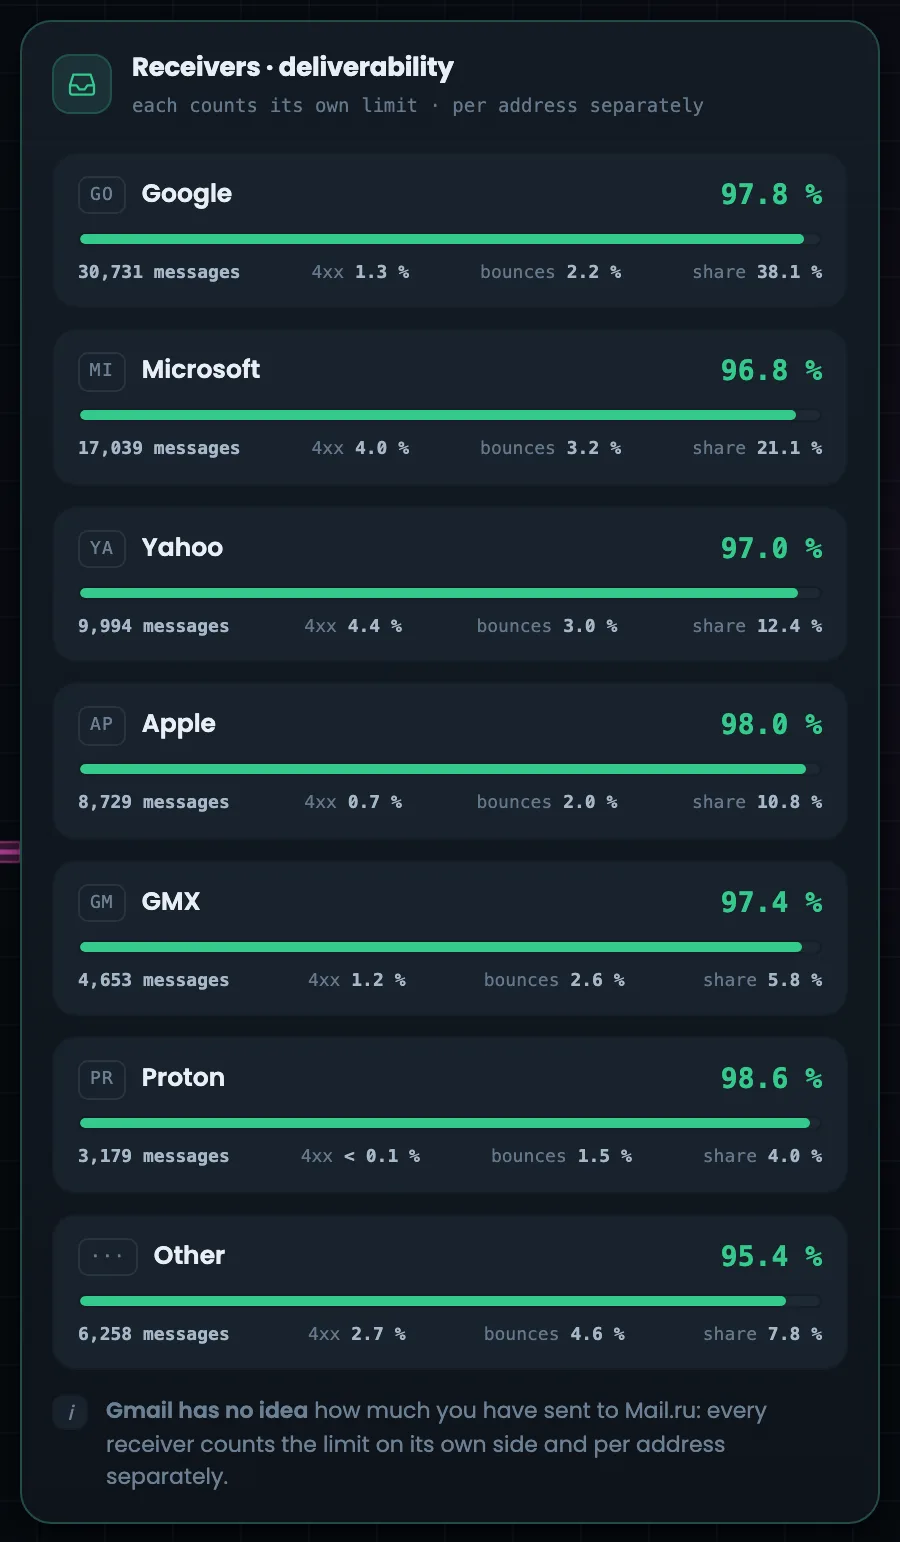
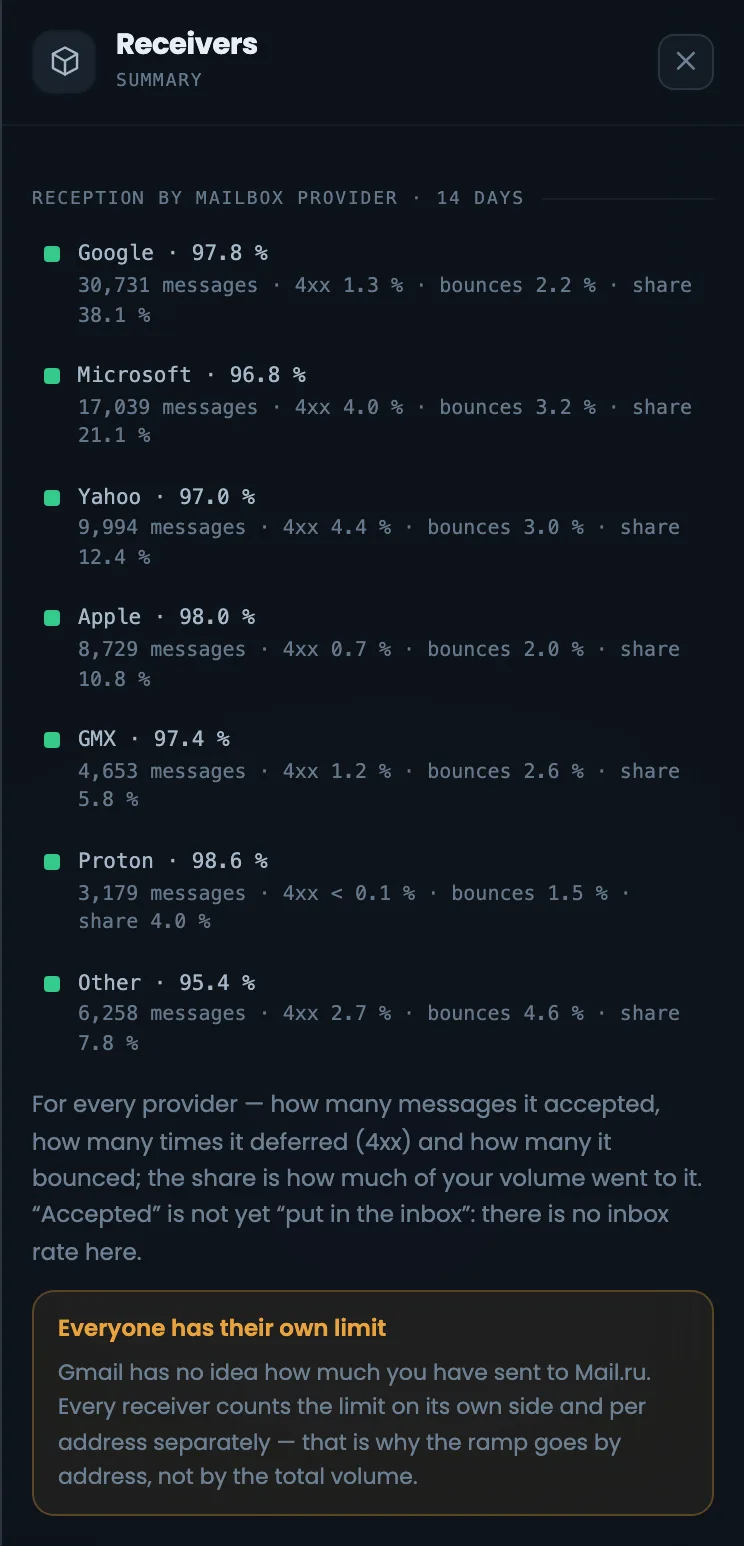
The mailbox providers column shows how Google, Microsoft, Yahoo, Apple, GMX, Proton and the rest accept your emails. In large type — the accepted share; below — how many emails went to the provider, the share deferred, bounced, and the provider’s weight in your volume; “Other” always comes last. If one provider accepts noticeably less of your mail, that is the one to look into. Keep in mind: “accepted” does not yet mean “in the inbox” — the inbox share is not shown here. Watch the deferred share: if it grows for a provider, it is already holding mail back, and it is worth checking the queues in the reputation column.
EnlargeScreen 07 · Mailbox providers. An example from the MTA-Hub interface.
Large type — the accepted share: Google 97.8%, Microsoft 96.8%, Yahoo 97.0%, Apple 98.0%.
Below — emails, deferred share, bounces and the provider’s share of the volume.
Each mailbox provider sets its limit for each address separately — so volume is ramped up per address, not by the overall total.
08
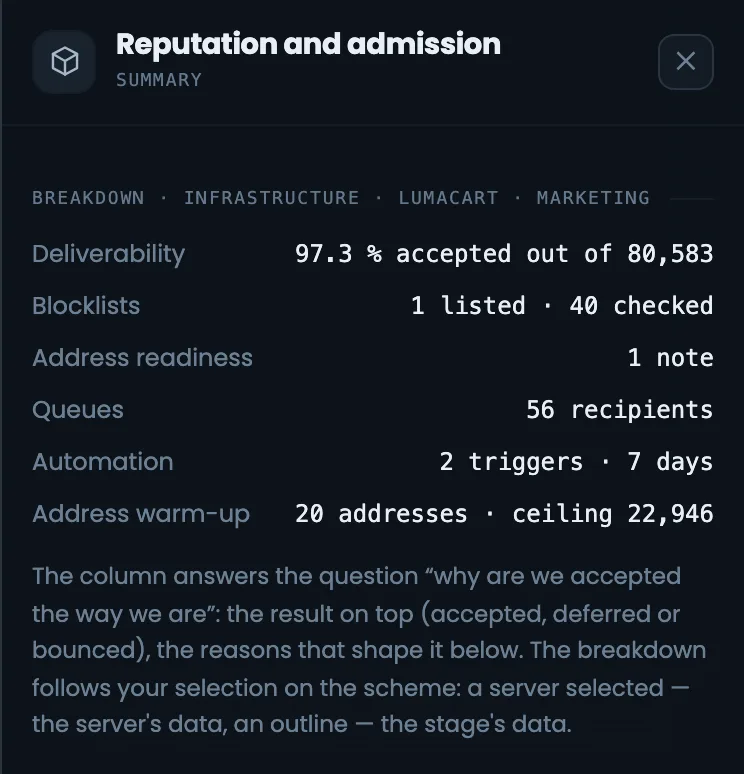
Reputation and admission
Why acceptance looks like this
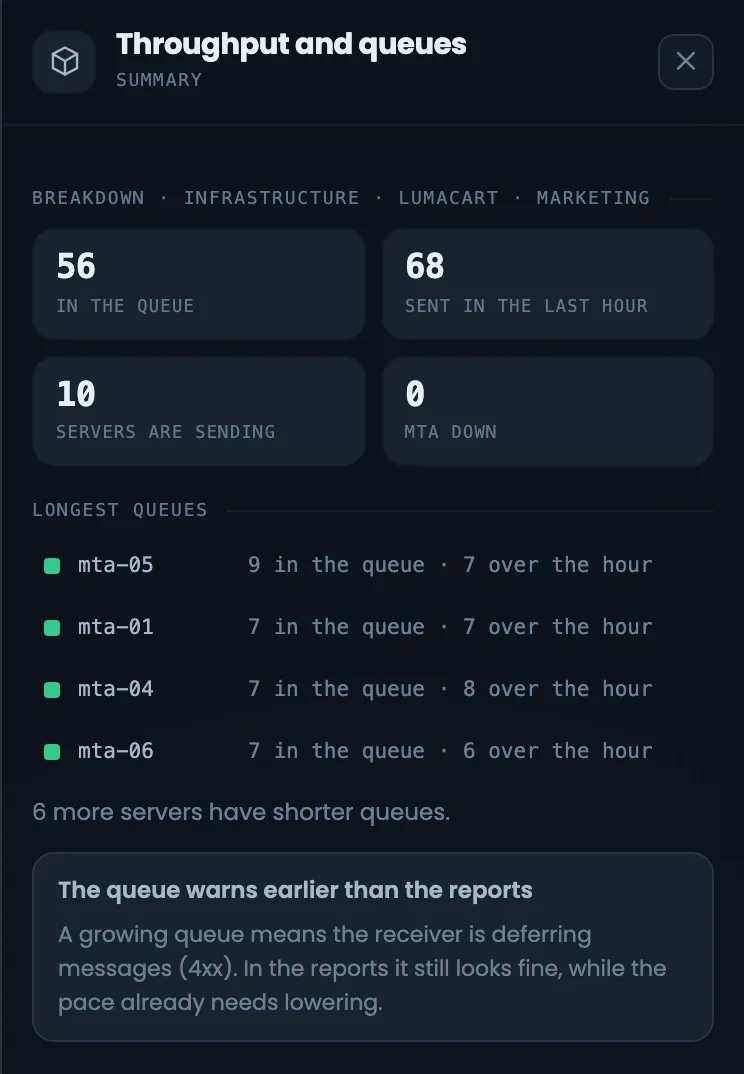
Six reputation and admission blocks explain why mailbox providers accepted your mail exactly this way. The providers column answers how they accepted it, and this one answers why: deliverability, blacklists, address readiness, queues, automation triggers and actual warm-up. The data follows your selection on the diagram: a stage selected — the stage’s data; a server selected — the server’s data. This way you can trace the cause of poor acceptance down to a single server. Start with “Address readiness” and “Blacklists”: if addresses have no PTR or an incomplete set of records, the other figures are just the consequence.
Deliverability — accepted, deferred, rejected and a line by day.
Blacklists — the cleaning address in PSBL.
Address readiness — PTR, FCrDNS, DNS and the SPF, DKIM, DMARC set.
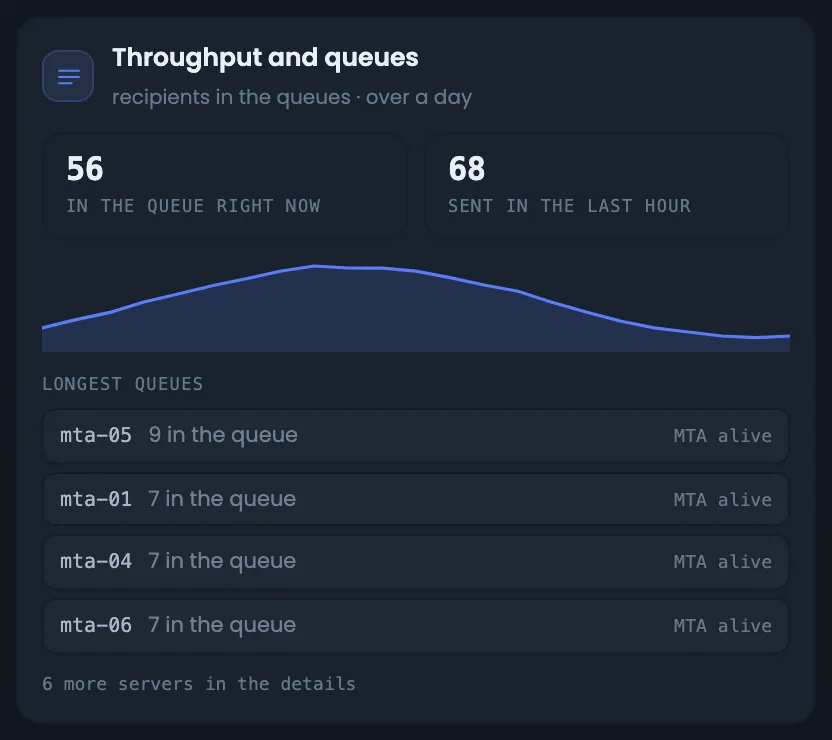
Throughput and queues — the queue now and over the day.
Automation — rules that step in, and rules that watch.
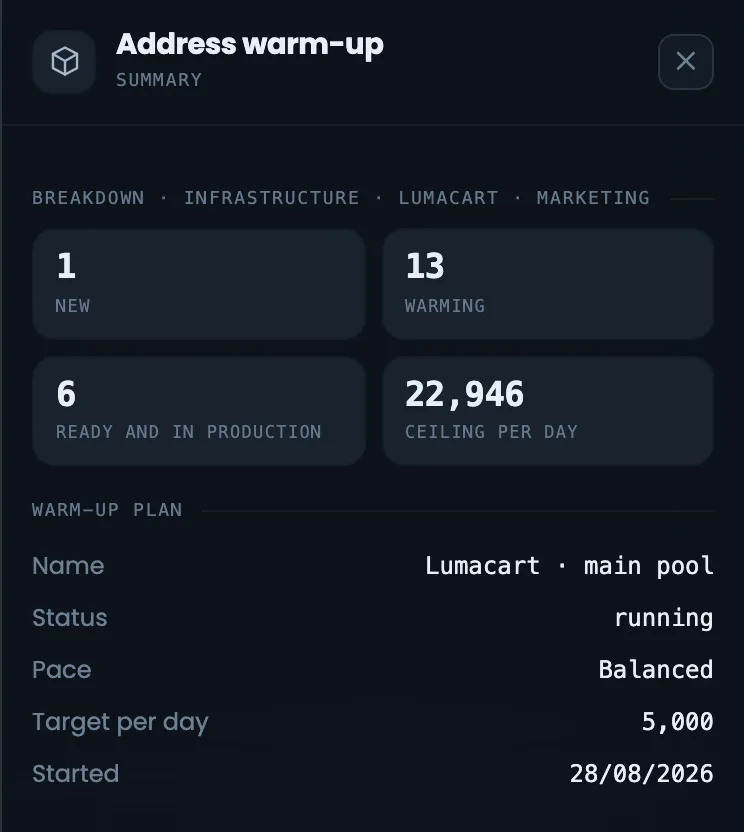
Warm-up — addresses, actual state.
The queue warns of a problem earlier than the reports do.
Bottom rows
7 screens
Below the chain — reverse DNS (PTR) and the DNS row with zones under their stages. The bottom row shows the planned warm-up, bounces by day, the time to the offer, notes on the estimate and geography. Here you see what the plan rests on and how many days the path to the sales series will take.
09
Reverse DNS (PTR)
A separate row — with the hosting provider
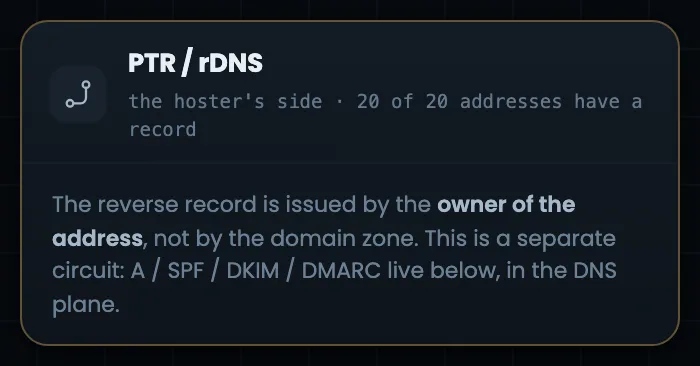
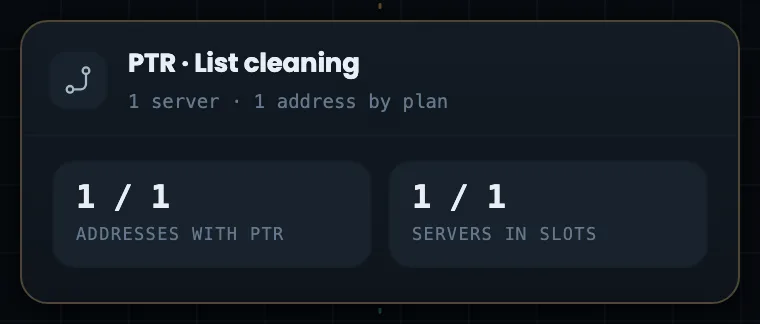
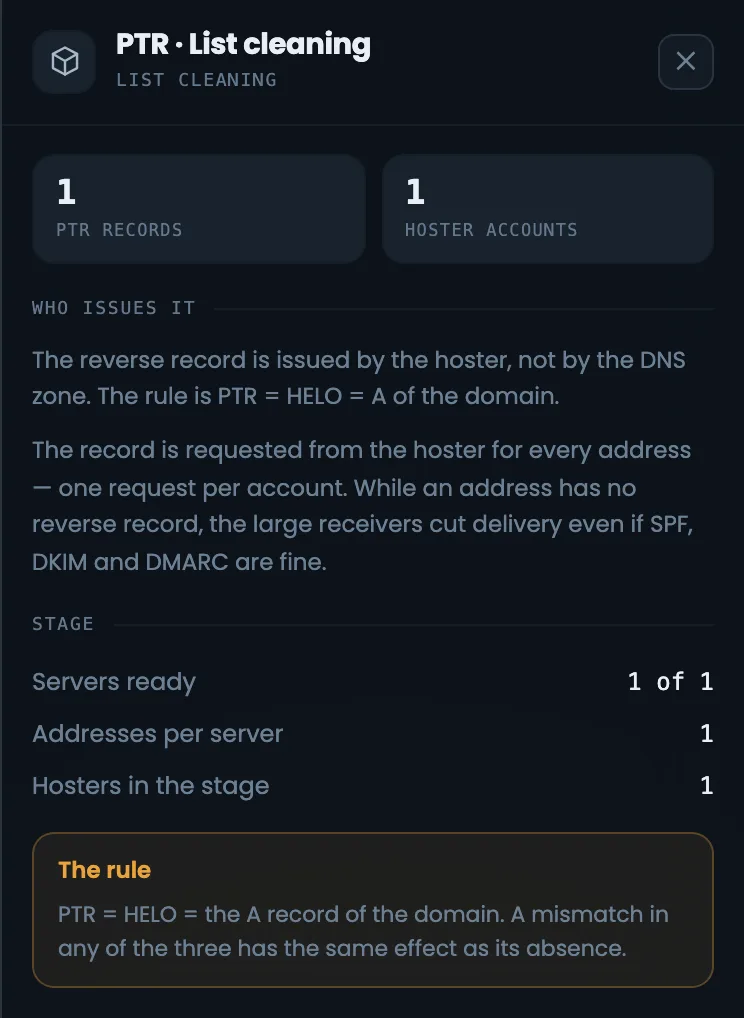
Reverse DNS records (PTR) are in a separate row because a different person is responsible for them: PTR is set by the owner of the address — the hosting provider — not by whoever manages the domain zone. On the left you see how many addresses already have a record, then per stage: addresses with PTR and servers in their slots. The row tells you who you still need to ask for records before you start sending from new addresses: without PTR, mailbox providers are less willing to accept mail. Compare the number of addresses with a record against the number of addresses in the header: until they are equal, part of the sending goes without PTR. How many records to request and from how many hosting accounts is shown in the PTR panel on the right.
EnlargeEnlargeScreen 09 · Reverse DNS (PTR). An example from the MTA-Hub interface.
On the left — how many addresses have a record.
By stage — addresses with PTR and servers in their slots.
One rule: PTR = HELO = the domain’s A record. If one does not match, it is as if there were no record.
10
DNS: zones and accounts
Zones under the stages
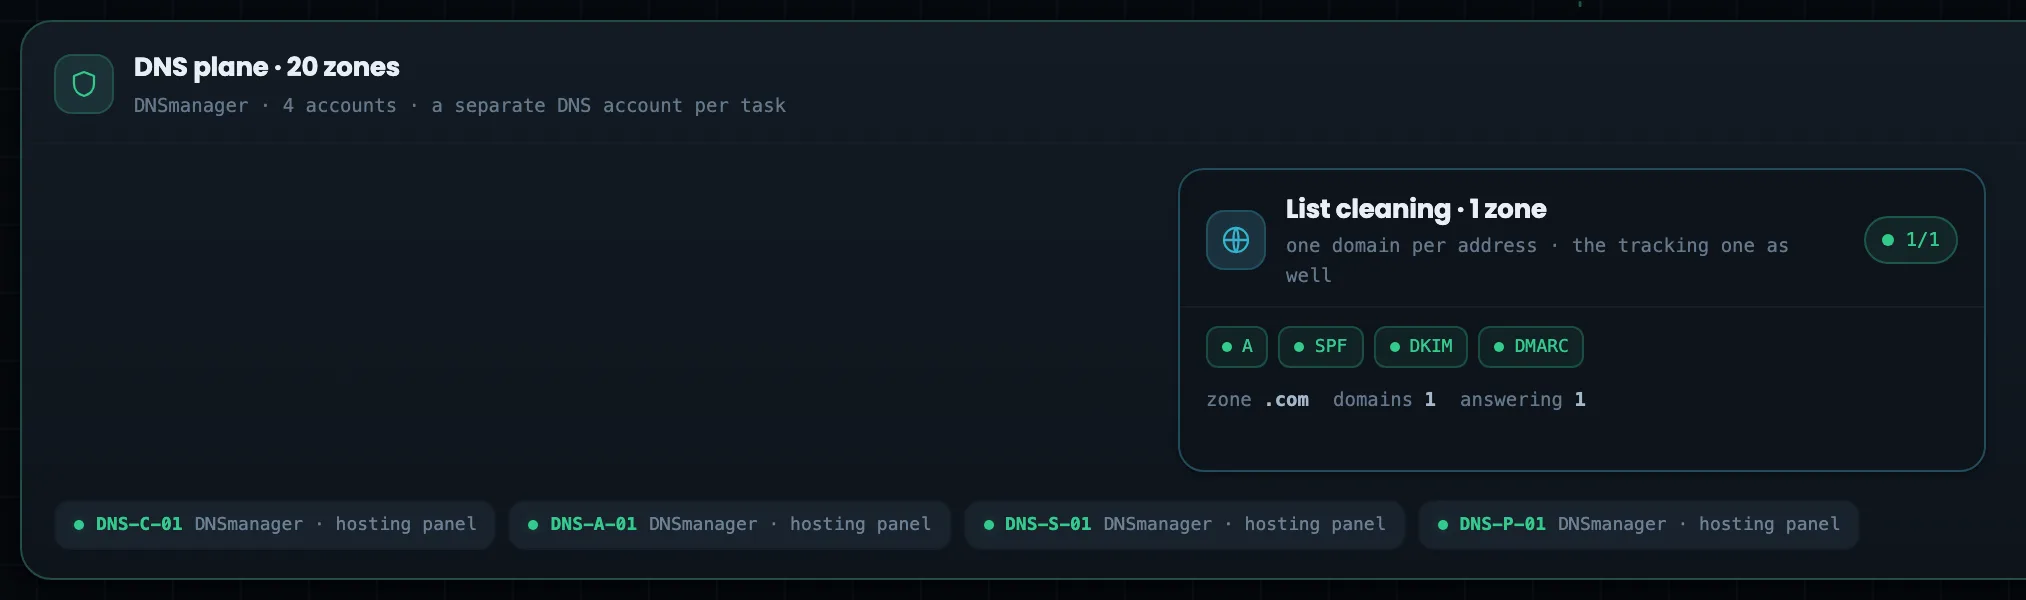
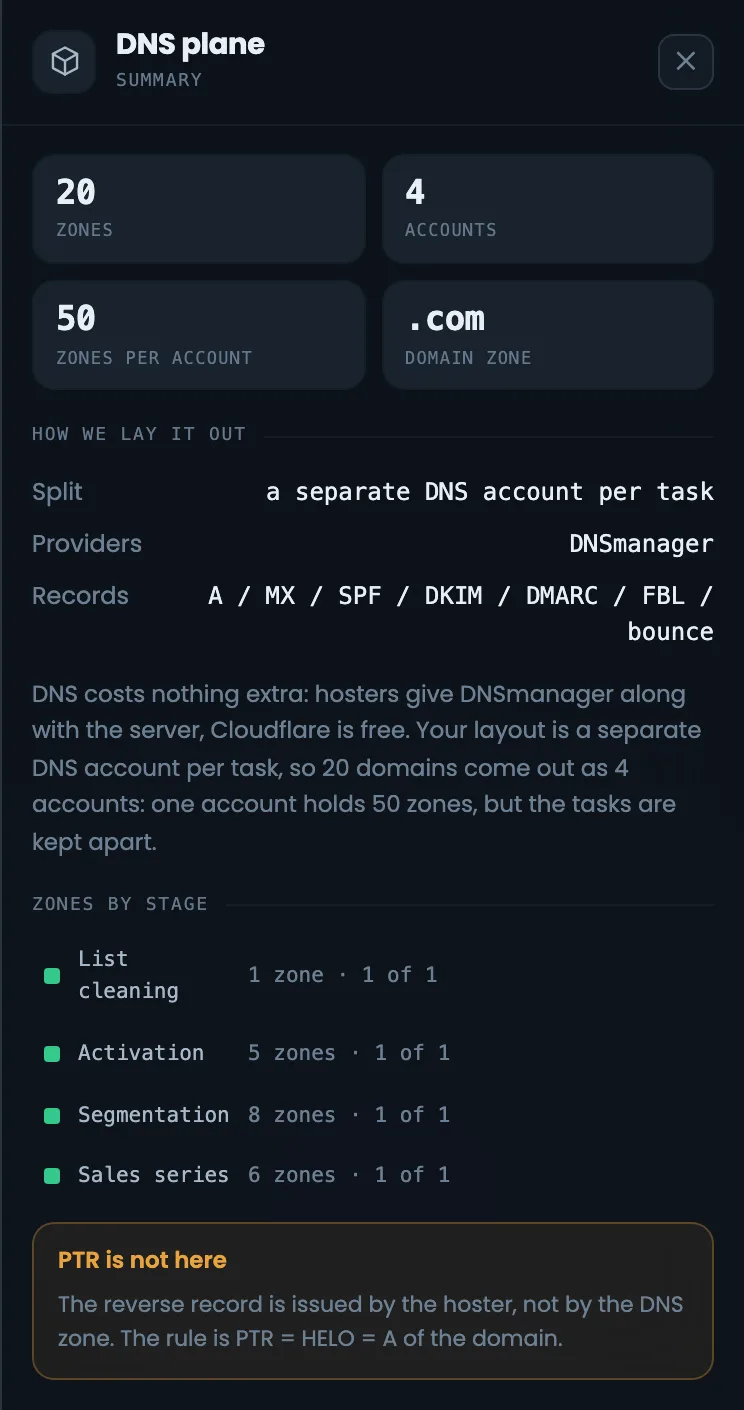
The DNS row runs under all the stages: domain zones sit under their stages, one domain per address. For each stage you see how many zones there are, which records are created, how many domains and how many of them already answer in DNS. At the bottom — DNS accounts by slot, a separate account for each task. The row helps you make sure every sending address has its own domain with a full set of records before the stage starts working. If some domains do not answer yet, the problem goes into the summary’s “Status” — like the domain in this example. Records are checked in detail in the “DNS and keys” section.
EnlargeEnlargeScreen 10 · DNS: zones and accounts. An example from the MTA-Hub interface.
Zones — one domain per address, A, SPF, DKIM, DMARC records.
Accounts — a separate one for each task; one DNSmanager holds 50 zones.
Second screenshot — which records the Hub creates.
PTR is set by the hosting provider — that is the row above.
11
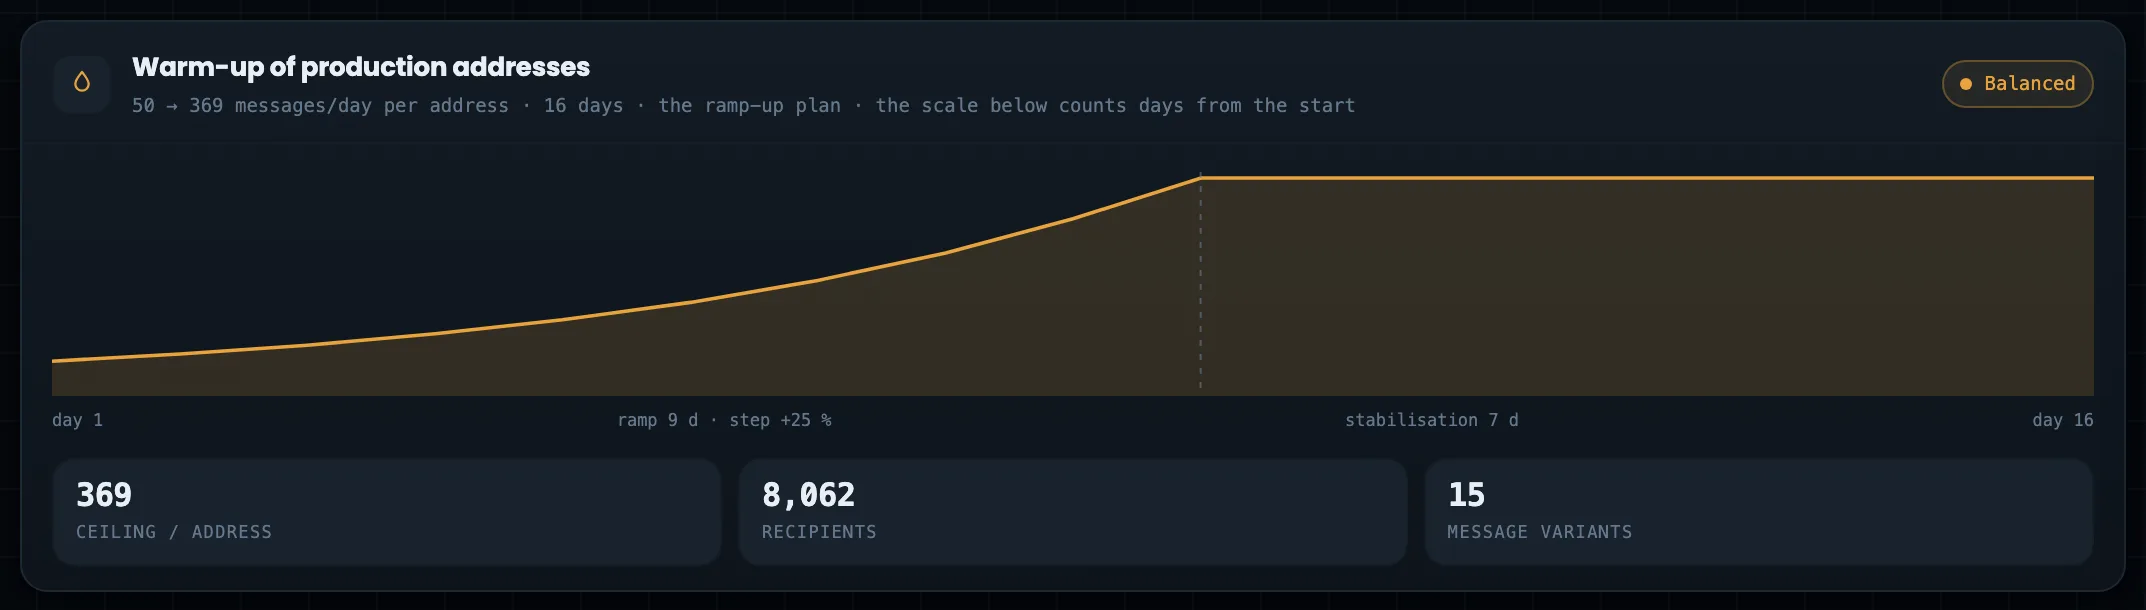
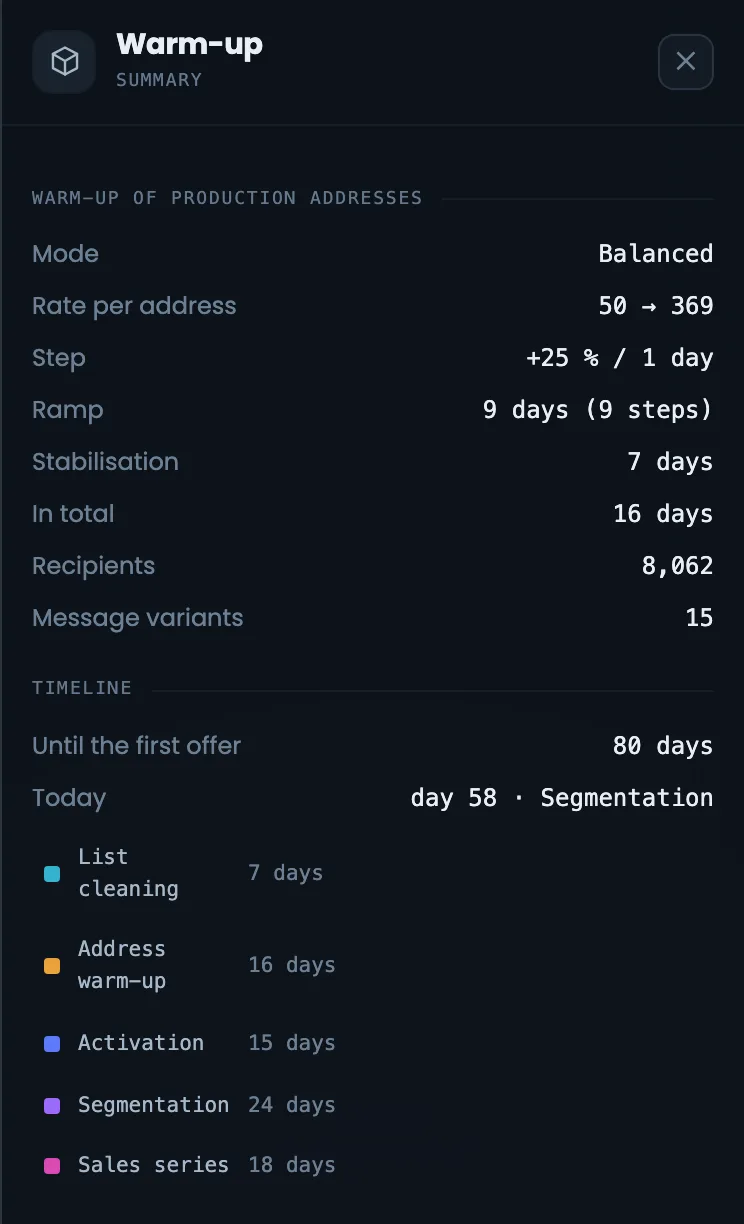
Warm-up of production addresses
Volume growth plan
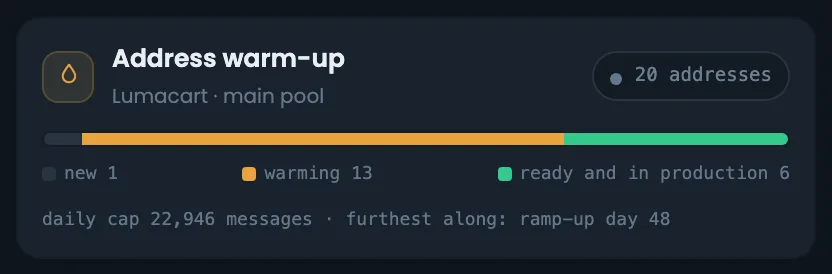
The warm-up block shows the volume growth plan for the production addresses from the specification. Volume per address grows gradually: first growth days in percentage steps, then stabilization days. Below — the limit per address, the number of warm-up recipients and email variants. The block shows how many days IP warm-up will take and at what daily volume each address will move into regular sending. Compare the plan with reality: if the addresses in the “Address warm-up” block are falling behind, the time to the offer will shift. The warm-up profile is “Balanced”; all plan parameters are visible in the warm-up panel on the right.
EnlargeScreen 11 · Warm-up of production addresses. An example from the MTA-Hub interface.
Growth — from 50 to 369 emails a day over 16 days.
Steps — 9 days of growth at +25% and 7 days of stabilization.
Profile — “Balanced”.
This is the plan; the actual warm-up is visible in the reputation block.
12
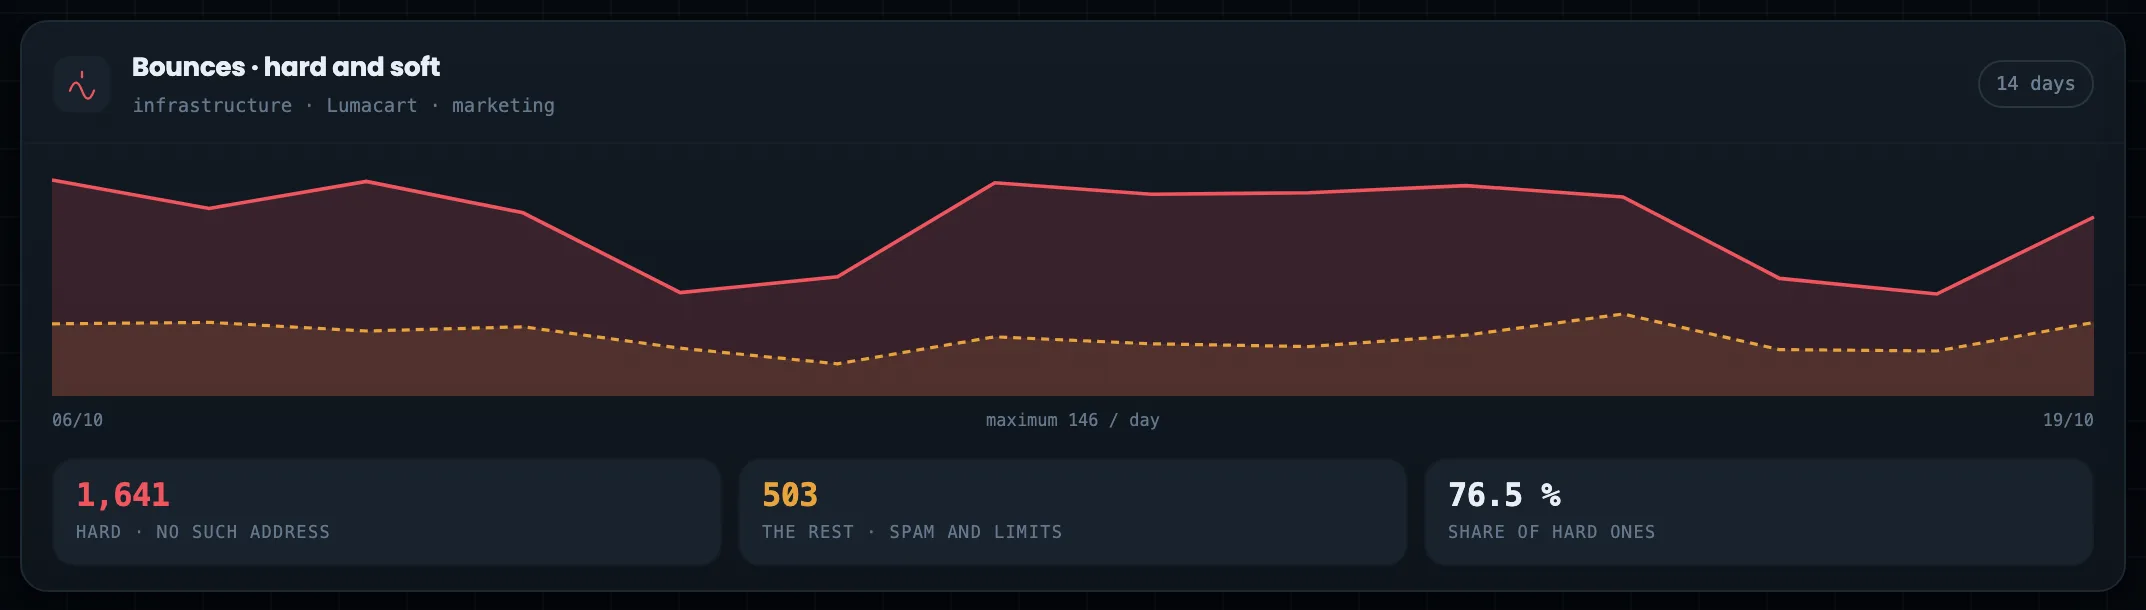
Bounces
Hard and other bounces by day
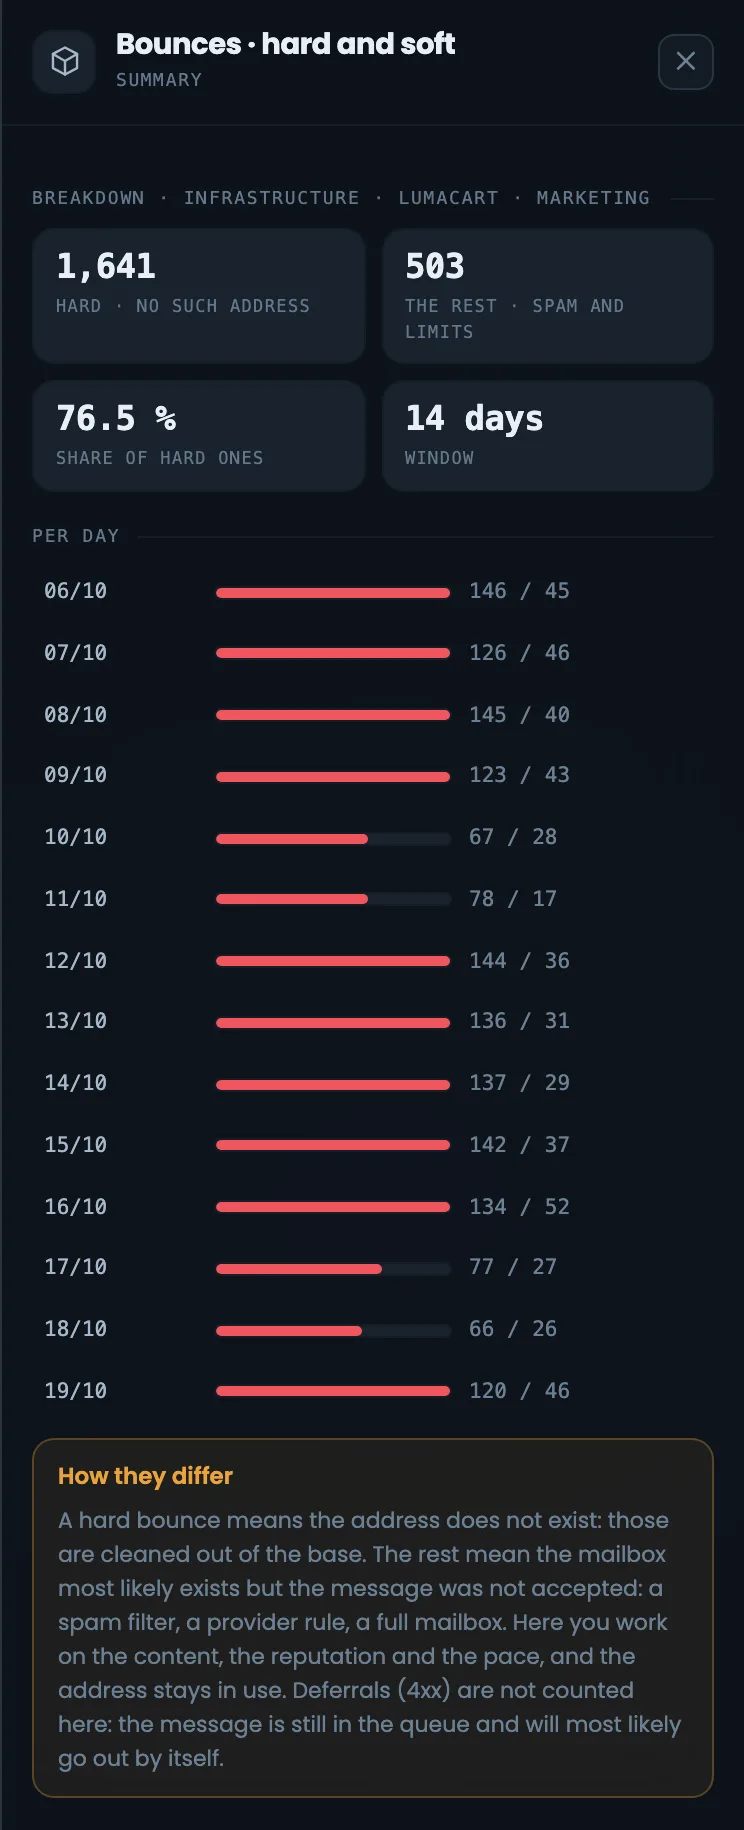
The two-week bounce chart shows hard and other bounces by day, side by side. Hard bounces mean “no such address”, and such addresses are removed from the list; the others are a spam filter, a provider rule or a full mailbox. At the bottom — how many of each and the share of hard bounces: if it is high, most bounces come down to list quality. Select a stage or a server on the diagram, and the chart shows bounces for it alone. If other bounces are growing, look for the reasons in the reputation column and in the providers’ responses. Hard bounces are a reason to clean the list before the next stage.
EnlargeScreen 12 · Bounces. An example from the MTA-Hub interface.
Hard — 1,641 — no such address.
Other — 503 — spam and limits.
Hard share — 76.5%.
Only final bounces: deferred emails are not included here.
13
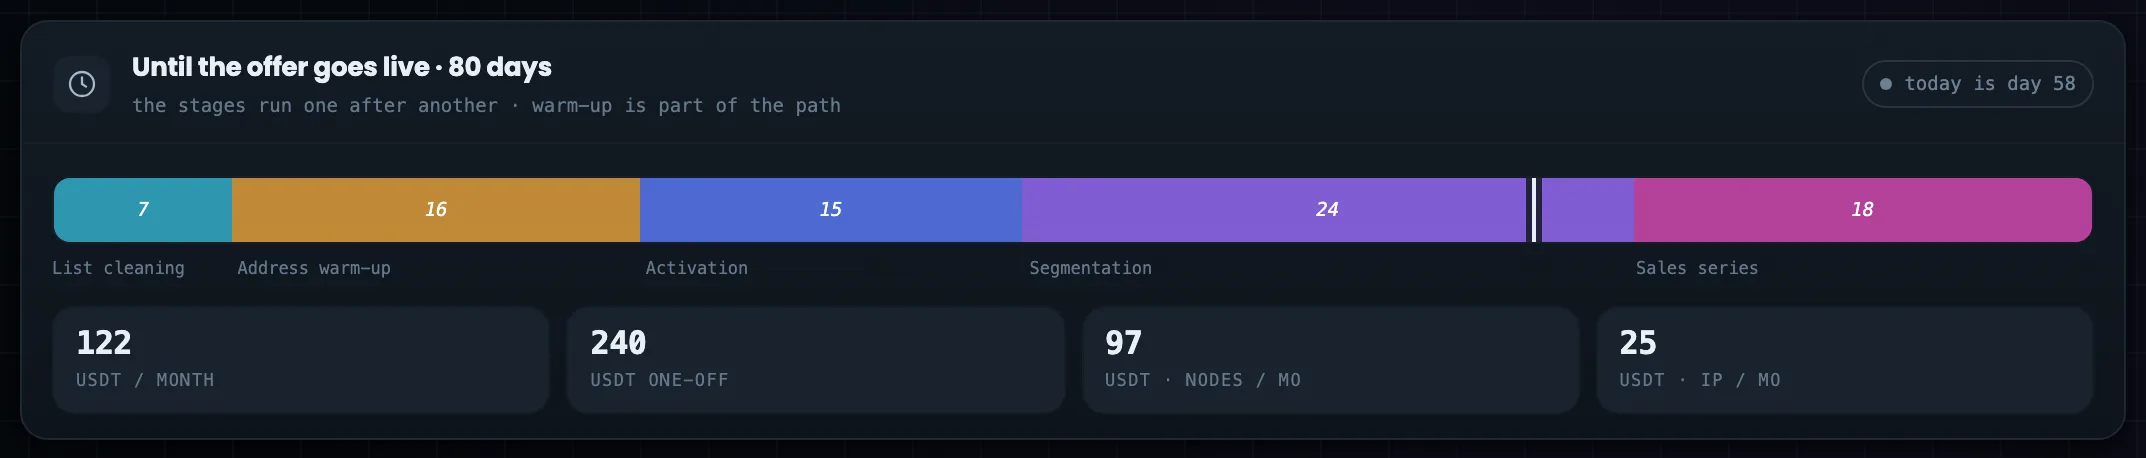
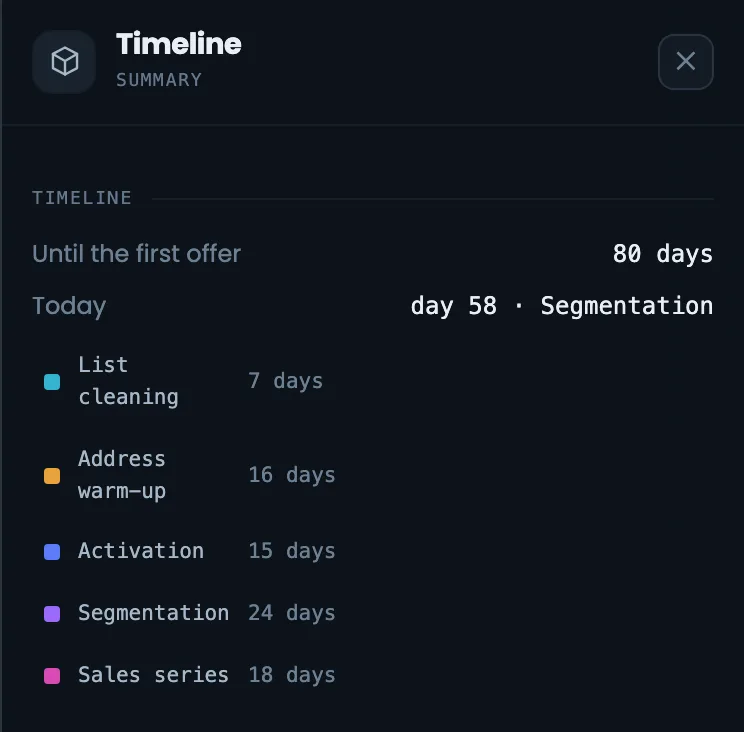
Time to the offer
An 80-day path
The timeline bar answers how many days the path to the sales series — to the offer — will take. Each part of the path is a separate segment: cleaning, warm-up, activation, segmentation and the sales series. A white mark shows today — day 58, segmentation is under way — so you see how much of the path is done and how much is left to the offer; the whole path takes 80 days. Below — the money: monthly and one-time costs, separately for servers and addresses. Open the timeline when a client asks when sales will start: you see which stage is running now and how many days are left.
EnlargeScreen 13 · Time to the offer. An example from the MTA-Hub interface.
Parts — cleaning 7, warm-up 16, activation 15, segmentation 24, sales series 18.
Total — 80 days; the white mark is day 58, segmentation is under way.
Money — 122 USDT a month and 240 one-time.
Each part’s label sits under its segment.
14
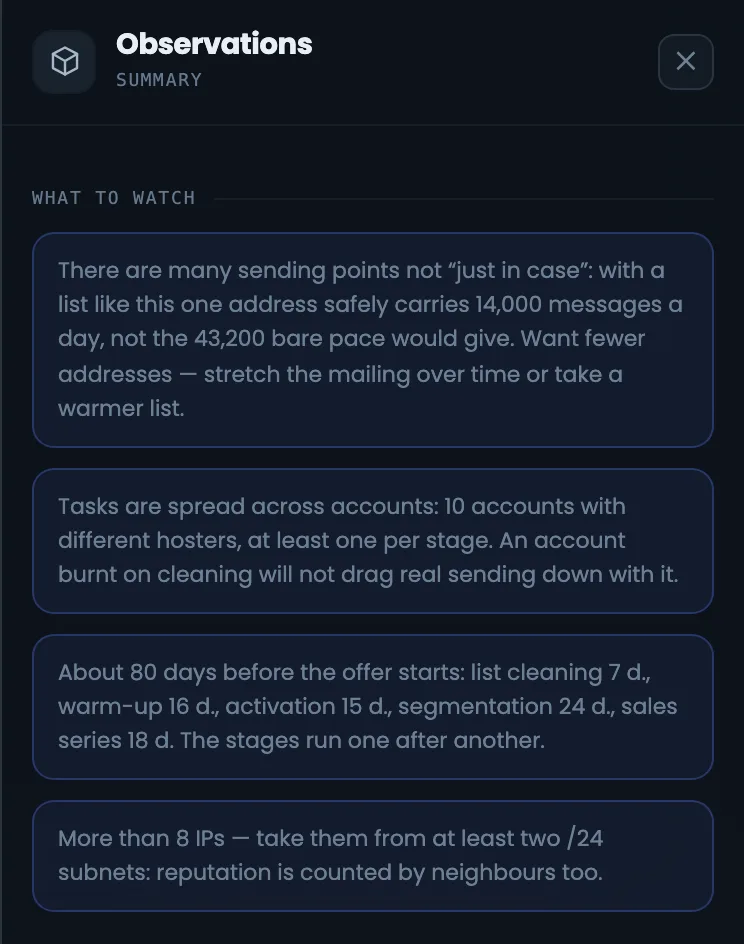
What to watch
Notes on the estimate
The “What to watch” block holds notes on the estimate, each in its own box. It explains why there are many addresses and that this is not “just in case”, why different hosting providers are needed, what the 80 days are made of and why addresses are taken from two subnets. The notes come in handy when you need to justify the plan to a client or a colleague: every debatable point of the estimate is explained in words. For example, with a list like this one address can safely send 14,000 emails a day, not 43,200. If a note does not fit your situation, change the specification, not the diagram: the diagram shows what is written in the estimate.
EnlargeEnlargeScreen 14 · What to watch. An example from the MTA-Hub interface.
Many addresses — safely 14,000 a day per address, not 43,200.
Different hosting providers — at least one per stage.
80 days — what they are made of.
Subnets — more than eight addresses — from two /24s.
The diagram shows exactly what the Hub wrote in the specification.
15
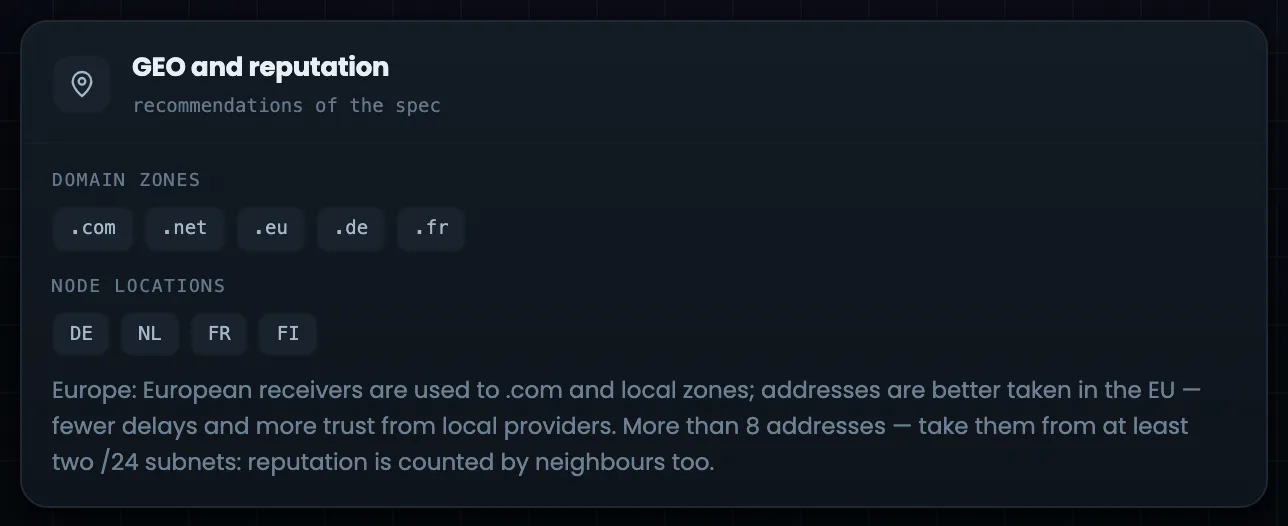
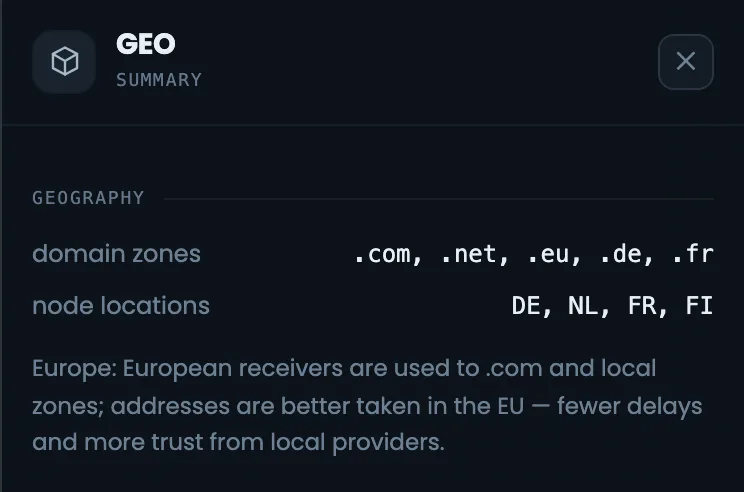
GEO and reputation
Zones and server countries
The “GEO and reputation” block shows the specification’s recommendations for the geography of your audience: which domain zones to register domains in and in which countries to place servers. Here the list is European, and the recommendations are for Europe. This block is a handy way to check that the domains and servers in the diagram’s slots suit the people you email — for example, when you choose a server for an empty slot. If no regions are set in the specification, set them there — then the recommendations appear. The specification picks the zones and server countries; the diagram reminds you of them during the build.
EnlargeScreen 15 · GEO and reputation. An example from the MTA-Hub interface.
Europe — zones .com, .net, .eu, .de, .fr.
Servers — DE, NL, FR, FI.
If no regions are set, the block says so: there was nothing to choose from.
Right panel
9 screens
On the right is a panel: everything about the selected object and the actions on it. If nothing is selected, it shows the project overview; if a stage, an account, a slot or a summary cell is selected — its details. From the panel you connect a server to an empty slot, replace it or free the slot.
16
Panel: project overview
When nothing is selected
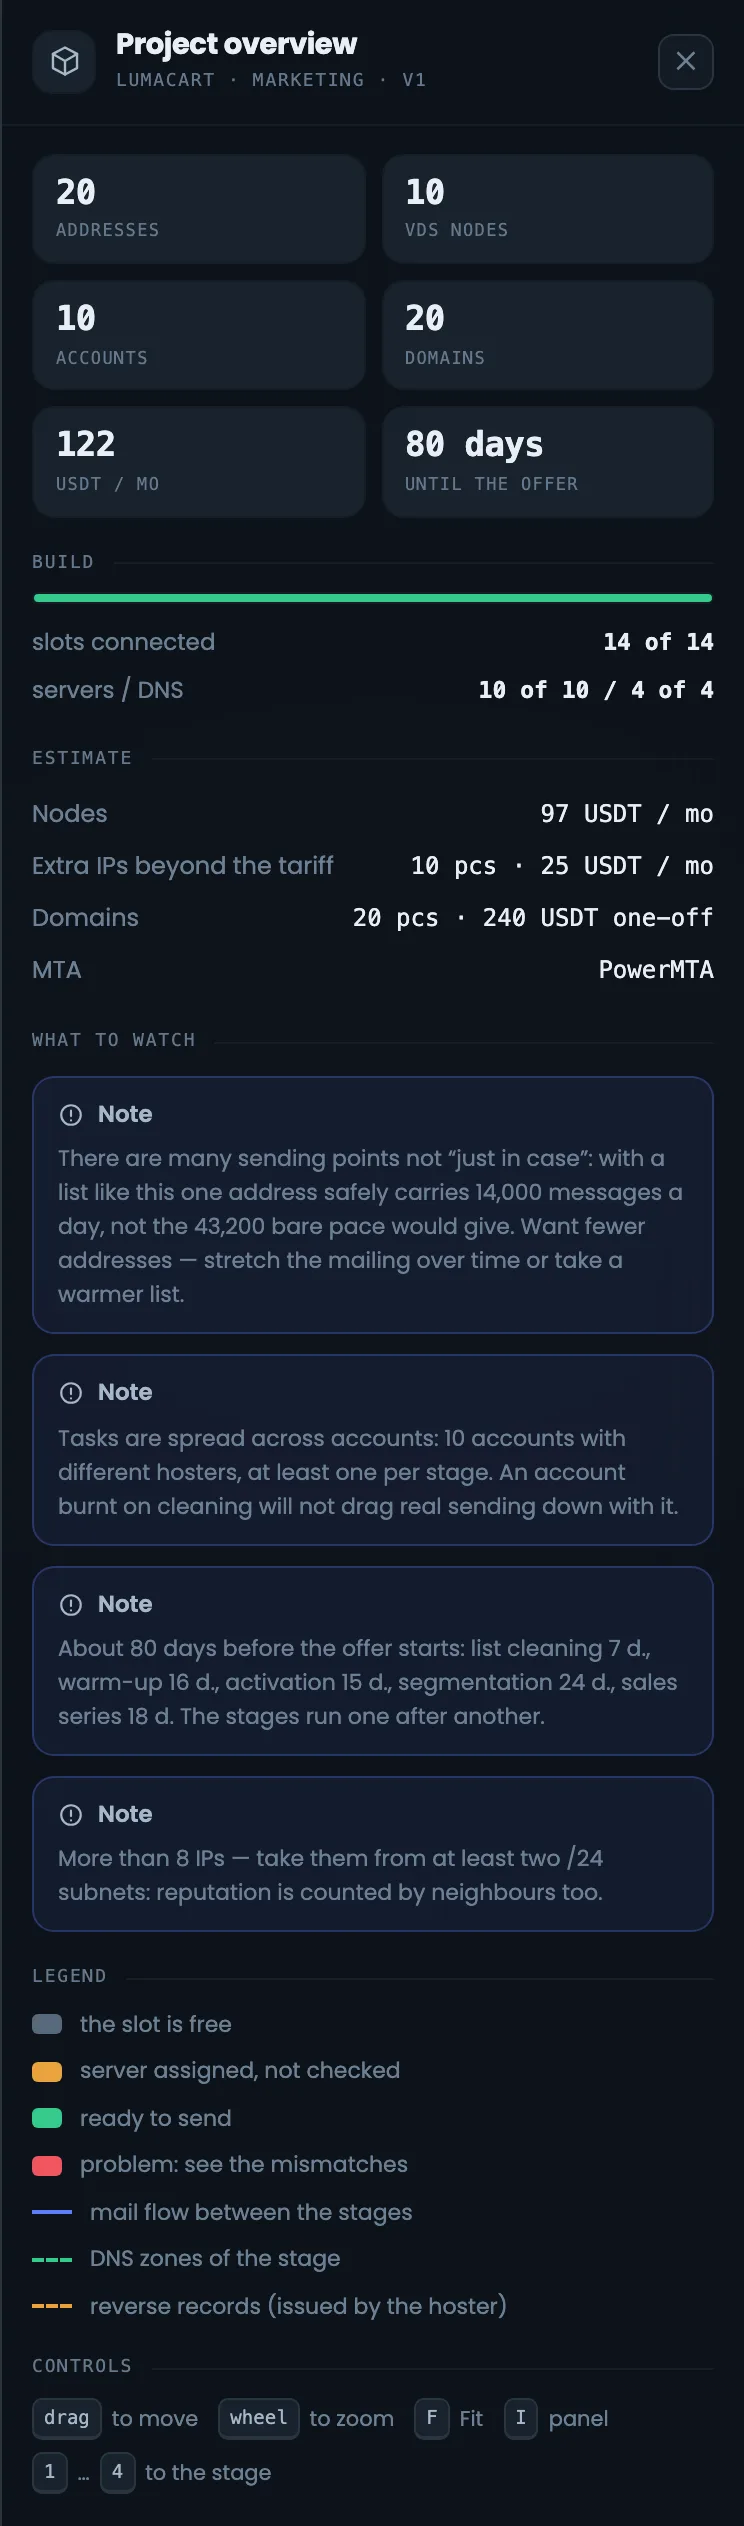
When nothing is selected on the diagram, the right panel shows the project overview. It has the totals — addresses, servers, accounts, domains, money and days to the offer — the build status by slot, and the cost estimate: servers, addresses beyond the plan’s included ones, domains, MTA. Below — notes on the estimate, what the colors mean and the keys for controlling the diagram. It is a good starting point for someone opening the diagram for the first time: everything important is in one column. The cost estimate in the overview answers what the infrastructure costs per month and how much was spent once on domains. To return to the overview, clear the selection with the Esc key.
EnlargeScreen 16 · Panel: project overview. An example from the MTA-Hub interface.
Any object on the diagram opens its details in this panel.
17
Panel: stage and account
Make-up and the risk of blocking
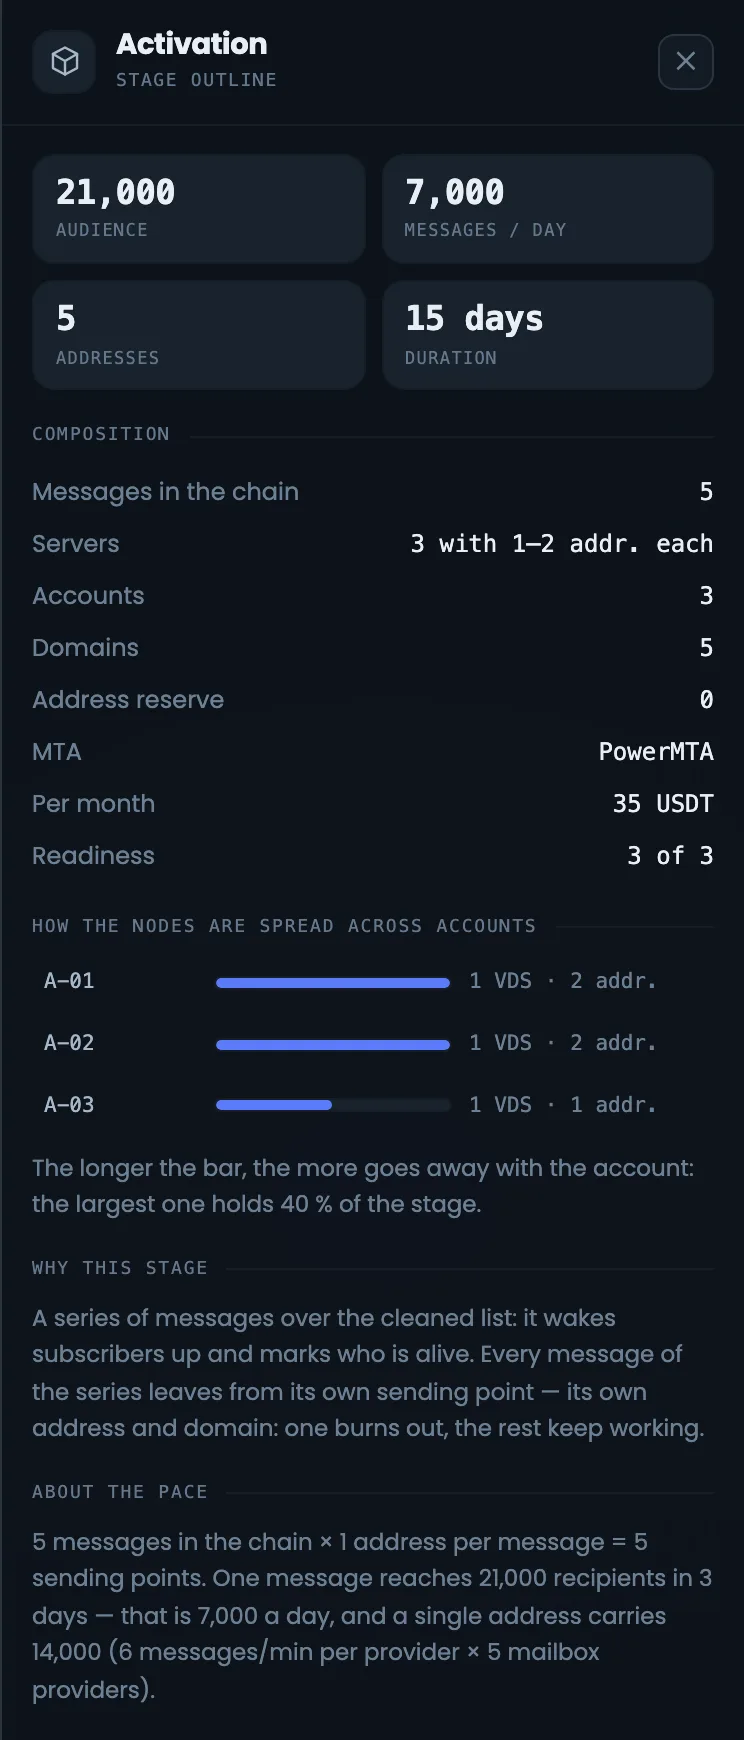
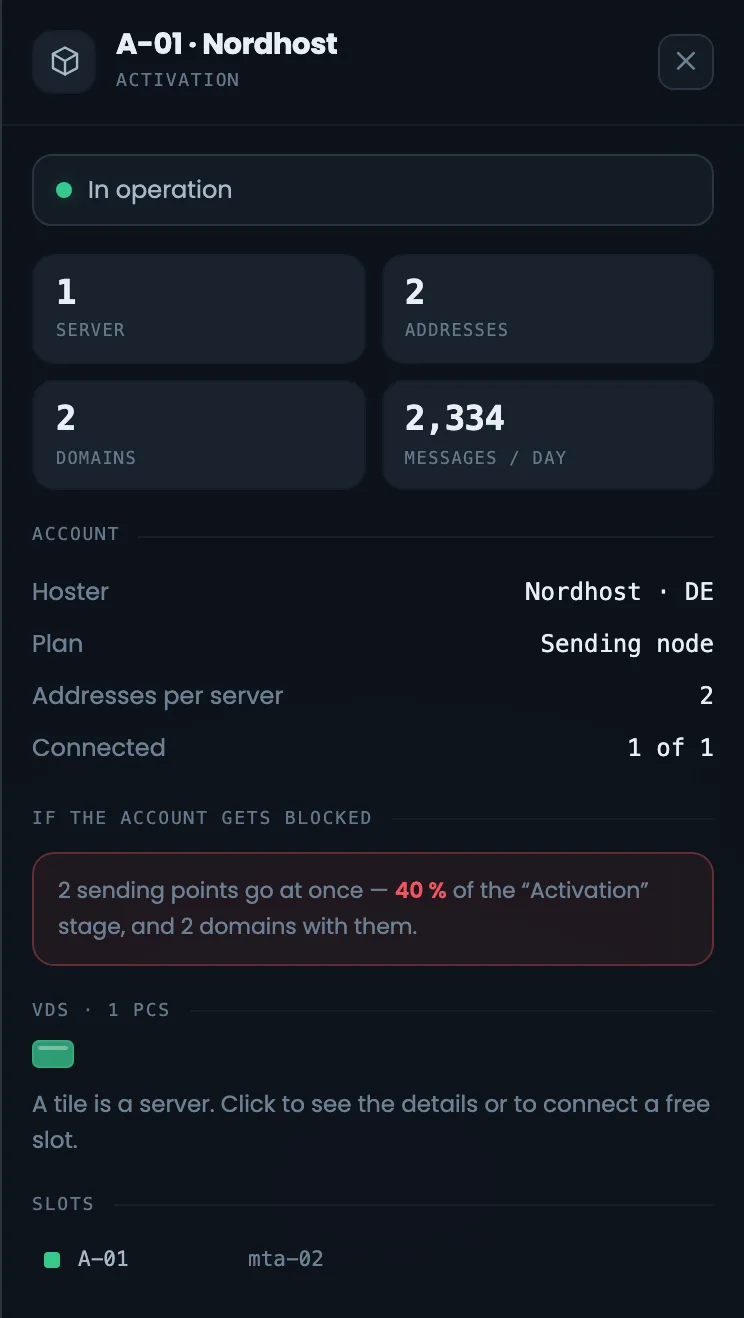
Two panels for two levels of the chain — the stage and the hosting account. The stage panel shows the audience, emails a day, the stage make-up, the reserve addresses, money and readiness, as well as why the stage is needed and how its speed was calculated. The account panel shows servers, addresses, domains, the hosting provider and plan, and how many slots are connected. These panels let you assess the risk of an account being blocked before the mailing starts: if one account holds most of a stage’s addresses, it is worth spreading the servers across different hosting providers. Both panels open when you click a stage or an account card on the diagram.
EnlargeEnlargeScreen 17 · Panel: stage and account. An example from the MTA-Hub interface.
Stage — audience, emails a day, make-up, spread across accounts.
Account — servers, addresses, plan and what happens if it is blocked.
The bar length shows what share of the stage’s addresses would be lost if the account were blocked.
18
Panel: slots
A slot with a server and a slot for a DNS account
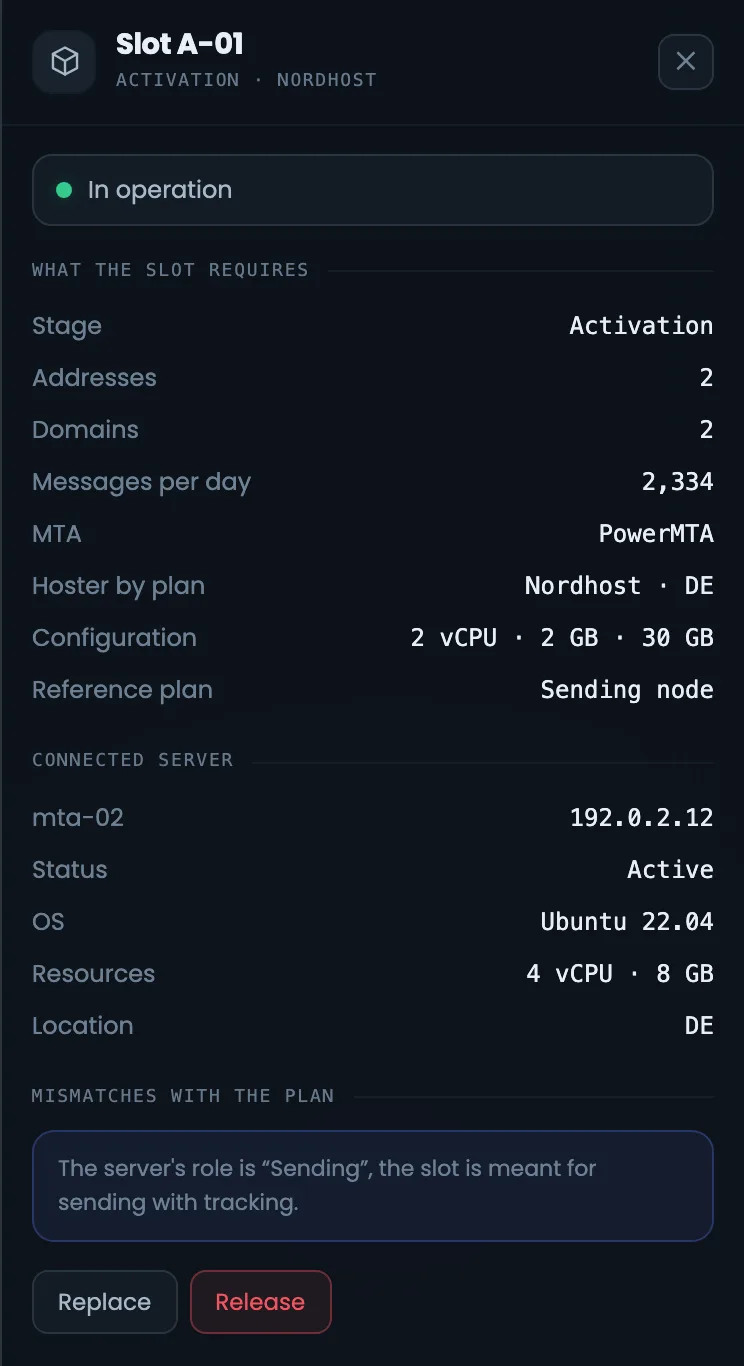
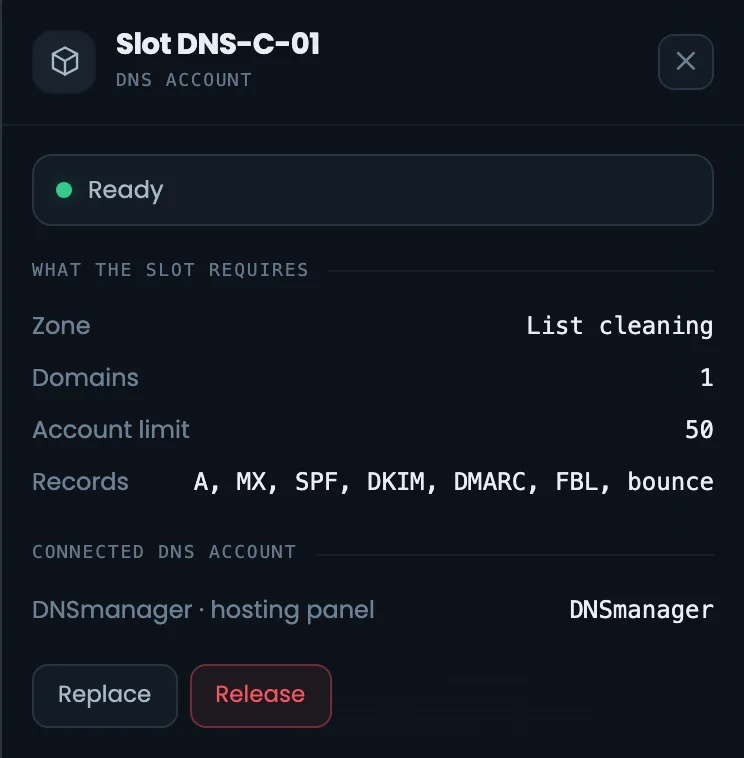
Slot panels — with a server and for a DNS account. A slot with a server shows the plan’s requirements — stage, addresses, domains, emails a day, MTA, hosting provider and country, configuration, approximate price — and the connected server with its address, state, system and resources. A DNS slot shows the stage’s zone, domains, the zone limit per account, which records are created and which account is connected. This is how you check whether a server suits its slot. Open a slot when its tile turns yellow or red: the differences from the plan will tell you what is wrong with the server, and the “Replace” button puts a different one in its place.
EnlargeEnlargeScreen 18 · Panel: slots. An example from the MTA-Hub interface.
Slot with a server — requirements, the connected server and differences from the plan; “Replace” and “Release”.
DNS slot — the stage’s zone, domains, zone limit, connected account.
Some differences are for information only: for example, the “Sending” role on a slot with tracking.
19
Panel: empty slot
Choosing a server
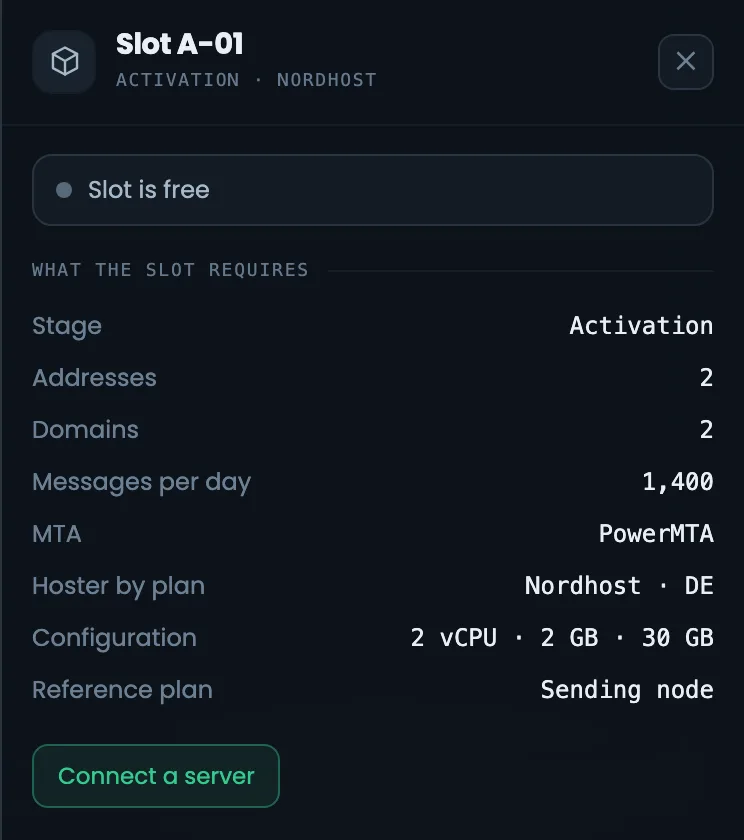
This is how you connect a server to an empty slot — shown on “Lumacart · second store”, which is still being built. Click a free tile, then “Connect a server” — a searchable list of free servers opens. Each one shows how many addresses it has, which MTA and where it is located, so you pick a suitable server without going to other sections. If there are many free servers, “Assign free servers” in the header places them into empty slots all at once. It is better to pick a server with no shortage marks — then the slot will not need completing later. A mark like “addresses 1 of 2” can be cleared by buying another address from the hosting provider.
EnlargeEnlargeScreen 19 · Panel: empty slot. An example from the MTA-Hub interface.
Connect a server — a searchable list of free servers.
For each one — addresses, MTA, location and what is missing: “addresses 1 of 2”.
You see what is missing even before connecting.
20
Panel: what to fix
Critical issues and warnings
The status panel has the same count as the “Status” cell of the summary, but with a list of what needs fixing. Problems are split into critical issues and warnings, and the build status is shown below. Start with the critical ones: until they are fixed, the Hub will not say “No problems”, and the infrastructure will not work as the plan intends. Warnings can wait, but the same panel keeps reminding you of them until they are fixed. Come back to the panel after each fix: the list gets shorter as you work, and when it is empty, the summary shows “No problems”.
EnlargeScreen 20 · Panel: what to fix. An example from the MTA-Hub interface.
Critical — sending will not start or will not go as planned.
Warnings — can be put off, but not forgotten.
Below — the build.
21
Panel: delivery and bounces
Summary details
Four panels expand the summary cells when their numbers raise questions. Deliverability is shown as shares and as email counts, volume — by day with the peak, bounces — with an explanation of how hard bounces differ from the rest, and receivers — for each mailbox provider with its share. Here you see what each summary number is made of, and you can tell when a problem started and which provider it affects. The data covers two weeks and the last day. Look at bounces first: if there are many hard ones, the cause is the list, and it is better to clean it before the next stage of the chain than to increase volume.
Deliverability — accepted, deferred, rejected and complaints.
Volume — by day with the peak.
Bounces — hard versus other, with an explanation.
Receivers — for each mailbox provider.
Over two weeks and over the last day.
22
Panel: reputation
Six sections in detail
Reputation and admission panels — a summary of the six sections and each section in detail. Here you see which blacklists your addresses are on, whether PTR, domains and the full set of records are ready, what queues the servers have, when and at what metric value protection rules fired, and how the warm-up is going against the plan. Each section says plainly what needs fixing, so the panel works as a to-do list for your sender reputation. Expand the section that the summary marks with a problem — the details are right under it. A cleaning address in PSBL is expected, but a main sending address on a list is a reason to look into it right away.
Reverse DNS and DNS panels for the selected stage. The PTR panel shows how many records you need and from how many hosting accounts to request them — it is handy for preparing support requests to the hosting provider. The DNS panel shows zones, accounts, the zone limit per account, the domain zone and how zones are spread across stages. Together they split the work between the hosting provider, who sets PTR, and whoever manages the domain zones. These panels matter most when a stage is getting ready to launch: until PTR records are set and domains answer, it is better not to start sending from the stage. Records are checked in detail in the “DNS and keys” section.
EnlargeEnlargeScreen 23 · Panel: PTR and DNS. An example from the MTA-Hub interface.
Stage PTR — how many records and from how many hosting providers to request them.
DNS — zones, accounts, limit and spread across stages.
PTR is requested from the hosting provider; zones are managed in DNS.
24
Panel: warm-up, timing, list
Estimate parameters
Five panels with the estimate parameters the diagram’s plan rests on. Warm-up — profile, rate per address, step, growth, stabilization, recipients and email variants; timing — by the parts of the path; then all notes on the estimate and geography. The list panel shows the number of addresses, the safe limit per sending address, the mailbox providers and the speed. If the plan looks odd, look here for the answer to “why is it like this” — including why the safe limit is lower than the maximum speed. Come here when you need to explain the plan to a client or check what assumptions it is built on.
The “Activation” stage: 5 addresses on three servers at different hosting providers, all slots filled.
Where does the diagram’s plan come from?
From the estimate of the deployed specification: stages, accounts, addresses, domains, money and timing.
Where does the actual data come from?
From what is in the slots: servers, their addresses and domains, plus 14 days of data from the MTAs themselves.
How do I connect a server to a slot?
Click a free tile and choose a server from the list — each one shows what it lacks. “Assign free servers” places them all at once.
What does a tile’s color mean?
Green — ready or sending, yellow — assigned but not checked, red — a problem, gray — free.
Why does cleaning have only one address?
The stage is disposable: the address works on an old list and ends up on blacklists, so it is never moved into the main sending.
Why are the hosting providers different?
If the account at one of them is blocked, the other stages keep working.
Why is deliverability not 100%?
Shares are never rounded in your favor: while even one email has not been delivered, you will see “97.3%”.
How do I control the diagram from the keyboard?
F — fit, I — panel, 1…4 — go to a stage, + and − — zoom, Esc — clear selection and leave full screen.
07 / Next step
Check the build of all your infrastructures.
The diagram shows one infrastructure end to end. All builds at once — what is built, what works and where slots are empty — are on the infrastructures page.
The diagram’s plan comes from a deployed specification, and the servers for the slots come from nodes.