Data window
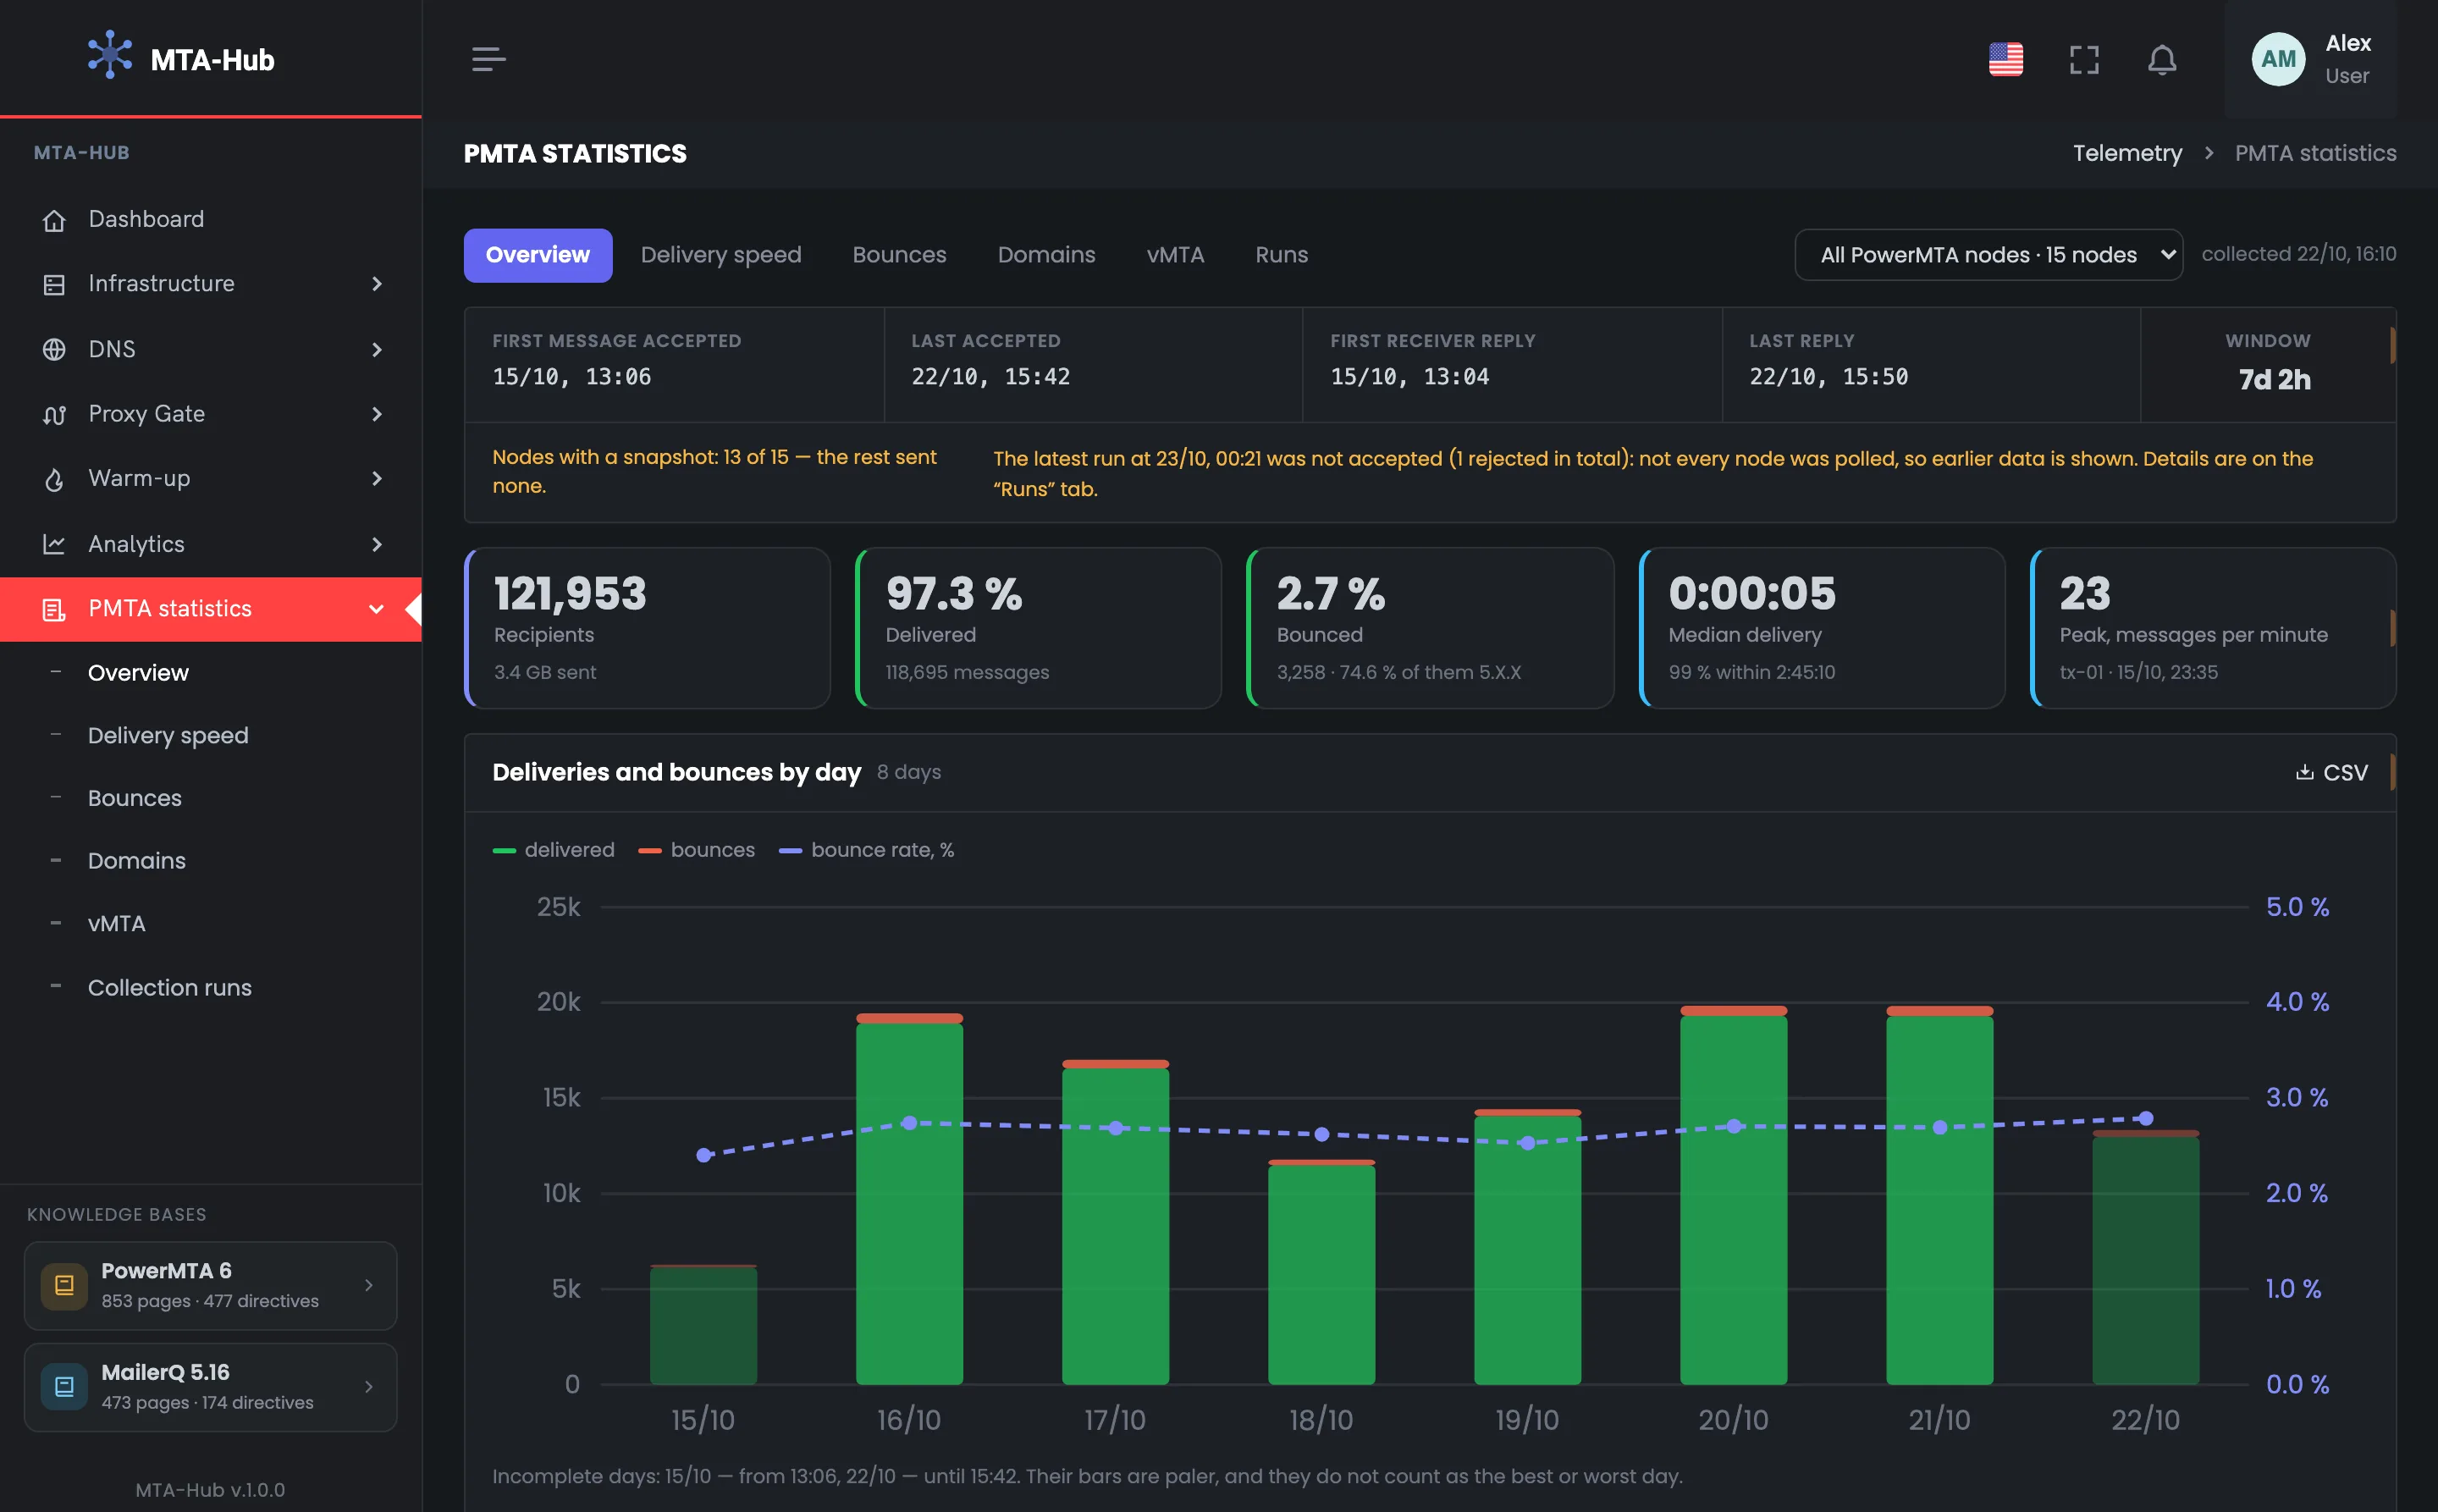
7 days 2 hoursThe first message was accepted on Oct 15 at 13:06, the last on Oct 22 at 15:42. The files are kept on the server for a week, so the period is about seven days.
MPowerMTA
accounting
Window7 d 2 h
Oct 15, 13:06Oct 22, 15:42

PowerMTA statistics from accounting files
Every PowerMTA server keeps its own accounting log — a file where the MTA records the outcome of each message. The Hub collects these files from all your servers and shows a week of sending.
This is the primary source: it is what you refer to when talking to your hosting provider, and what you check “Analytics” against.
01 / Where the data comes from
The PowerMTA accounting file is a log where the MTA records the outcome of each message: delivered or bounced, when, to whom and from which address. The Hub collects these files from all servers over SSH and parses them with the PowerMTA report utility. So the statistics show a week of sending exactly as the MTAs themselves recorded it.
The Hub saves the data in different slices only after checking that they add up to the overall total
The first message was accepted on Oct 15 at 13:06, the last on Oct 22 at 15:42. The files are kept on the server for a week, so the period is about seven days.
Data is available from 13 of 15 servers, and the last collection on Oct 23 at 00:21 was not accepted: not all servers were polled. The screen says so and shows the earlier data.
02 / A week of sending
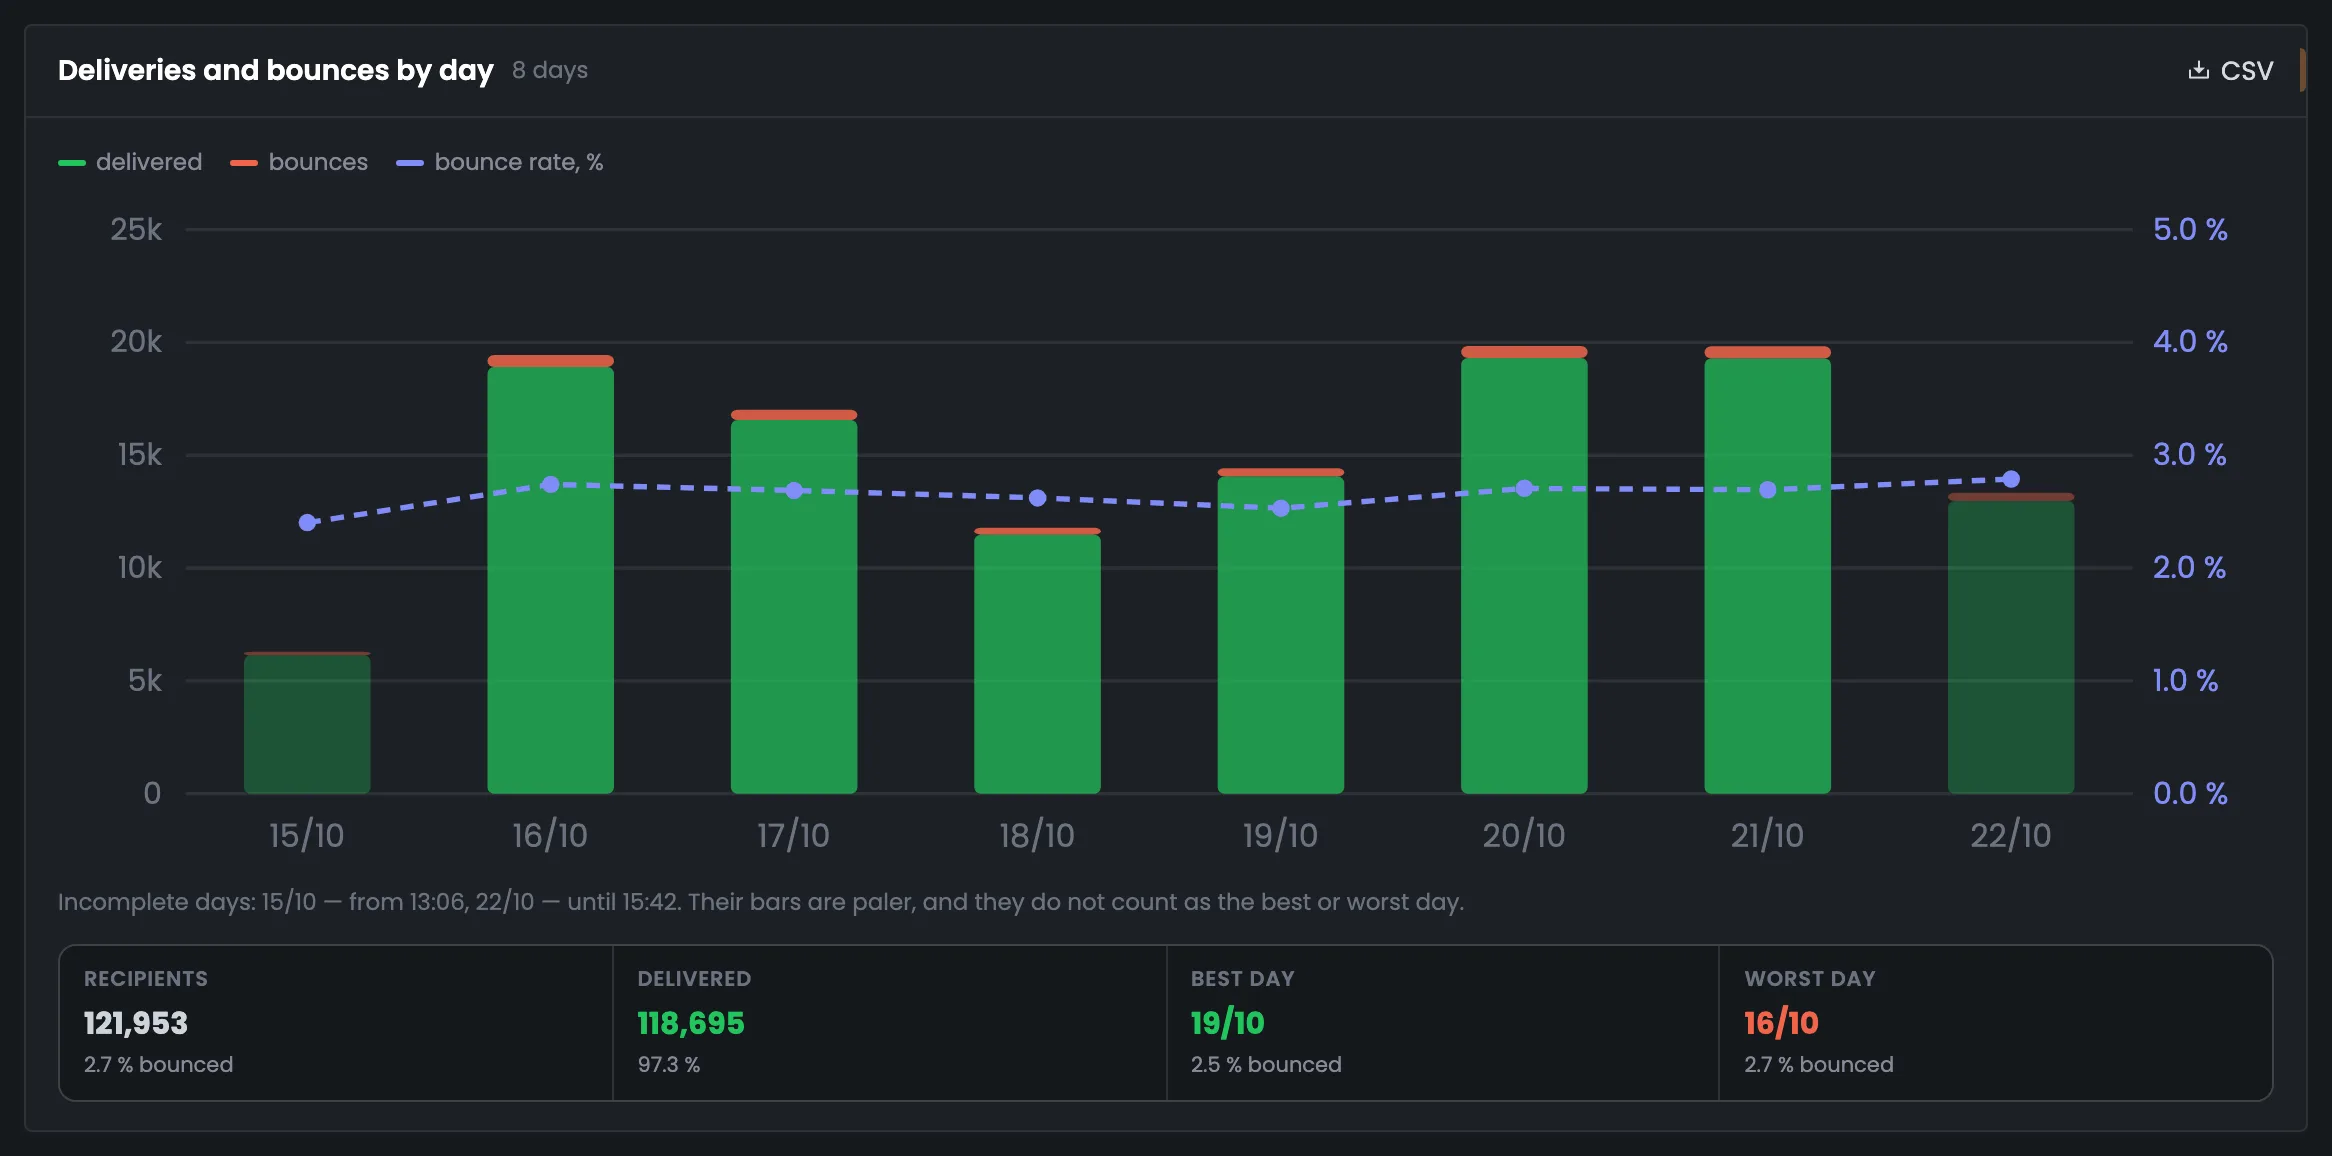
The key figures of the week: recipients, the share of delivered and bounced messages, median delivery time and peak load. The Hub converts each server's time to UTC using its own time zone and builds the days in your profile's time zone. Incomplete days at the edges of the period are shown paler and never count as the best or worst day.
Delivered and Bounced are colored by bounce-rate thresholds: under 4% — green, from 4% — yellow, from 6% — red
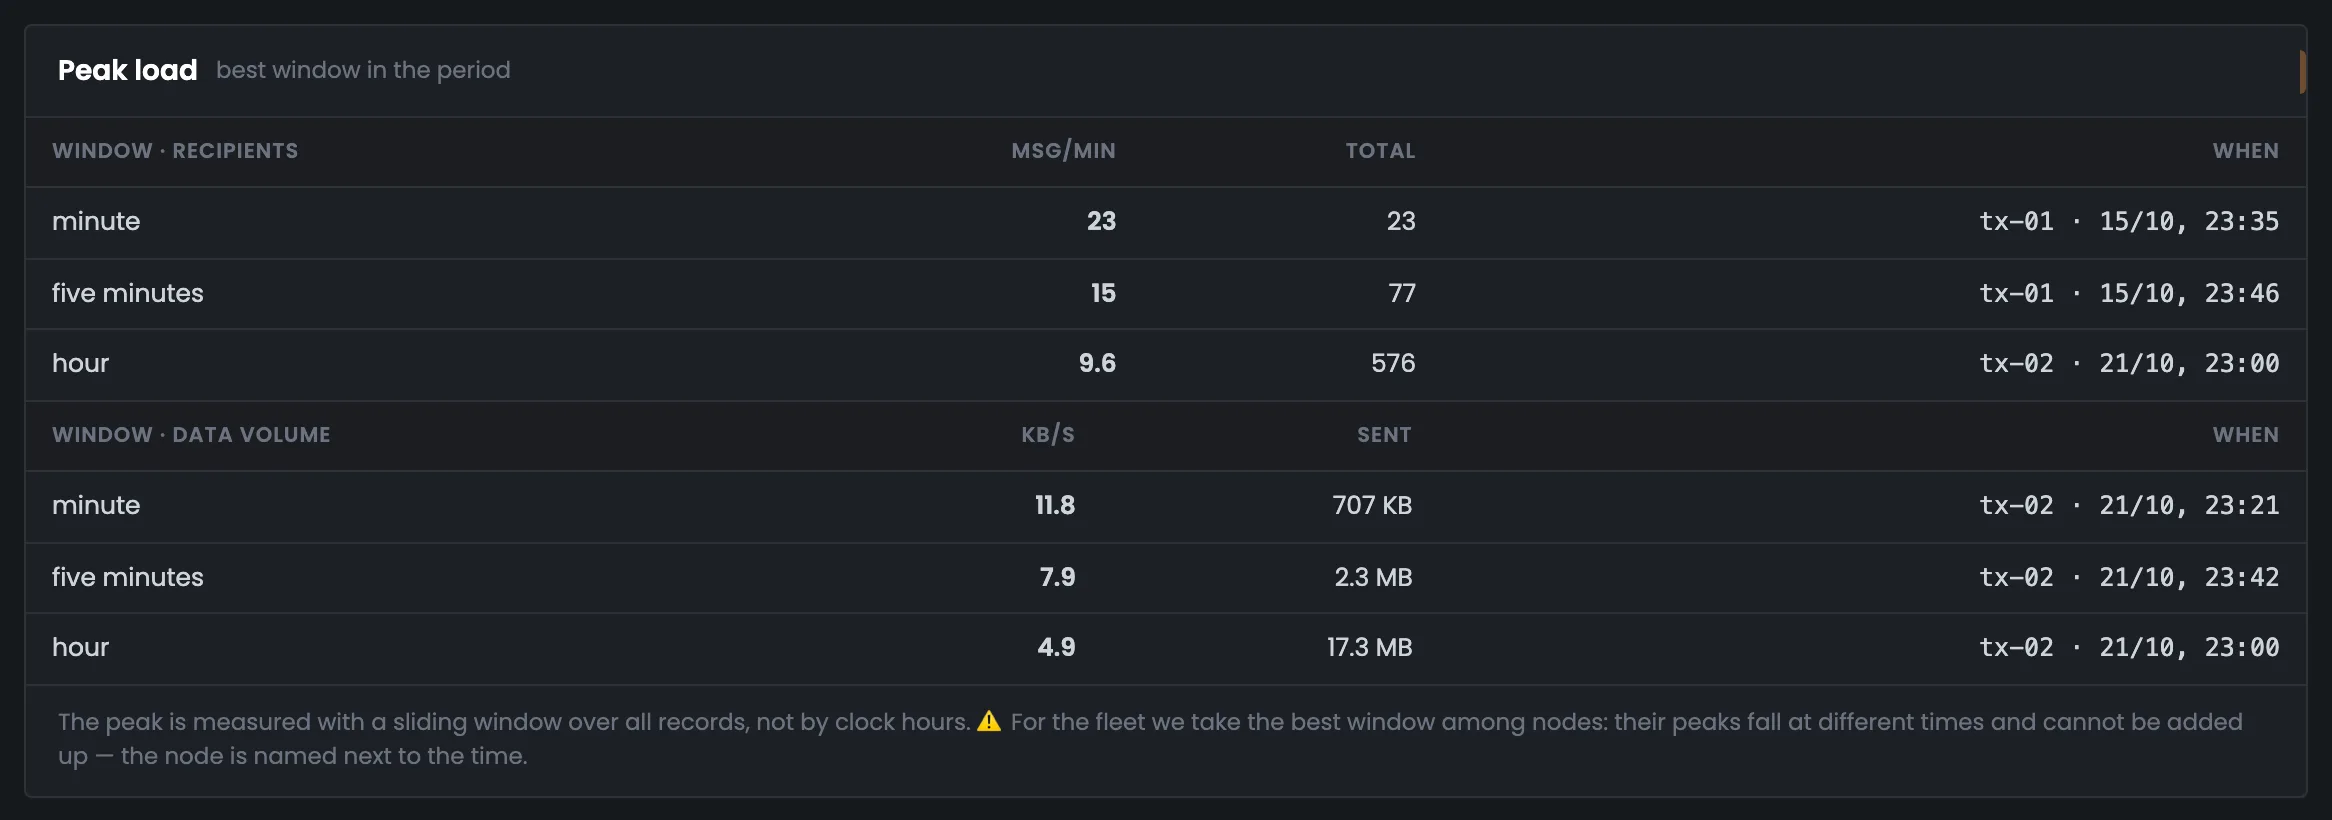
Peaks on different servers happen at different times, so you can't add them up. That's why the screen shows the best stretch of a single server — and names it: tx-01, Oct 15 at 23:35.
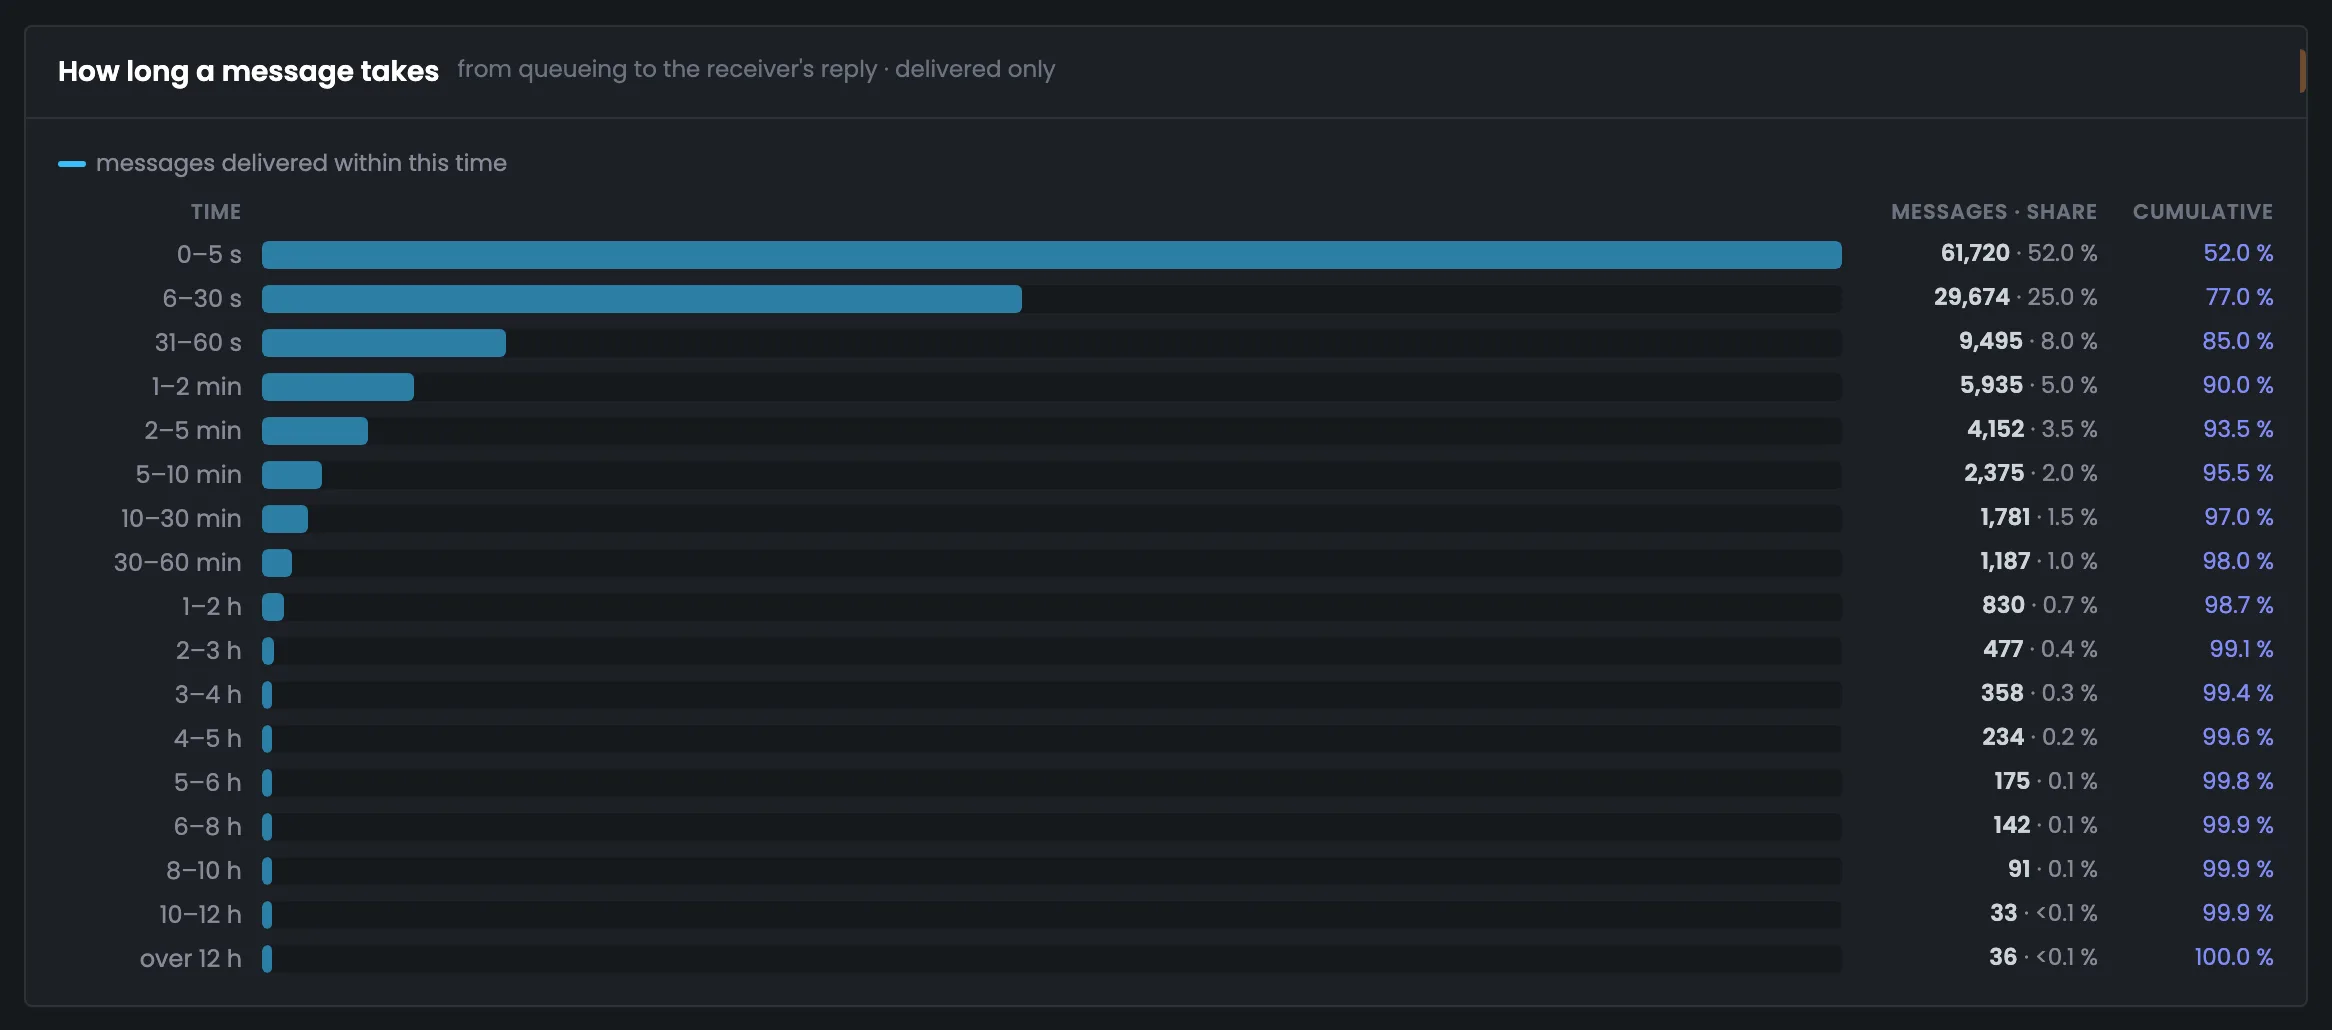
52% of messages arrived within five seconds, 77% within half a minute, 90% within two minutes, 98% within an hour. 99% made it within 2:45:10, and 36 messages took more than 12 hours.
03 / Bounces, domains and vMTAs
Bounces are broken down by code type and by reason group, and the most frequent mailbox provider replies are shown untranslated: you search for them to find the cause and quote them to your hosting provider. Here you also see the real recipient domains and the vMTA sending points — each with its own bounce rate.
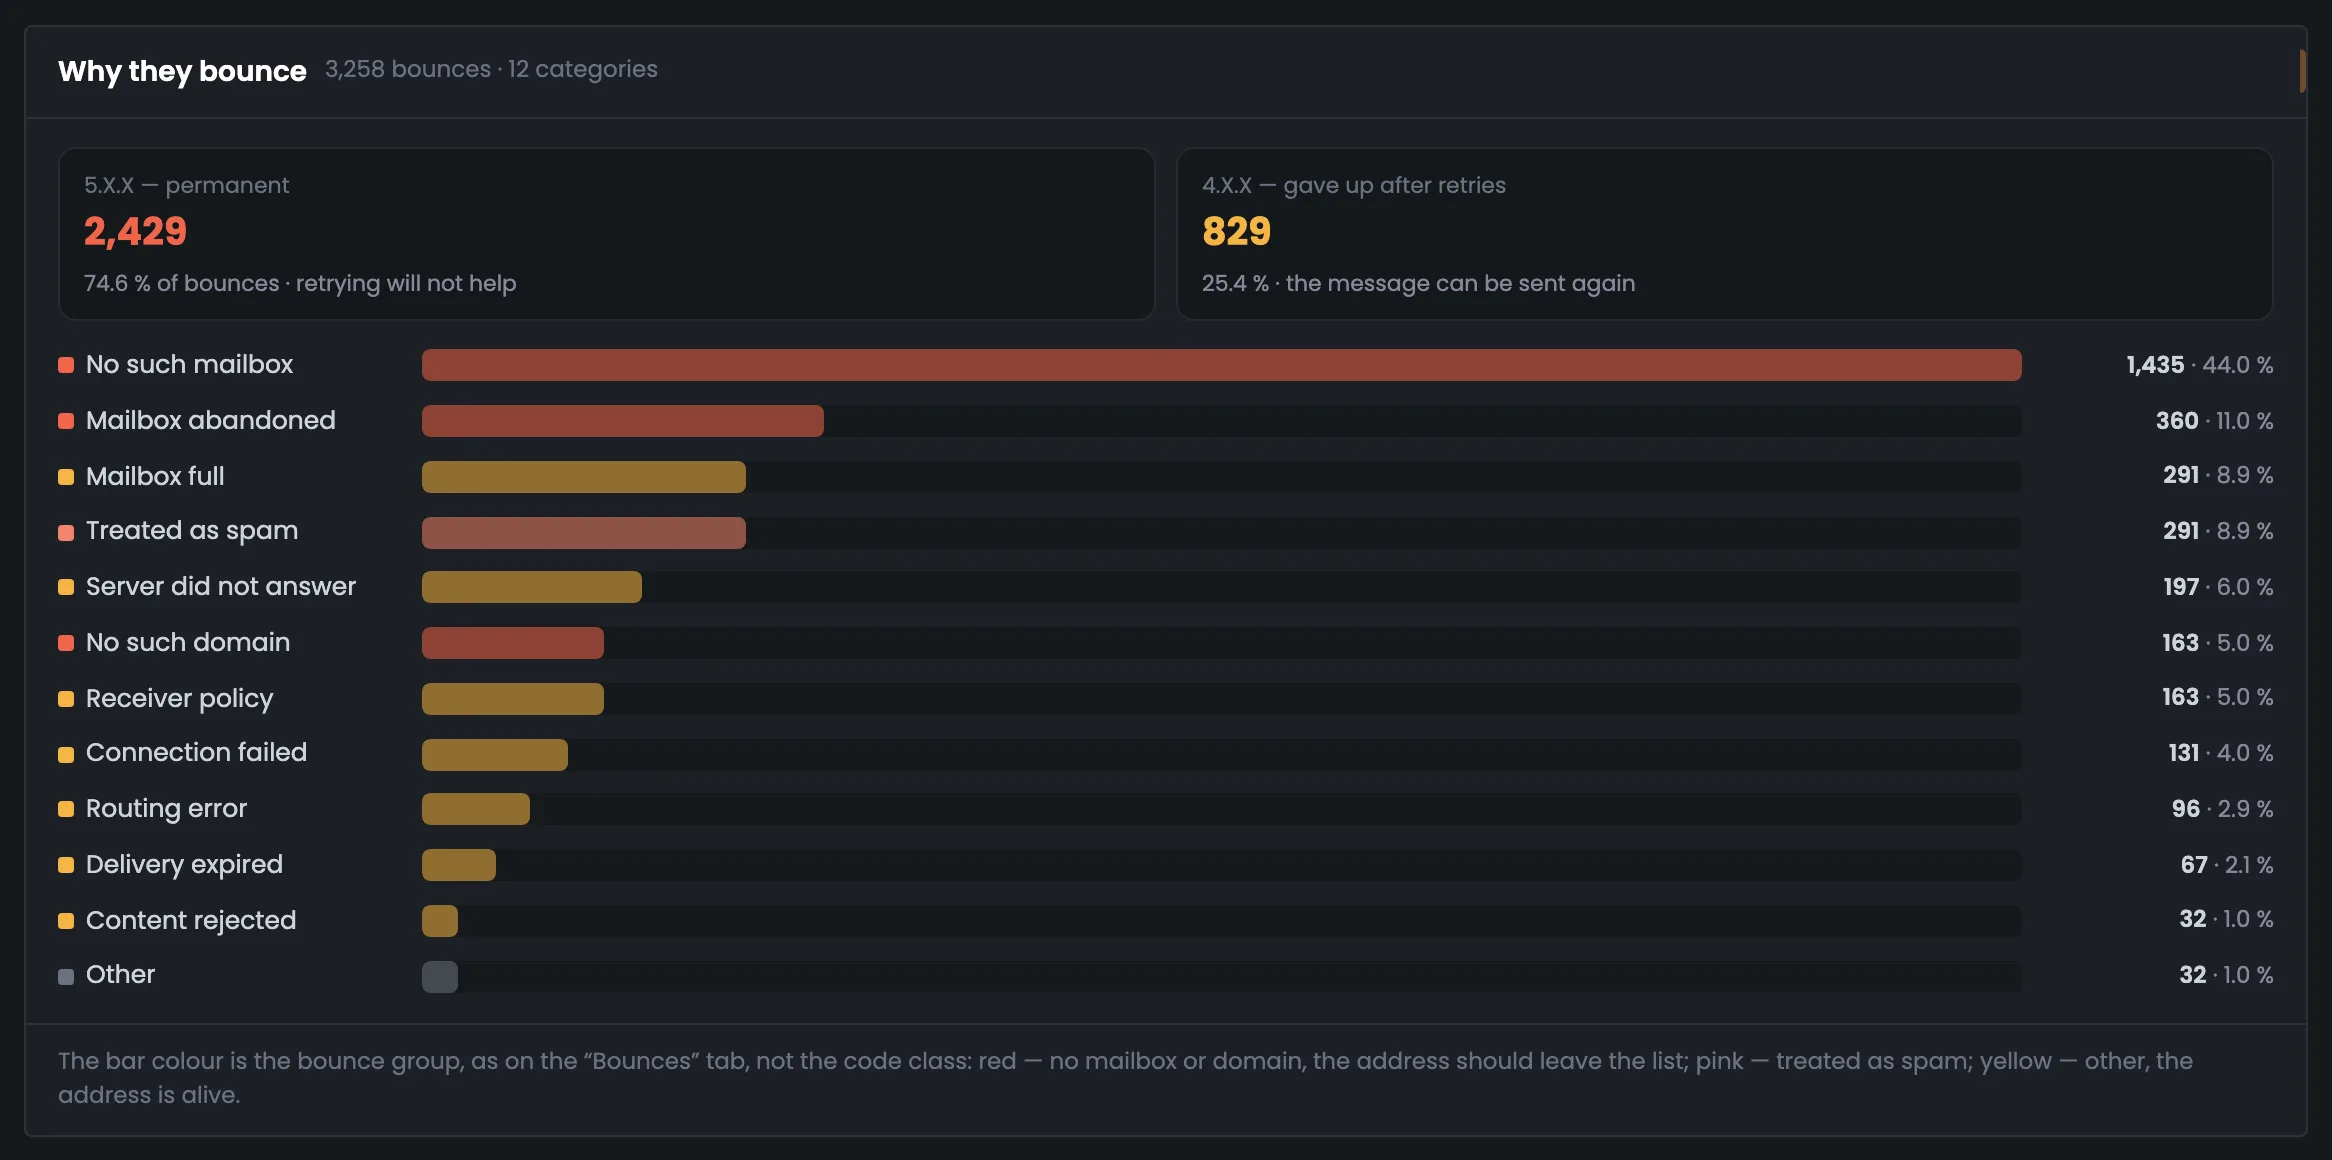
Permanent: retrying won't help. 4.X.X — 25.4%: the MTA stopped retrying, and the message can be sent again.
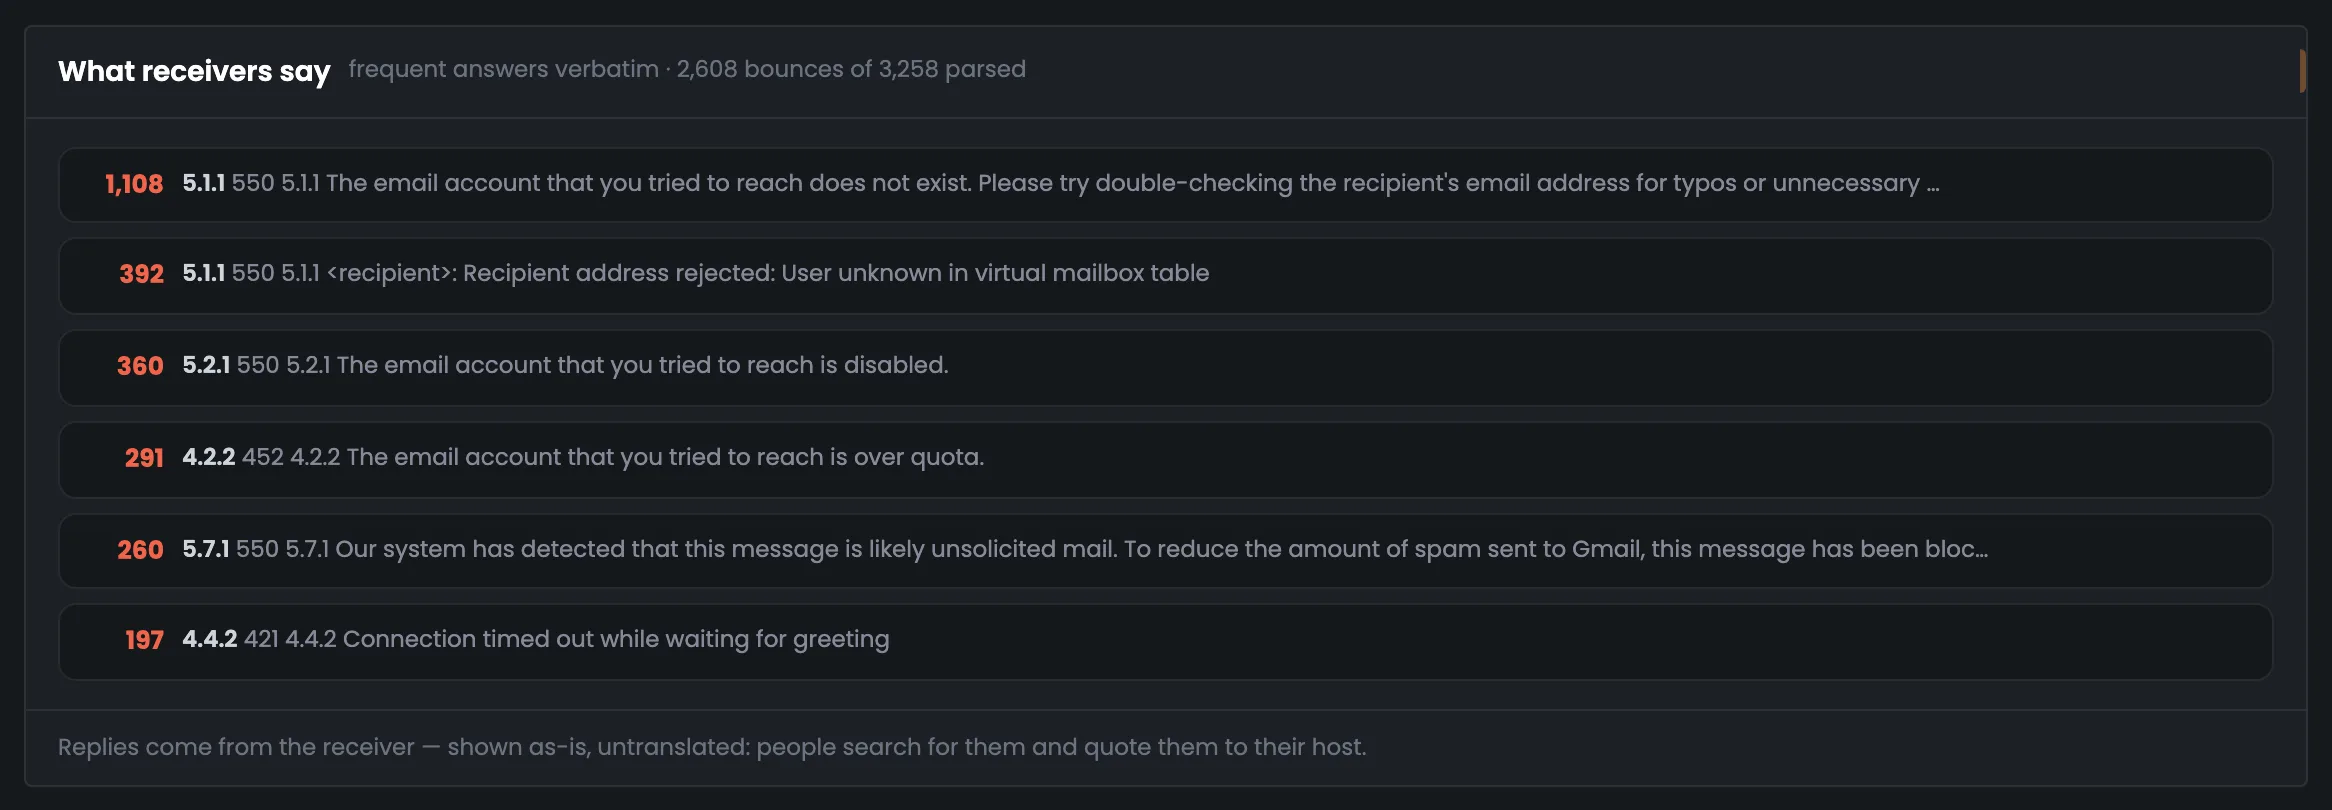
“The email account that you tried to reach does not exist” — word for word, untranslated.
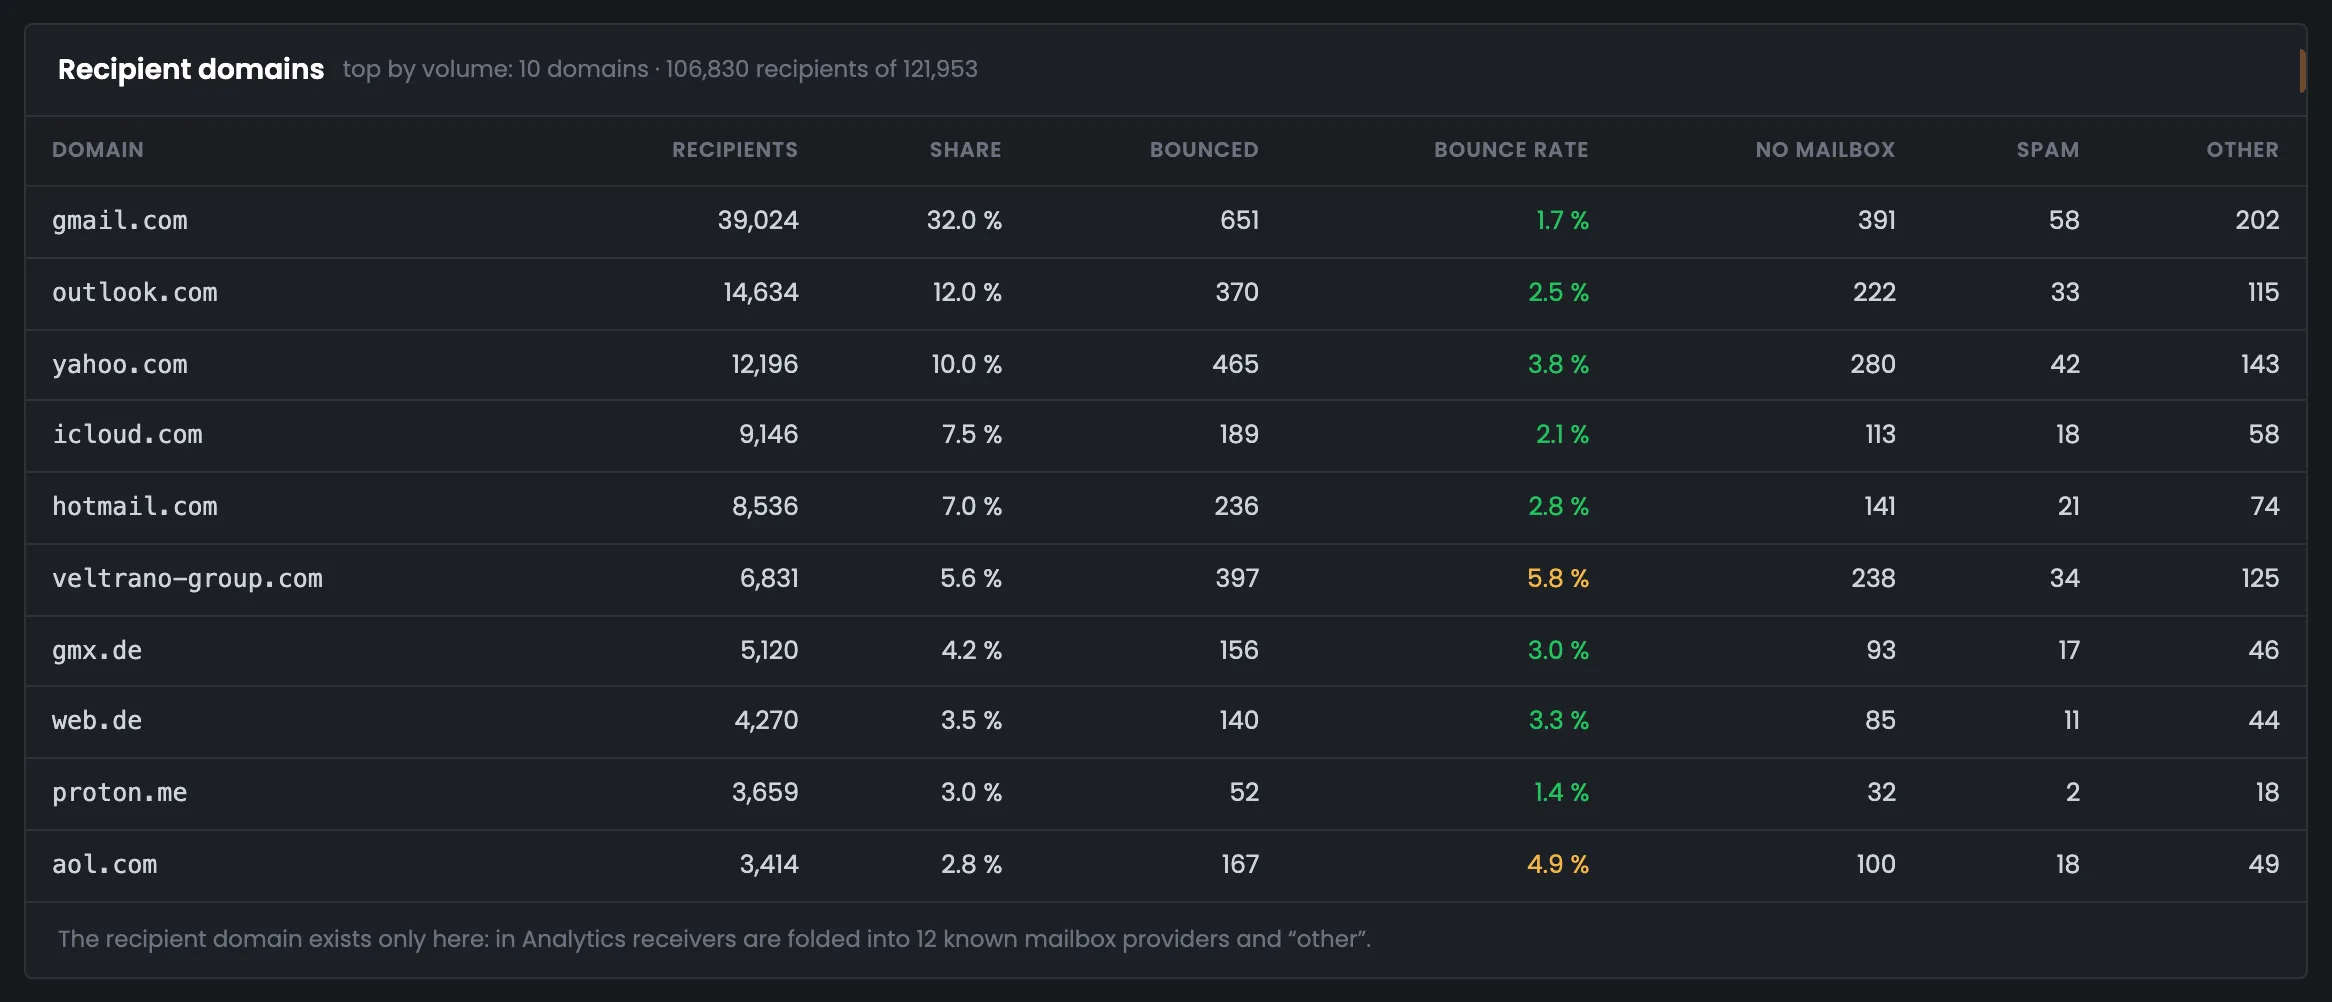
A customer's corporate domain: 6,831 recipients, 5.8% bounced — in yellow. You won't see it in “Analytics”.
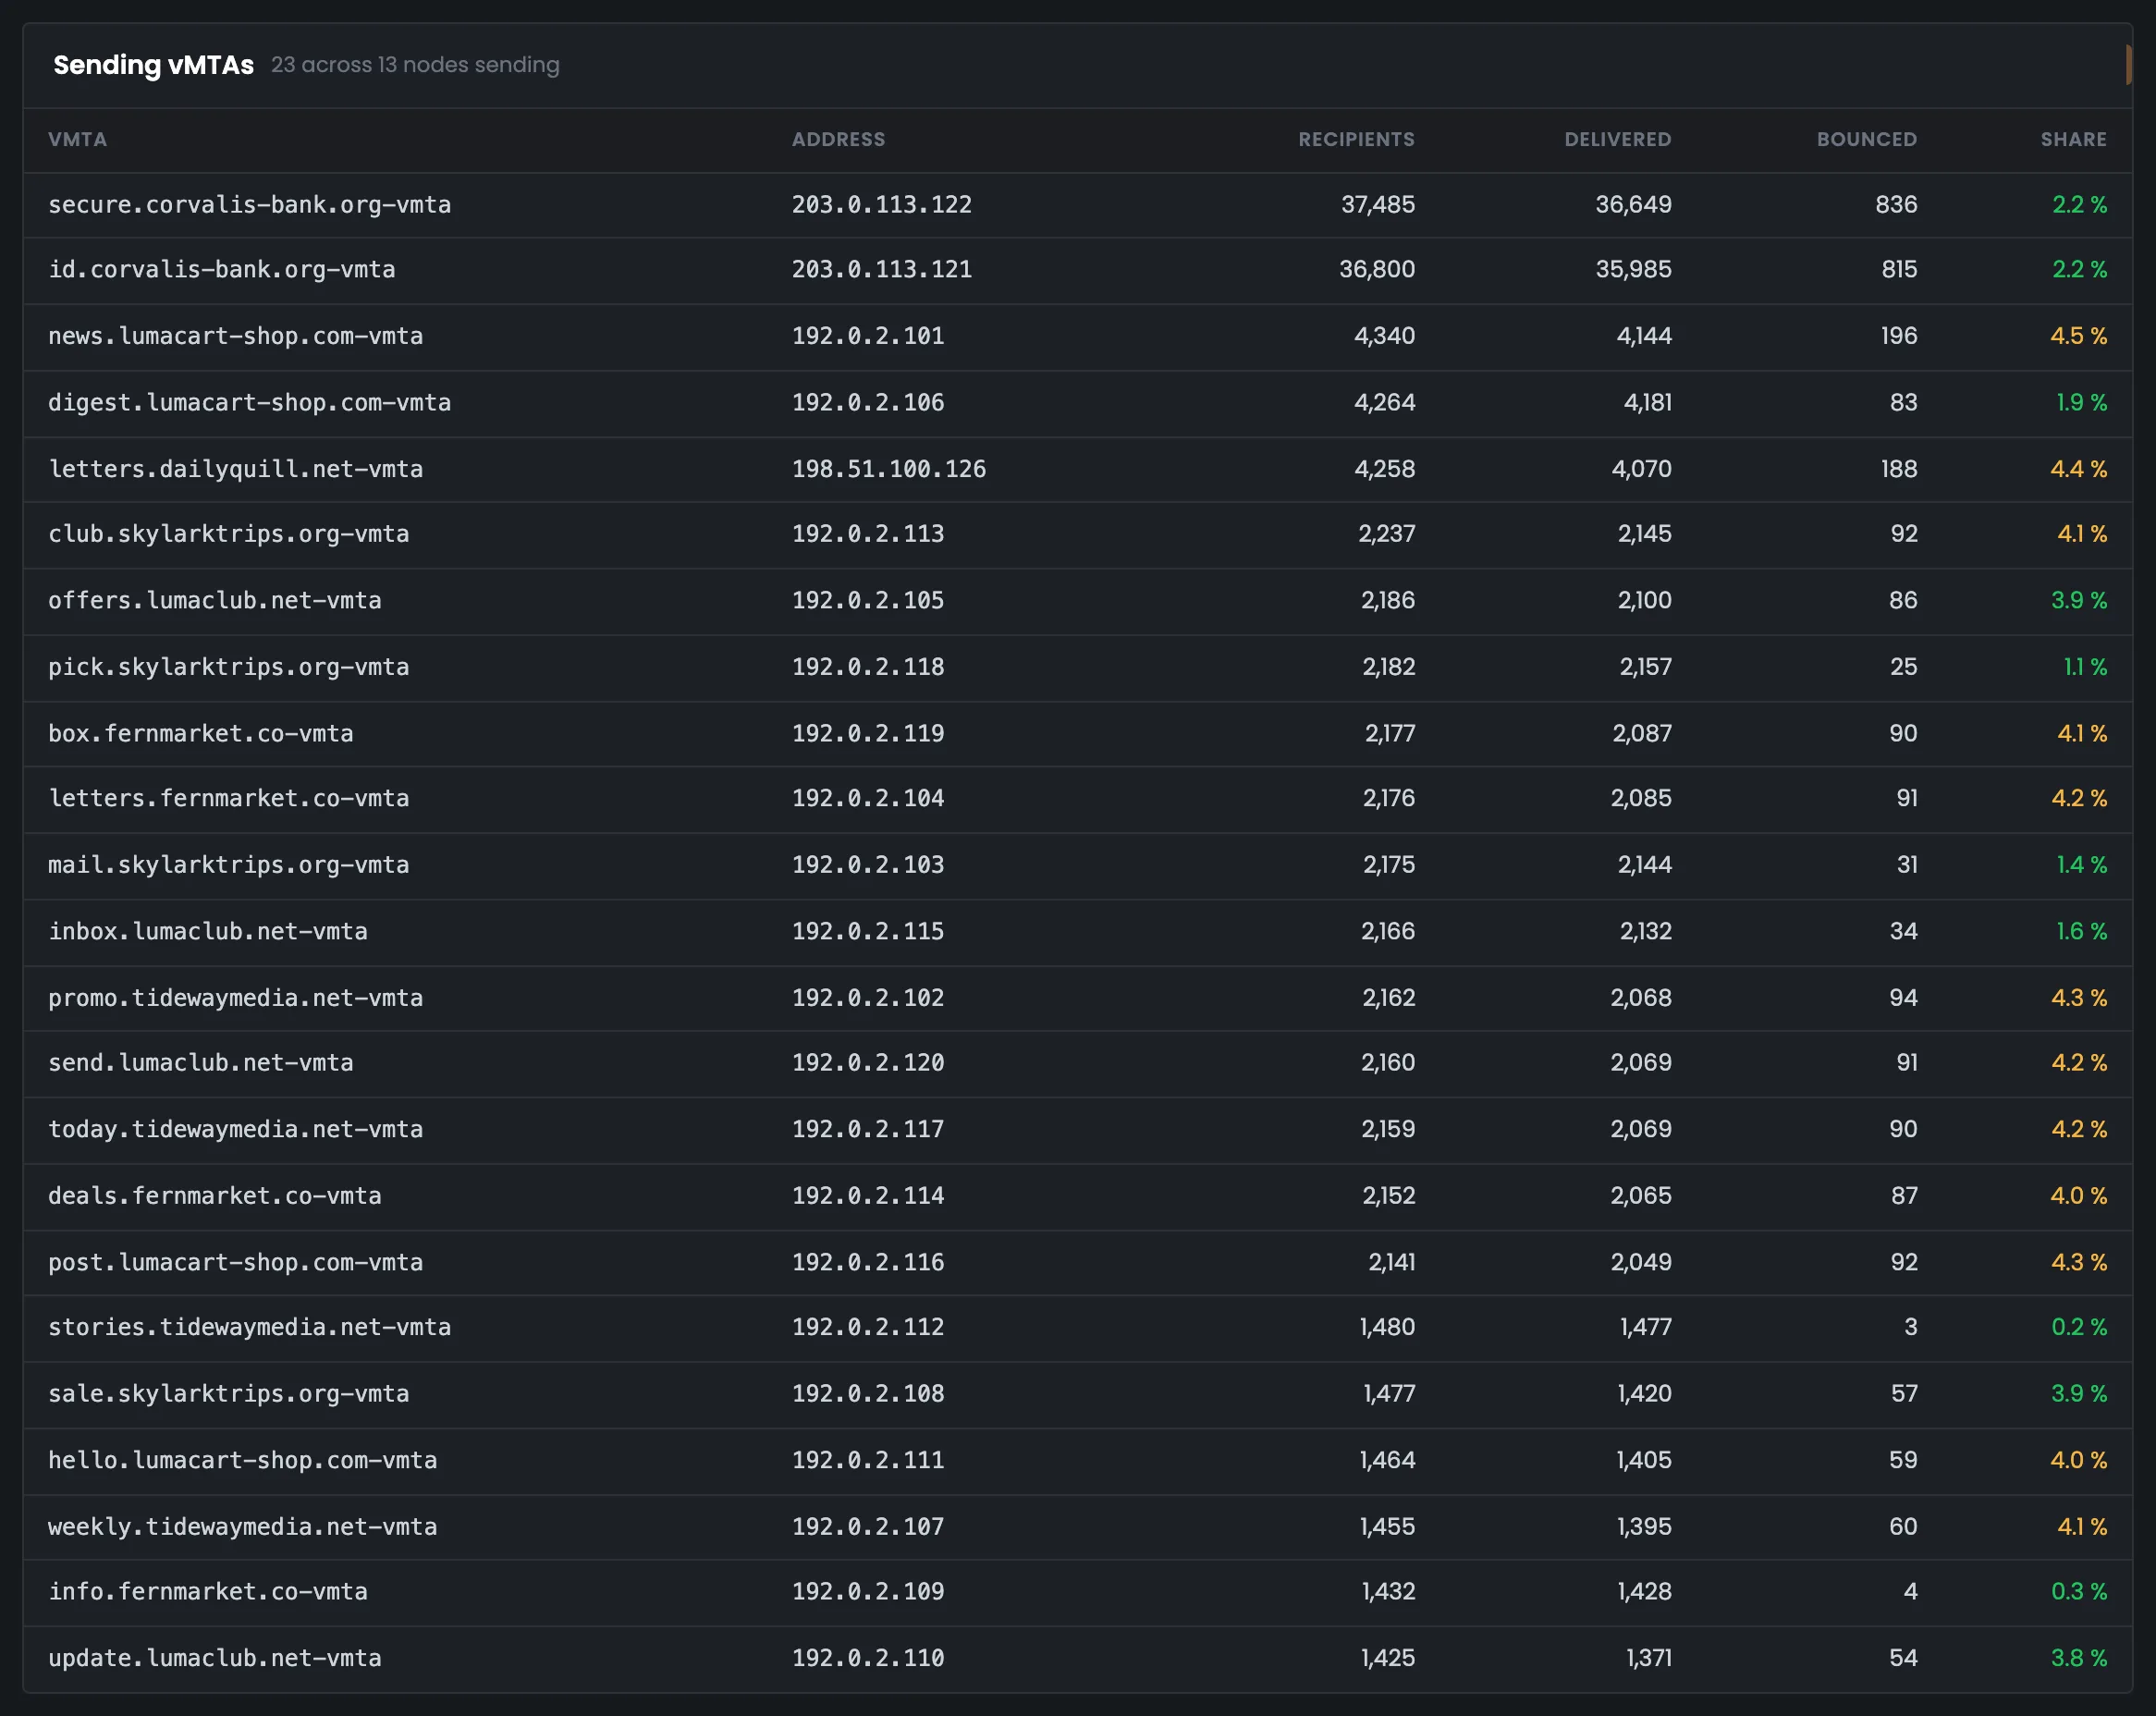
The bank's two points — 37 thousand recipients each and 2.2% bounced.
The color of a bounce bar shows the group, not the code type: red — no such mailbox or domain, pink — spam, yellow — other, the address exists.
04 / Comparing with “Analytics”
The numbers in PowerMTA statistics and in “Analytics” differ, and the last block of the page explains exactly why. There are three reasons: different data, different retention and messages removed from the queue. Both sides are right — they count different things.
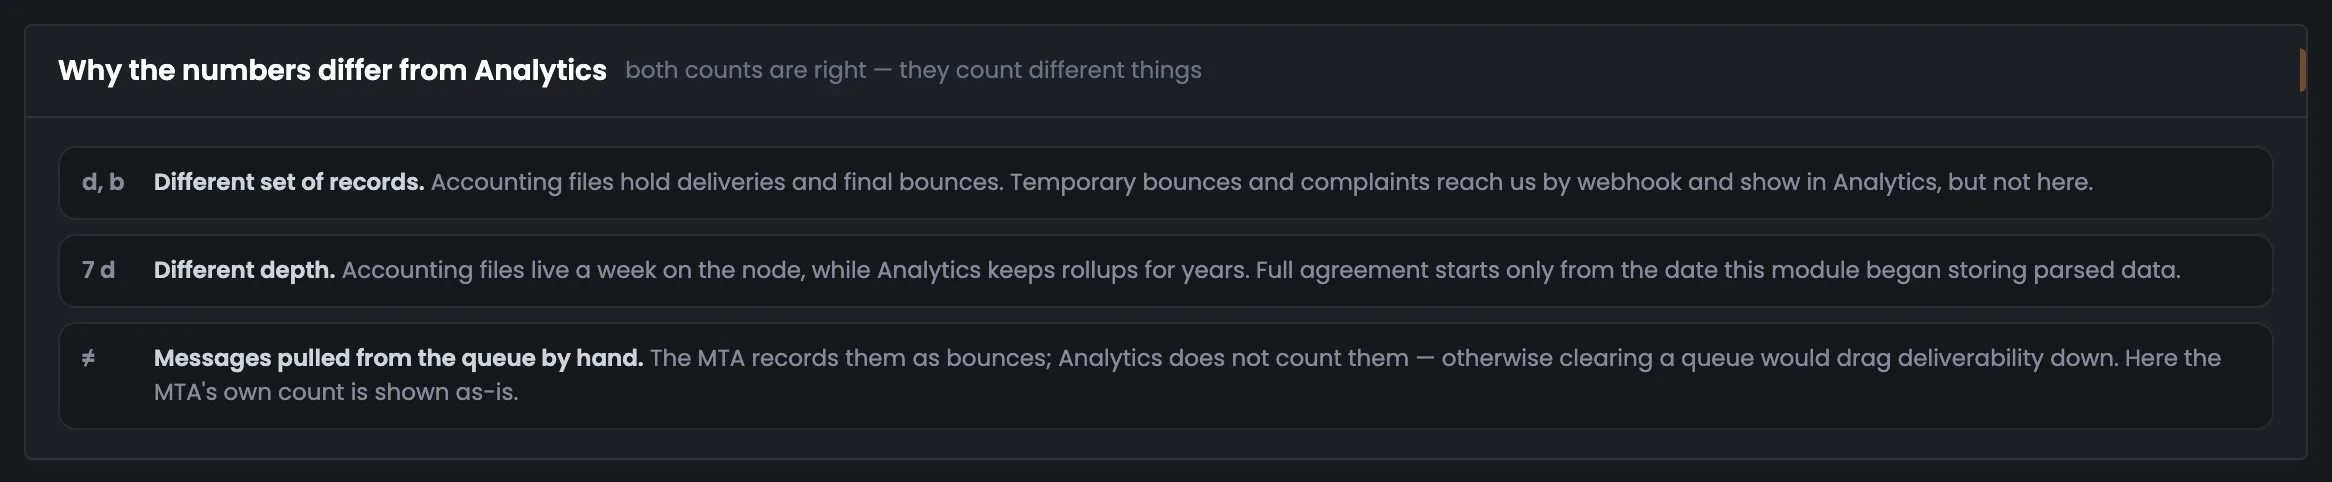
The accounting file holds deliveries and permanent bounces. Temporary bounces and complaints arrive by webhook and show up in “Analytics”.
Accounting files live on the server for a week; “Analytics” keeps totals for years.
The MTA records them as bounces, “Analytics” doesn't count them — otherwise clearing a queue would drag deliverability down.
05 / The interface in detail
Data window, key figures, days, peak, delivery curve, bounces, mailbox provider replies, domains, vMTAs and the comparison with “Analytics”. Above each screenshot: why the screen matters. Below it: what it shows.
The page starts with the data window: what period the PowerMTA accounting covers and whether you can treat it as fresh. Next come the five key figures of the week and a chart of deliveries and bounces by day. The group ends with peak load, with the server named, and a breakdown of delivery times. These screens tell you in a minute how the week of sending went.
The data window shows what period the PowerMTA accounting covers: from the first accepted message to the last mailbox provider reply. Look at this screen first, before trusting the numbers below: it also says how many servers have data and whether the last collection went through. In the example the window is 7 days 2 hours, 13 of 15 servers have data, and the collection on Oct 23 at 00:21 was not accepted, so the earlier data is shown. You look for the reason a collection failed on the “Collection runs” tab. Open this screen when the numbers look odd or out of date: if a collection failed, the other screens show the previous week, not fresh data.
 Enlarge
Collection details are on the “Collection runs” tab.
Five tiles hold the key figures of the week of sending: how many recipients, what share of messages was delivered, how many bounced, the median delivery time and peak load. It's the short answer to “how did the week go” — handy to open first and show to a customer. “Delivered” and “Bounced” are colored by bounce-rate thresholds: under 4% — green, from 4% — yellow, from 6% — red. In the example both tiles are green: 2.7% bounced. If a tile turns yellow or red, the next step is the bounce screen below and the “Bounces” tab: there you see whether the mailboxes don't exist or the messages were taken for spam. The peak is shown together with its server — tx-01, Oct 15 at 23:35.
 Enlarge
“Delivered” and “Bounced” are green: the bounce rate is under 4%.
The daily chart shows how deliveries and bounces changed over the eight days of the period: the bars are delivered messages and bounces, the line is the bounce rate with its own scale on the right. It shows on which day sending went worse and whether bounces spiked. Days are built in your profile's time zone, and incomplete days at the edges of the period are shown paler and never count as the best or worst day. In the example the bounce rate is steady — from 2.5 to 2.7% on full days. The best day here is Oct 19 with 2.5% bounced, the worst is Oct 16 with 2.7%. If days differ noticeably, look for the cause on the bounce and domain screens below.
 Enlarge
Incomplete days don't count as the best or worst.
Peak load is the busiest stretch of the period: per minute, per five minutes and per hour. The Hub finds it across every record of the accounting file, not by whole clock hours, so a short burst doesn't get lost in an hourly average. The screen shows how many messages a server pushes through at the busiest moments of sending — it shows the real load. Peaks on different servers happen at different times and don't add up, so each row names its server: by number of messages — tx-01, by volume — tx-02. By volume, tx-02 leads in the example: 11.8 KB/s for a minute and 17.3 MB in an hour on Oct 21. A detailed look at speed is on the delivery speed tab.
 Enlarge
Server peaks happen at different times and don't add up, so each row names its server.
This screen shows how long it takes a message to reach the recipient: the time from entering the queue to the mailbox provider's reply, for delivered messages only. A single average is misleading here, so you see the whole breakdown by interval with a running total. In the example 52% of messages arrived within five seconds, 90% within two minutes, 98% within an hour. The tail of slow deliveries — 36 messages took more than 12 hours — hints that some messages get stuck in the queue; a detailed look is on the delivery speed tab. Open this screen when recipients complain that messages arrive late: it shows what share arrived quickly and what share took hours.
 Enlarge
The “Cumulative” column reaches 100% only on the last row, and 33 messages are shown as “<0.1%”, not “0.0%”.
Bounces are broken down by code type — permanent 5.X.X and temporary 4.X.X — and by reason group. Next to them are the most frequent mailbox provider replies, word for word, untranslated. From here it's clear what to clean up in your list and what to discuss with your hosting provider. A detailed look is on the “Bounces” tab.
The bounce screen answers the question of why messages didn't arrive. 3,258 bounces are broken down by code type: permanent 5.X.X, where retrying won't help, and temporary 4.X.X, after which the MTA stopped retrying — such a message can be sent again. Below are the reason groups: no such mailbox, mailbox abandoned, mailbox full, taken for spam and others. If “no mailbox” is a large share, it's time to clean your list; if “spam” is growing, look into your reputation and message content. Look at the top groups first: in the example “no mailbox” is 44.0% of all bounces. The bar color shows the group, not the code type: red — no such mailbox or domain, pink — spam.
 Enlarge
The bar color shows the bounce group, not the code type.
Here are the six most frequent mailbox provider replies, word for word, untranslated: they account for 2,608 of 3,258 bounces. You need the exact reply line to find the cause in the provider's help pages and quote it to your hosting provider. For example, 5.1.1 “…does not exist” — 1,108 times — means the address doesn't exist and should be removed from your list, while 5.7.1 from Gmail “likely unsolicited mail” — 260 times — means Gmail considered the messages unwanted. Start with the top rows: they make up most of the bounces. A detailed look at each category by reply text and by domain is on the “Bounces” tab, where replies are grouped by the MTA's own categories.
 Enlarge
Untranslated: people search for these lines and quote them to the hosting provider.
At the end — who the mail went to and where it was sent from: the top ten recipient domains and all vMTA sending points with their bounce rates. The last screen explains why the numbers here differ from “Analytics”. This way you see a problem with one customer or one sending point that would get lost in the overall totals.
The table shows the top ten recipient domains by volume — 106,830 of 121,953 recipients, each domain with its own bounce rate. It helps you spot a problem with a single domain: in “Analytics” recipients are grouped into 12 mailbox providers and “other”, while a customer's corporate domain is visible only here. In the example veltrano-group.com has 6,831 recipients and 5.8% bounced, and its row is highlighted in yellow. The “no mailbox”, “spam” and “other” columns immediately hint at why a domain's messages bounce. The full table of all domains, their delivery times and typos in your list such as gmail.con are on the “Domains” tab.
 Enlarge
In “Analytics” recipients are grouped into 12 mailbox providers and “other” — a customer's domain is visible only here.
The vMTA table shows every sending point — in the example 23 vMTAs on 13 servers — with the number of recipients and the bounce rate for each. You use it to compare sending addresses with each other and find the point that performs worse than the rest. The rate is colored by the same thresholds as the tiles above: from 4% — yellow, from 6% — red. In the example the bank's two points sent to 37 thousand recipients each with 2.2% bounced, while letters.dailyquill.net-vmta has 4,258 recipients and 4.4%, and its row is yellow. If one point is noticeably worse than the others with the same list, you dig into it on the “vMTA” tab: there you see its days, worst domains and hourly maps.
 Enlarge
The rate is colored by the same thresholds as the tiles.
The last block explains why the PowerMTA statistics don't match “Analytics” — the first question that comes up when you compare the two screens. There are three reasons: different data, different retention and messages removed from the queue by hand. The accounting file holds a week of deliveries and permanent bounces, while “Analytics” receives temporary bounces and complaints by webhook and keeps totals for years. The bottom line: both counts are correct, and the difference doesn't mean the data is wrong. This screen is handy to show a customer or a colleague who is comparing the two reports. Temporary bounces, complaints and totals over the years are in “Analytics”.
 Enlarge
Both counts are correct — they count different things.
06 / Questions about the statistics
In short: where the numbers come from, why the period is a week and why they differ from “Analytics”.
EnlargeThe peak is found with a sliding window across all records — and every row names its server.
A PowerMTA log (accounting) where the MTA records the outcome of each message: delivered or bounced, when, to whom and from which address.
On a schedule it logs in to the server over SSH, parses the files with the PowerMTA report utility and saves the slices after checking that they add up to the total.
Accounting files are kept on the server for a week. Totals over the years are in “Analytics”.
The MTA writes the outcome to the accounting file, not every attempt. Temporary bounces and complaints arrive by webhook and are visible in “Analytics”.
Peaks on different servers happen at different times, so you can't add them up. That's why the best stretch of a single server is shown.
The screen says so and shows the earlier data instead of passing it off as fresh.
People search for these lines to find the cause and quote them to the hosting provider — a translation would get in the way.
Each server's time is converted to UTC using its own time zone, and days are built in your profile's time zone.
07 / Next step
The overview shows the whole week of sending. The details are on the statistics tabs: bounces, domains, vMTAs, delivery speed and collection runs.
Temporary bounces, complaints and totals over the years are in “Analytics”.