No mailbox
To suppressionNo such mailbox, no such domain — retrying is pointless. These addresses go to the suppression list and are never mailed again.
MMailbox provider
reply
No mailbox2,152 bounces
to suppressionno more sending

Bounces from PowerMTA accounting files
Final bounces are the ones after which the MTA stopped trying. They are split not by code type but by reason: no such mailbox, taken for spam or something else.
A spam bounce comes with a 5.X.X code, yet the mailbox exists: only bounces where the mailbox doesn't exist go to the suppression list — the list of addresses you no longer send to.
01 / The bounce reason, not the code
The main question of this tab is what to do with a recipient address after a PowerMTA bounce. A 5.X.X code (hard bounce) means “forever”, but behind it there may be either a mailbox that doesn't exist or a spam rejection. That's why bounces are split by reason: only addresses where the mailbox doesn't exist go to the suppression list.
Only bounces where the mailbox doesn't exist go to the suppression list
No such mailbox, no such domain — retrying is pointless. These addresses go to the suppression list and are never mailed again.
A spam rejection and a full mailbox come with the same 5.X.X code, but the mailbox exists — you must not strike it from your list.
02 / Bounce categories
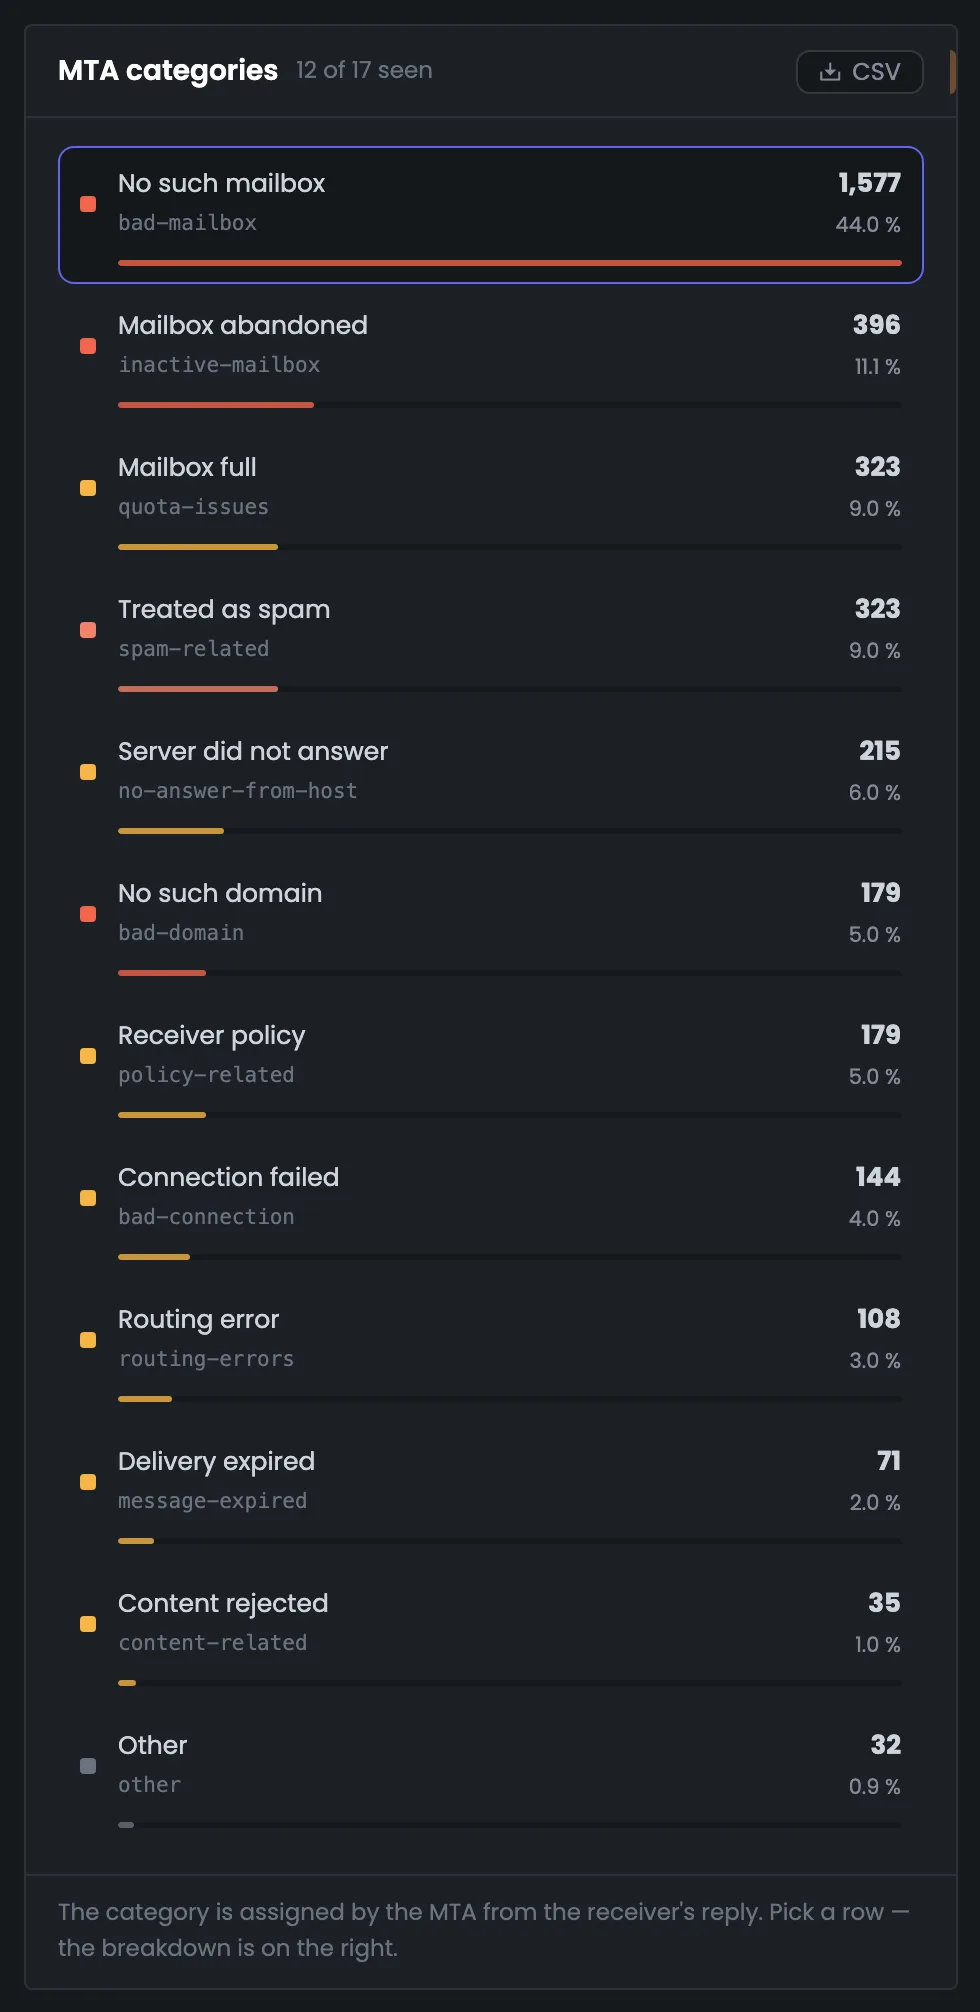
The Hub neither renames nor re-checks the bounce categories: the numbers match what you see in the accounting files on the server. 12 of the 17 categories the MTA knows came up. The biggest one is “no such mailbox”, 44.0% of all bounces.
The biggest group.
The owner hasn't logged in for a long time.
The mailbox exists — don't remove the address.
Then — no such domain, mailbox provider policy and others.
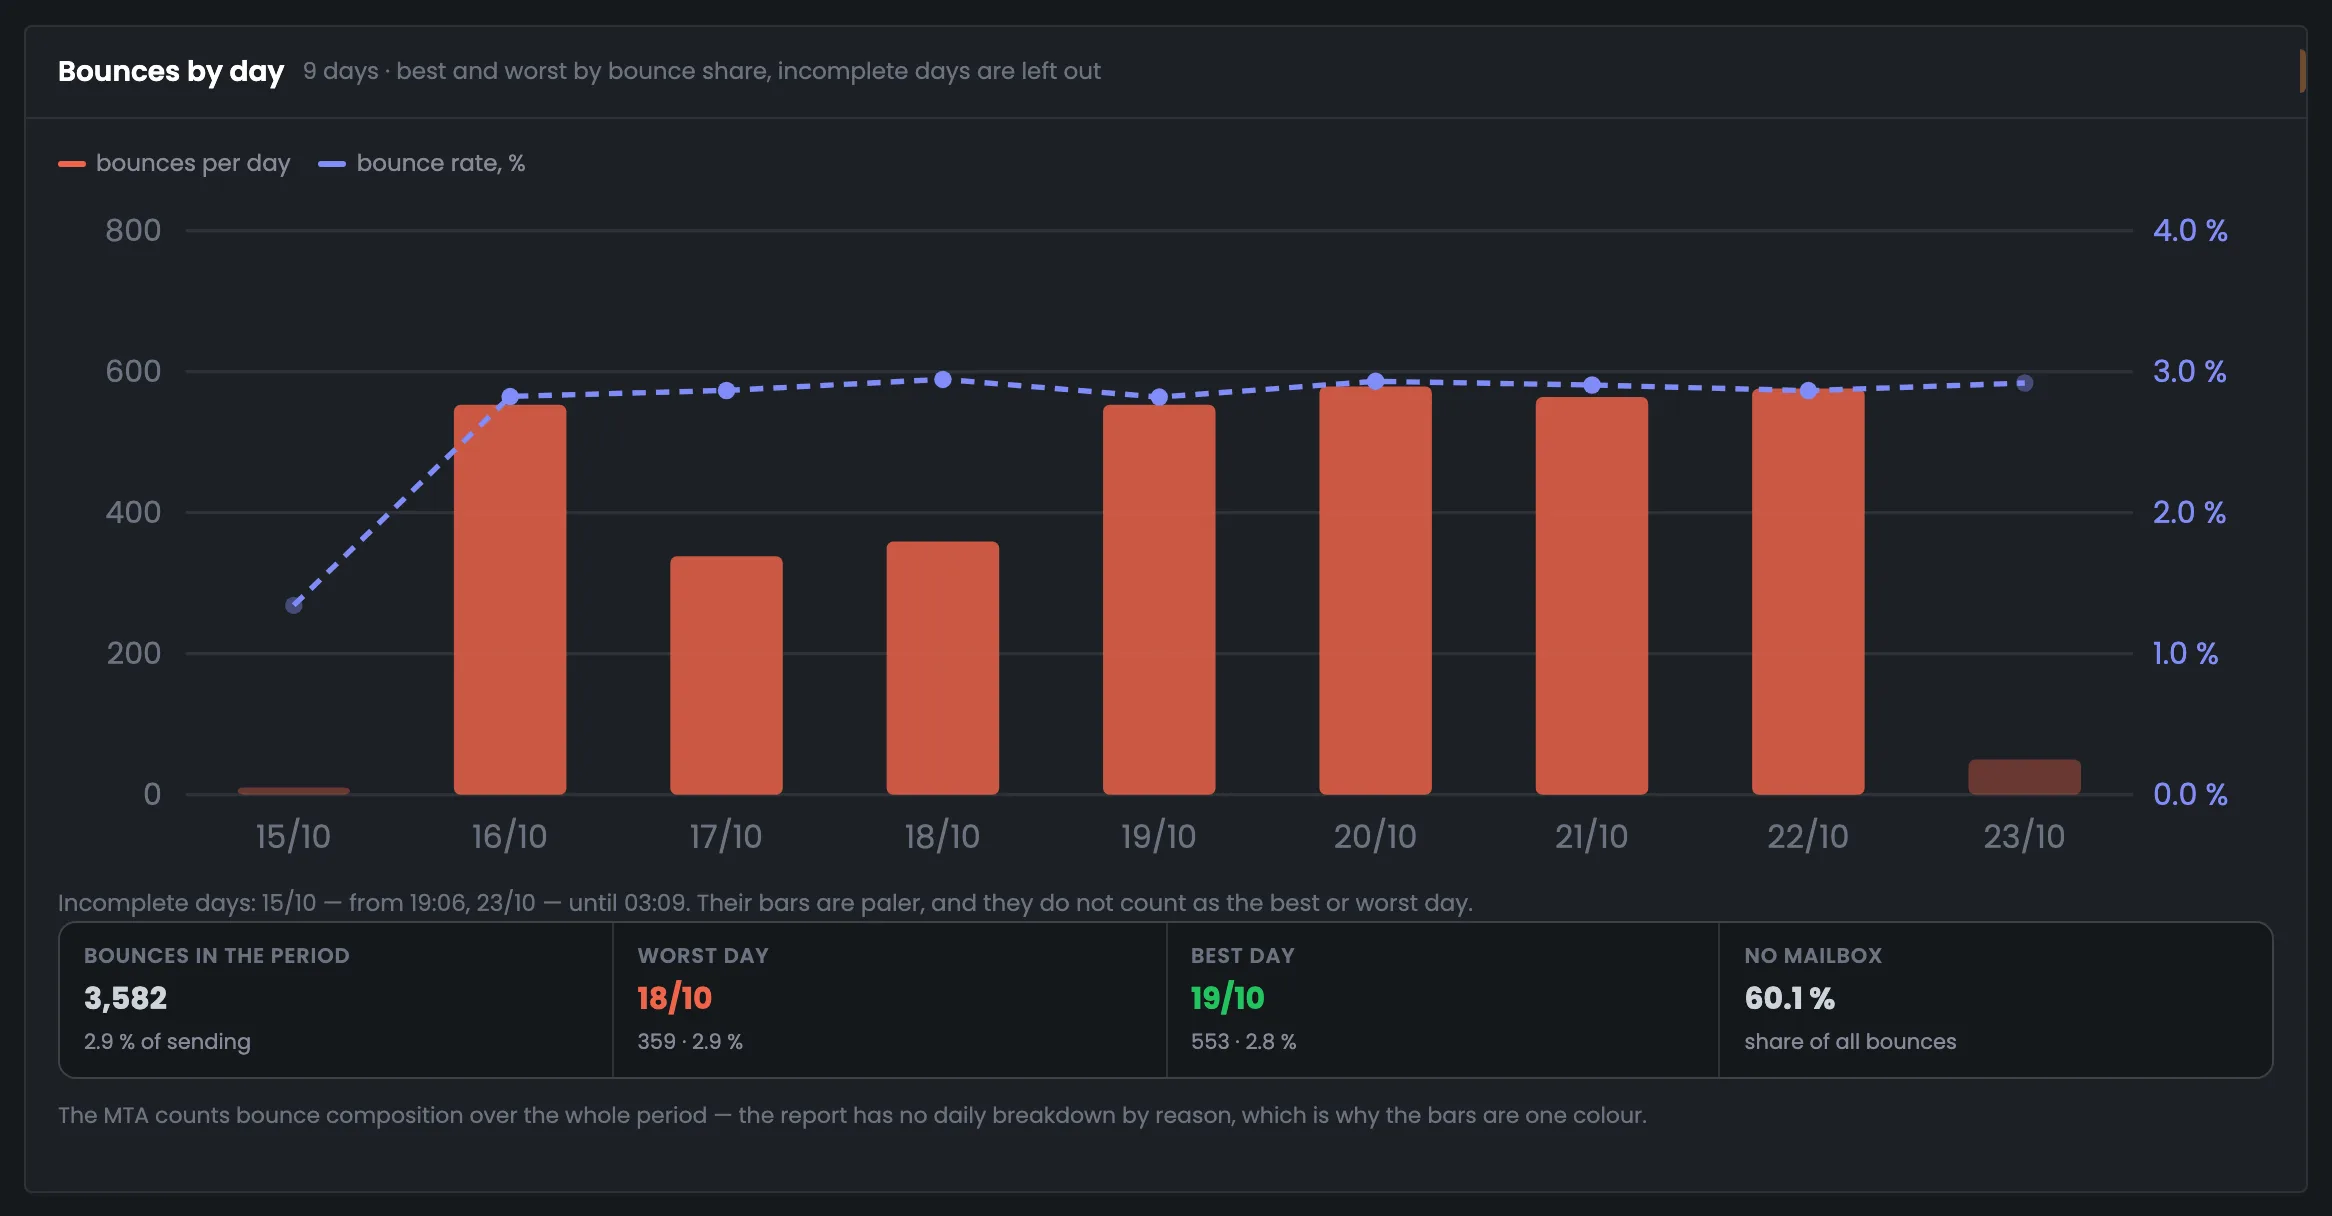
The daily bounce rate has its own scale. Incomplete days at the edges of the period are paler and never count as the best or worst day.
03 / Mailbox provider replies
Each bounce category can be broken down by reply text, by domain and by “text × domain” pairs. Replies are not translated: you use the exact line to look up the cause in the provider's documentation and quote it to your hosting provider.
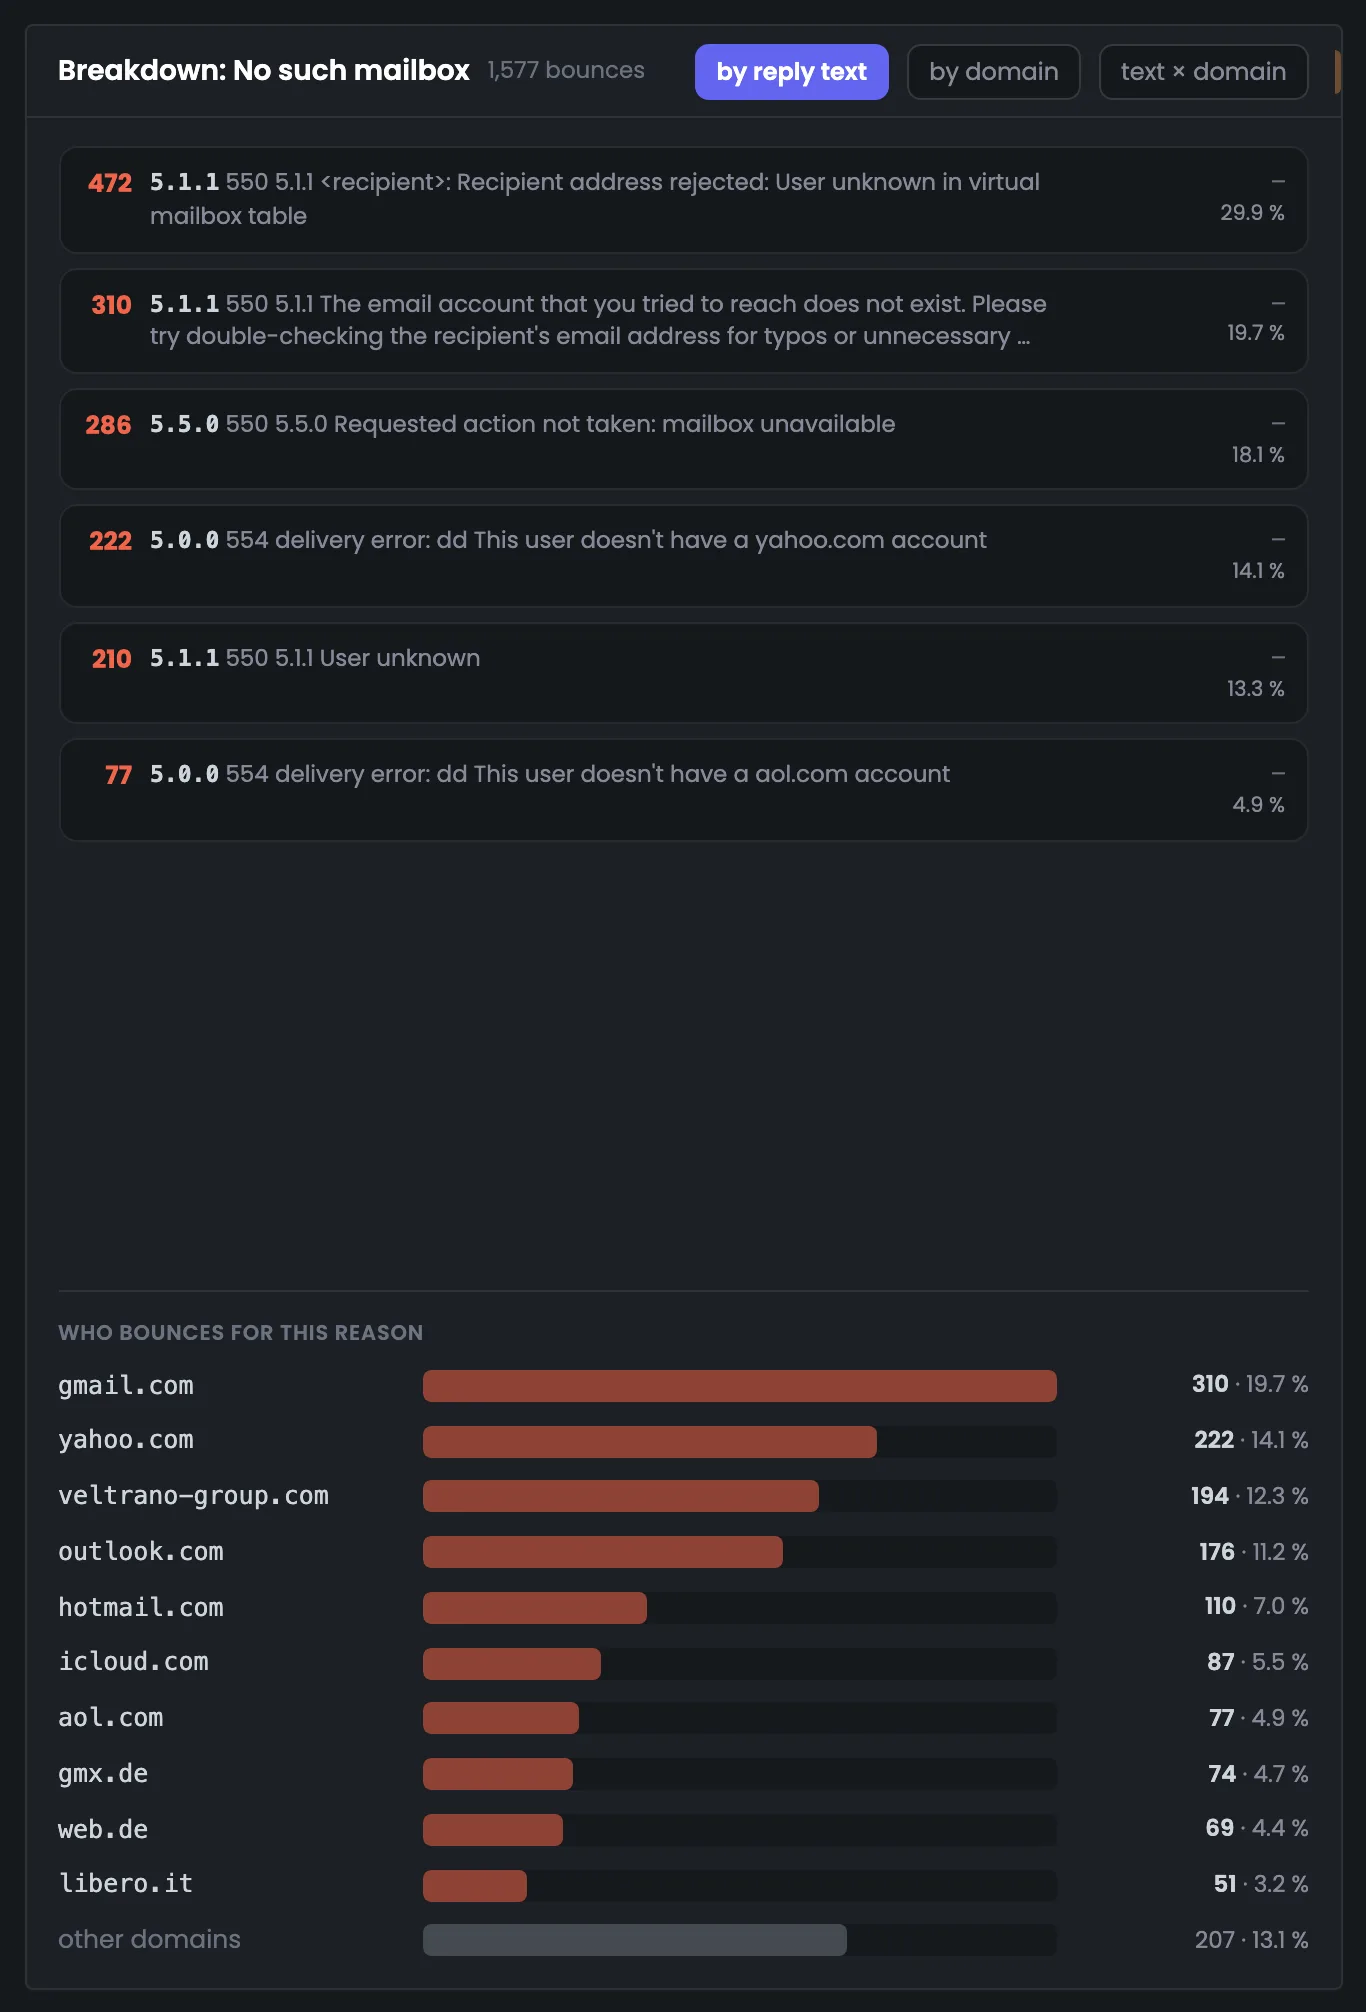
“No such mailbox” is 1,577 bounces, but providers word it differently: “User unknown in virtual mailbox table” — 472, Gmail “…does not exist” — 310, Microsoft “mailbox unavailable” — 286.
Below are the domains in the same category: gmail.com — 310, yahoo.com — 222, the corporate veltrano-group.com — 194, outlook.com — 176.
04 / Domains and vMTAs
The domain and vMTA tables split bounces into “no mailbox”, “spam” and “other”. Each vMTA names the domain with the highest bounce rate — among its domains with enough volume. This shows where the problem is: in the sending address or in the recipient domain.
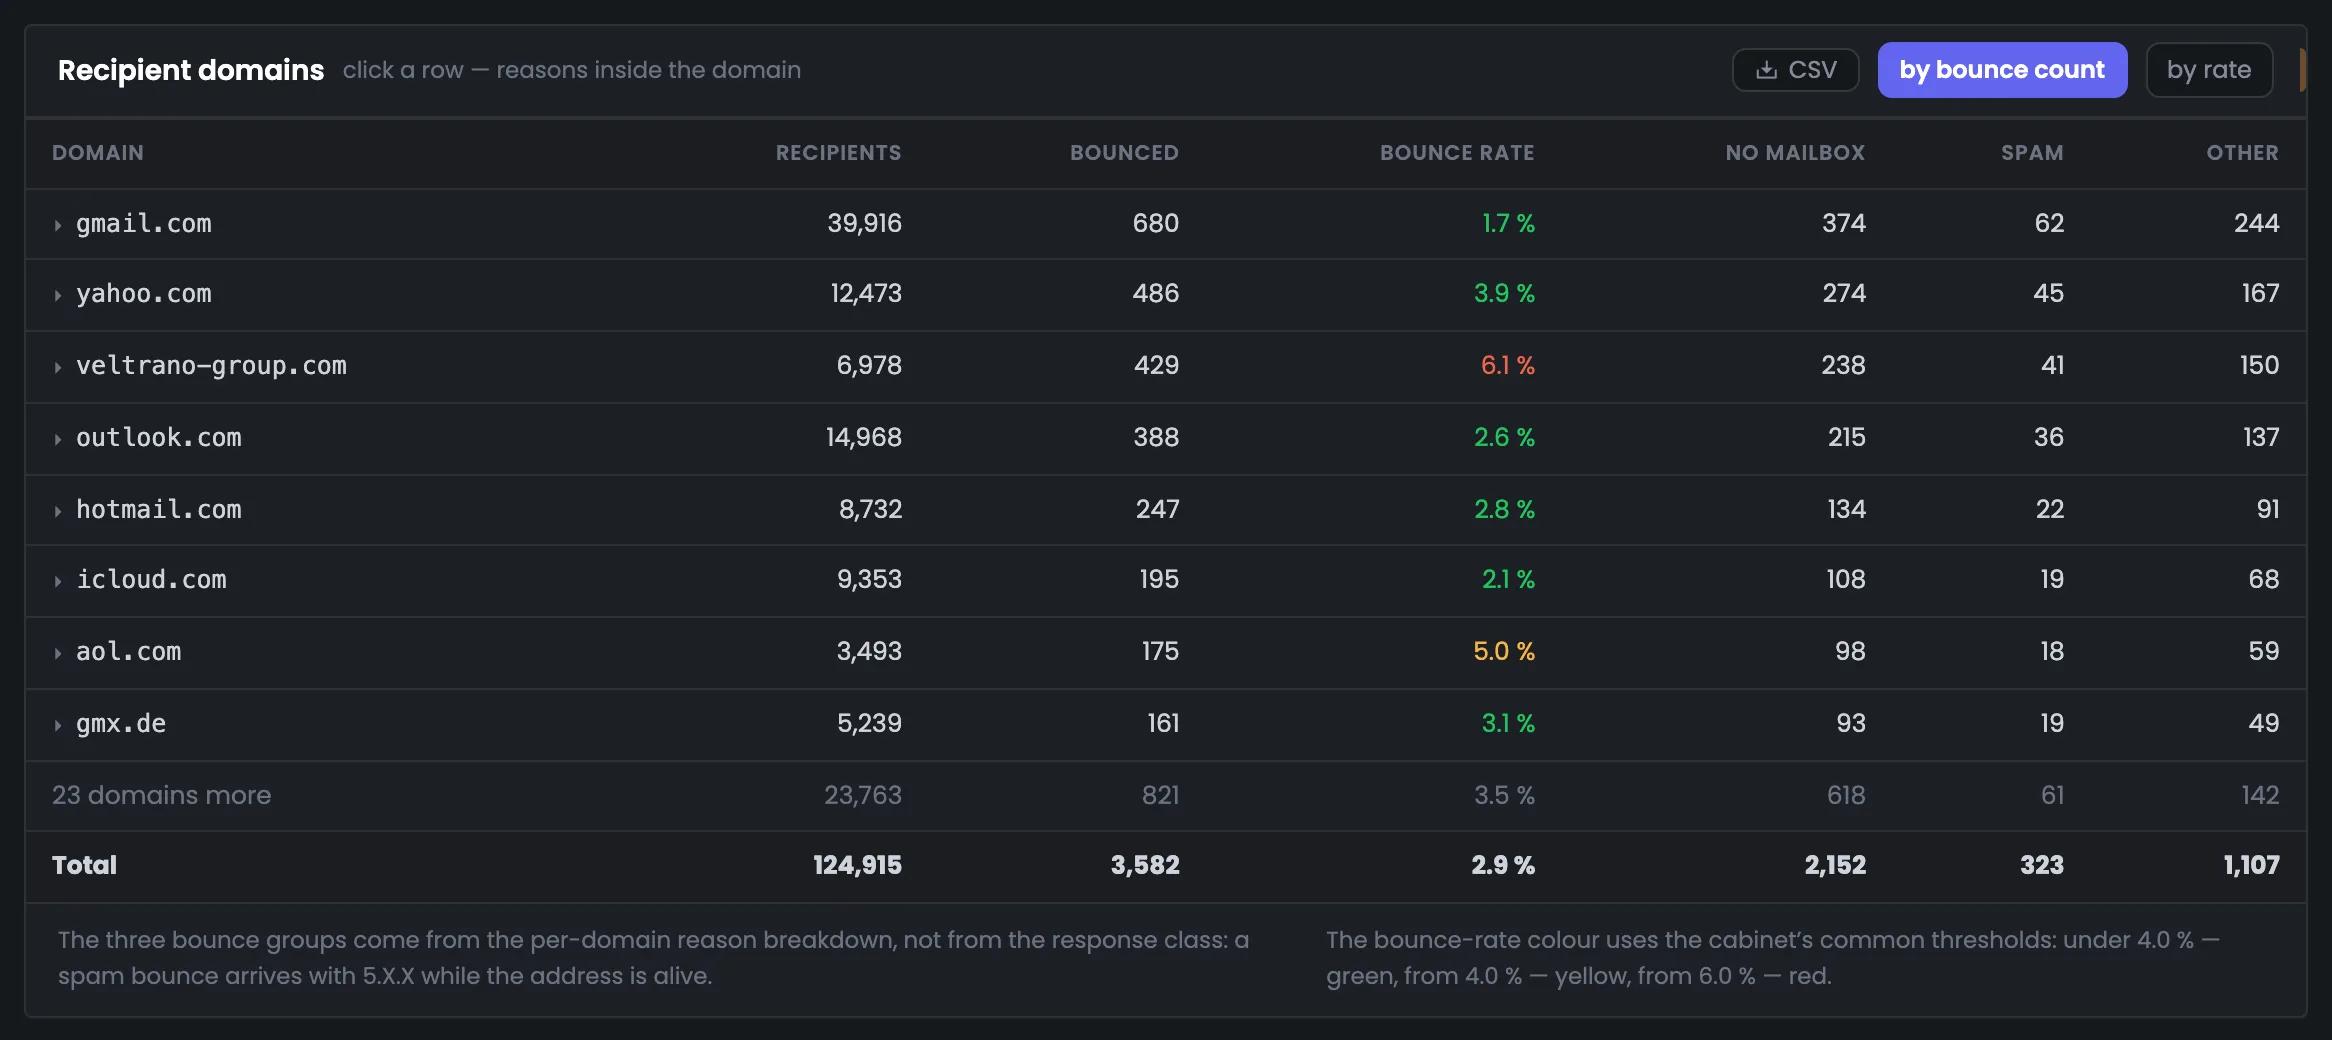
A corporate domain: 429 bounces, the rate is red. gmail.com has 680 bounces, but that's 1.7% of 39,916 recipients.
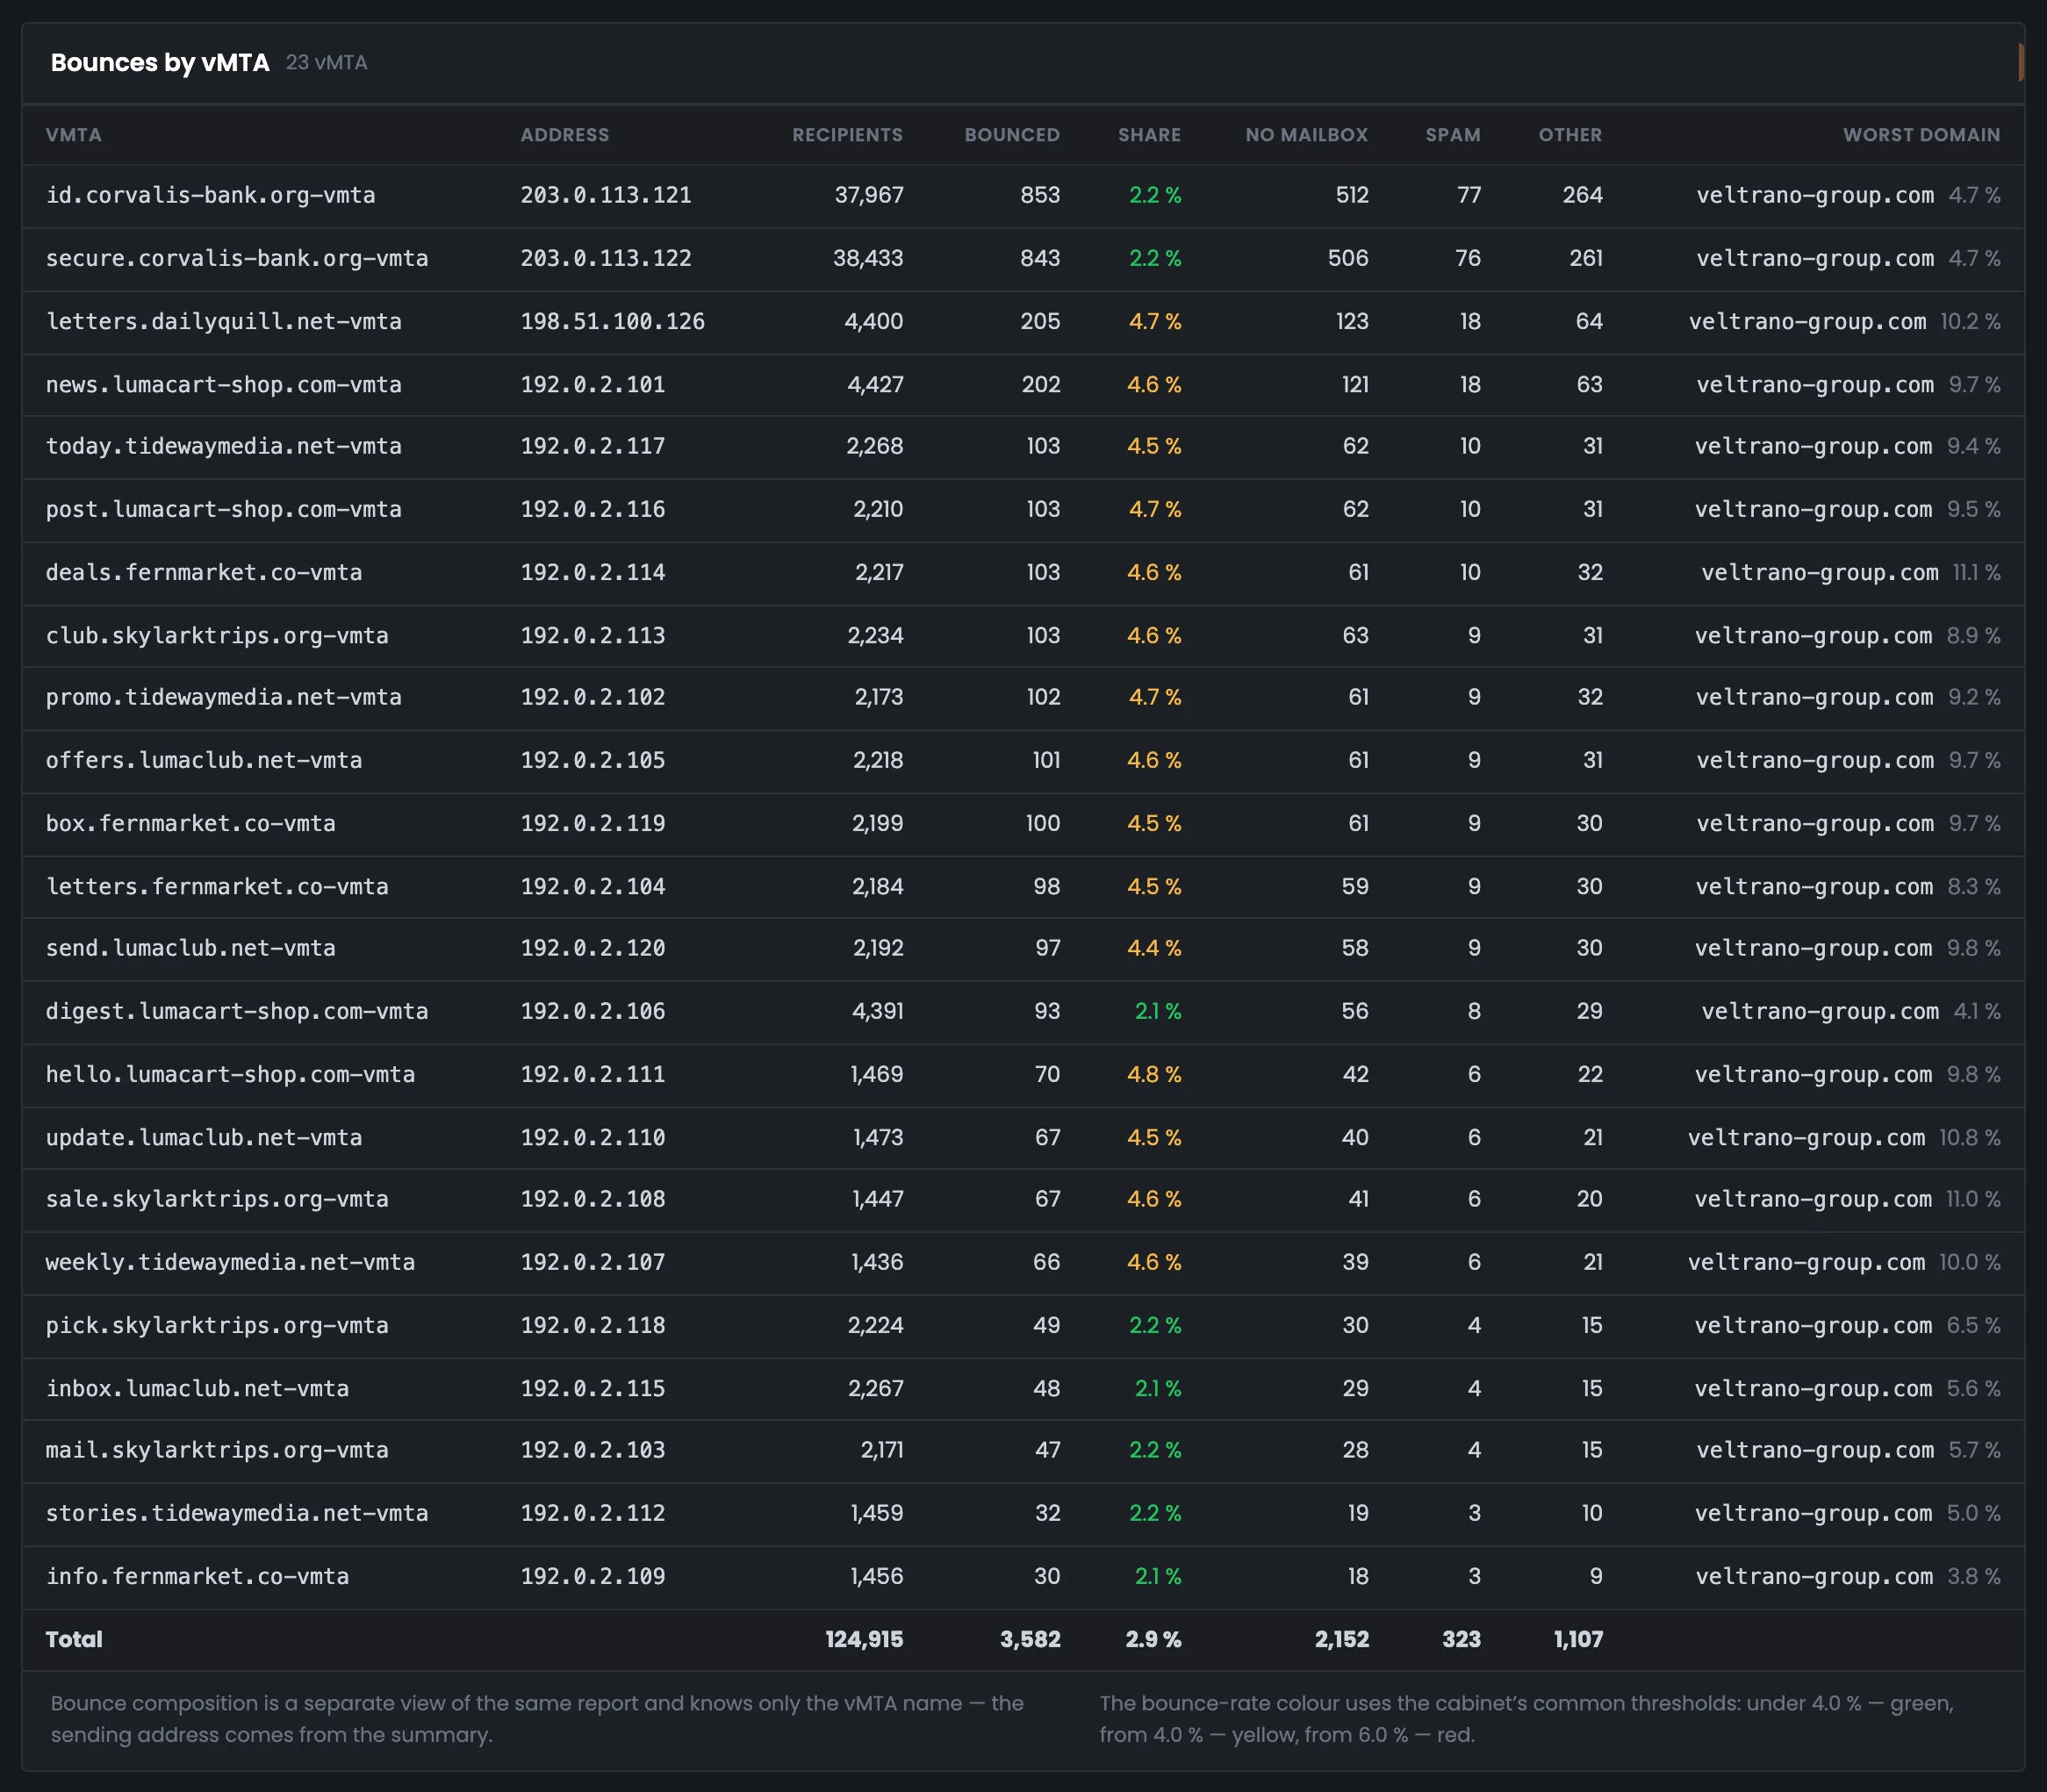
For all 23 sending points the worst domain is veltrano-group.com, from 3.8 to 11.1%. When the same problem shows up on every sending address, it's not the addresses — it's the recipient domain.
Temporary bounces (“try again later”) are not here: the accounting file records the final outcome of a message. They arrive by webhook and show up in “Analytics”.
05 / The interface in detail
Key figures, bounces by day, MTA categories and a breakdown of one of them, recipient domains and sending points. Above each screenshot: why the screen matters. Below it: what it shows.
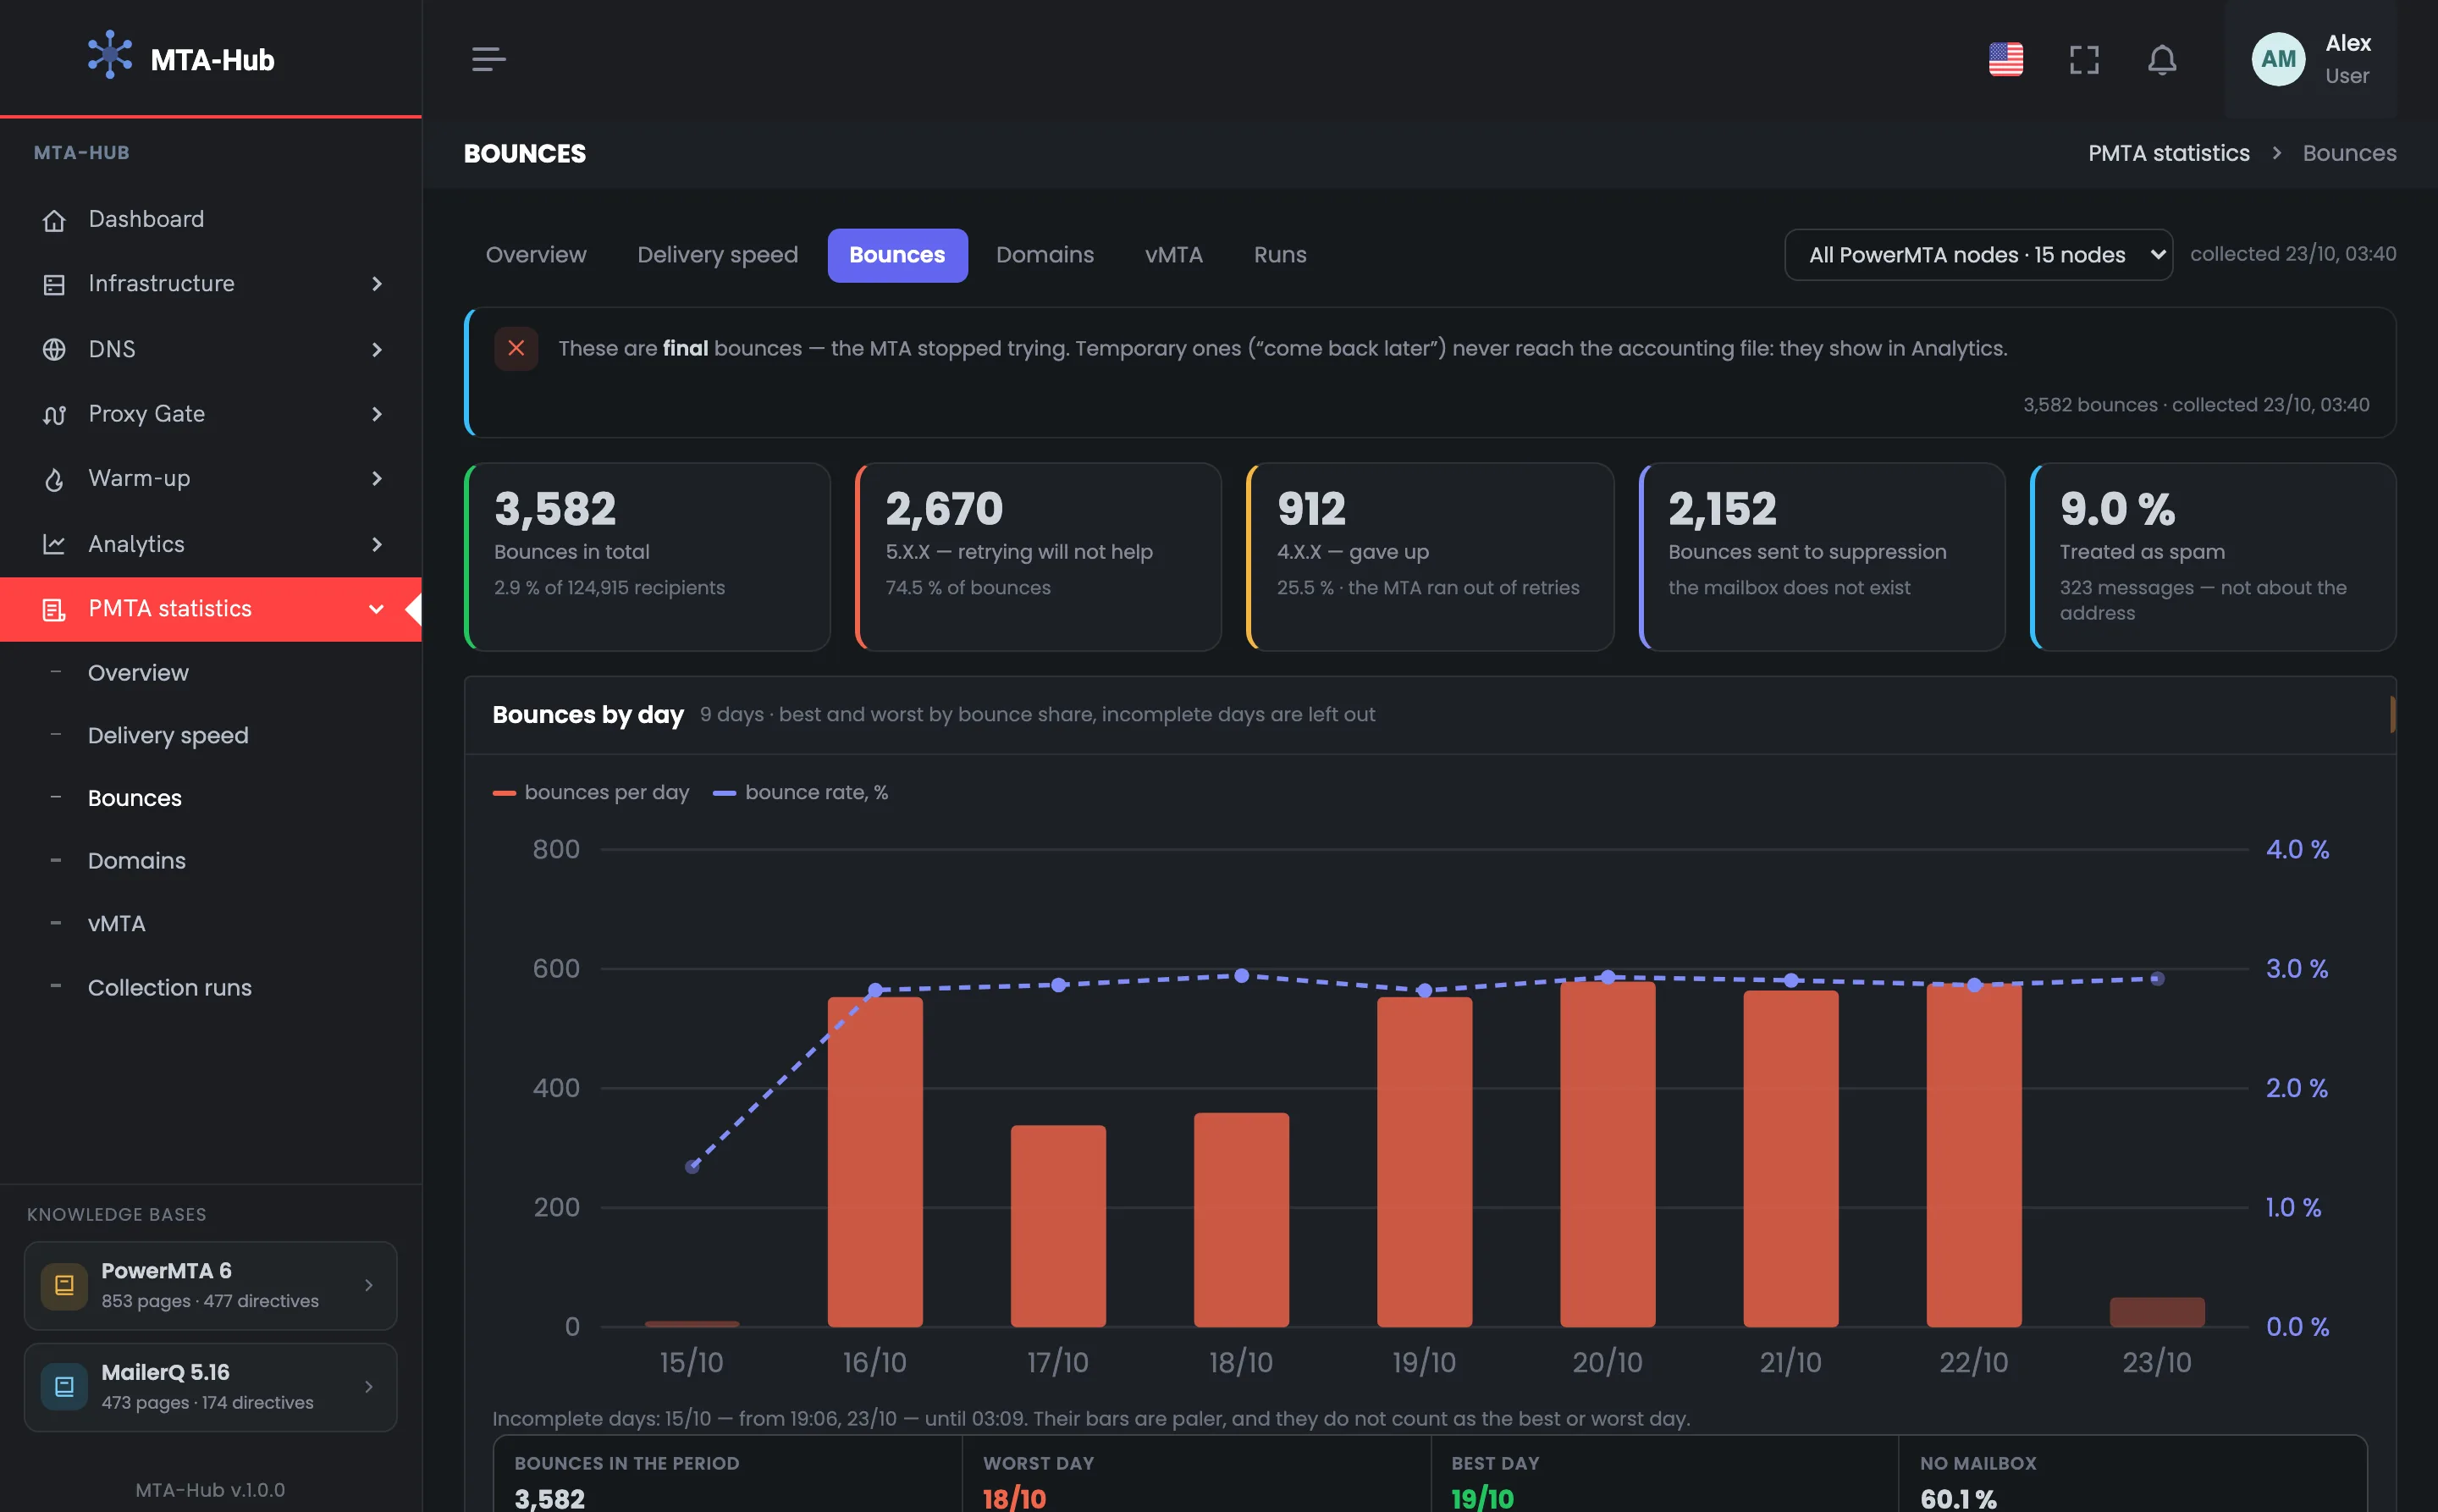
The tab starts with the key PowerMTA bounce figures: how many final bounces in the period, how many with a 5.X.X code (hard bounce) and 4.X.X (soft bounce), and how many addresses will go to the suppression list. Below are bounces by day, with the bounce rate on its own scale. These two screens show whether the week went smoothly and how many addresses you'll have to remove from your list.
Five tiles answer the main question about PowerMTA bounces for the period: how many there are, what type, and what to do with the addresses. Bounces are split by code — 5.X.X, where retrying won't help, and 4.X.X, where the MTA used up its retries — and by reason. 2,152 bounces will go to the suppression list — only those where the mailbox doesn't exist, while the 323 spam bounces don't go there: the mailbox exists and must not be removed. The “Bounced” tile is green — 2.9% of 124,915 recipients. 2,670 bounces have a 5.X.X code (74.5%), 912 have a 4.X.X code (25.5%). It's the split by reason, not by code, that keeps you from removing live mailboxes by mistake.
 Enlarge
The tile color follows the common bounce-rate thresholds.
The chart shows bounces by day over the nine days of the period: the bars are bounces per day, the dashed line is the bounce rate with its own scale on the right. It helps you spot a day when the bounce rate went up and work out what was sent that day. In the example the rate is steady — 2.8–2.9% on full days; incomplete days at the edges are paler and never count as the best or worst day. The bars are all one color because the MTA counts the reason breakdown only for the whole period. The best day is Oct 19 (553 bounces, 2.8%), the worst is Oct 18 (359, 2.9%). What the bounces are made of — “no mailbox” accounts for 60.1% of all bounces — you see on the categories screen below.
 Enlarge
The bars are one color: the MTA counts the reason breakdown only for the whole period.
Next come the bounce categories exactly as the MTA itself assigns them, without renaming. Clicking a category opens its breakdown: the mailbox provider replies word for word and the domains that bounce this way. Here you see which provider is unhappy about what, and exactly what it wrote.
The categories screen shows how the MTA itself sorted the bounces: in the example 12 of the 17 categories PowerMTA knows came up. The Hub doesn't rename them, so the numbers match the accounting files on the server and you can check them. The biggest group is “no such mailbox”, 1,577 bounces (44.0%): these are the addresses to clean from your list. Mailbox full and spam rejection — 323 each: the mailbox exists, so you must not delete the address. Clicking a row opens the category breakdown on the right. Start with the top rows: the first five categories account for most of the bounces. Then come no such domain, mailbox provider policy, connection, routing, expired, other and content.
 Enlarge
Clicking a row opens the breakdown on the right.
The category breakdown shows the words mailbox providers use when they reject mail, and who exactly replies that way. In the example the “No such mailbox” category is open, 1,577 bounces: each provider has its own wording, shown word for word — “User unknown in virtual mailbox table” 472 times, Gmail's “…does not exist” 310 times. Below are the domains that bounce this way: gmail.com, yahoo.com, the corporate veltrano-group.com, outlook.com. A switch at the top turns on the “by domain” and “text × domain” views. Microsoft, for example, has its own wording — “Requested action not taken: mailbox unavailable”, 286 times. The exact line is easy to copy into a search or into an email to your hosting provider.
 Enlarge
The “by domain” and “text × domain” views — with the switch at the top.
At the bottom are the recipient domains and vMTA sending points with the same split of bounces into “no mailbox”, “spam” and “other”. Each vMTA names its worst domain. These tables help you decide where the problem is: in your list, in the sending address or with a specific recipient.
The table shows the top eight recipient domains by number of bounces — with the bounce rate and a split into “no mailbox”, “spam” and “other”. It tells you which domain has a problem and what kind: dead addresses in your list or the provider's filter. Look at the rate, not the count: gmail.com has 680 bounces, but that's 1.7%, while the corporate veltrano-group.com has 429 bounces — already 6.1%, and its row is red. The color thresholds are captioned under the table. The column totals — 2,152 “no mailbox”, 323 spam and 1,107 other — match the categories exactly. If “spam” is growing for a domain, the issue is your messages or reputation, not your list; the full domain card is on the “Domains” tab.
 Enlarge
Color thresholds: under 4% — green, from 4% — yellow, from 6% — red.
The vMTA table shows all 23 sending points with the same bounce split and the worst domain for each. It helps you understand the cause: the sending address or the recipient. A domain counts as the worst only if it has at least 0.5% of this vMTA's messages and at least 50 messages, so even a small point can compare its domains. In the example all 23 points have the same worst domain — veltrano-group.com, from 3.8 to 11.1% bounced: the problem isn't the sending addresses but the recipient domain. If, on the other hand, one point stands out across all domains, that's the one to dig into — on the “vMTA” tab. The table totals are the same 2,152 “no mailbox”, 323 spam and 1,107 other.
 Enlarge
When the same problem shows up on every sending address, it's the recipient domain.
06 / Questions about bounces
In short: which bounces lead to removing an address, and where the categories come from.
EnlargeA domain's bounces are split into “no mailbox”, “spam” and “other”; the color follows the bounce-rate thresholds.
Final ones — after which the MTA stopped trying to deliver the message.
A spam bounce comes with a 5.X.X code, yet the mailbox exists. You must not remove it — that's why bounces are split by reason.
Only bounces where the mailbox doesn't exist. Spam and full mailboxes don't go there.
The MTA assigns them itself. The Hub doesn't rename them: the numbers match the accounting files on the server.
You use them to search the provider's documentation and quote them to your hosting provider.
The accounting file records the final outcome of a message, not every attempt. Temporary ones arrive by webhook and show up in “Analytics”.
The MTA counts the reason breakdown only for the whole period — its report has no such data by day.
From its domains that have at least 0.5% of this point's messages and at least 50 messages.
07 / Next step
Bounces show what the mailbox provider replied. Each recipient domain in full — volume, deliverability, timing and typos in your list — is on the “Domains” tab.
Temporary bounces and deferrals are in “Analytics”.