gmail.com
The largest98.4% delivered, 623 bounces, 0:03:22 on average — mail to the biggest domain in your list arrives better than average.
MGmail
delivery
gmail.com98.4%
623 bounces0:03:22

Statistics by recipient domain
In “Analytics” recipients are grouped into well-known mailbox providers and “other”. Here you see every domain from the MTAs' own accounting log: share of volume, deliverability, bounces by reason and delivery time.
Separately — the many small domains where nonexistent addresses and typos like gmail.con usually hide.
01 / Volume by domain
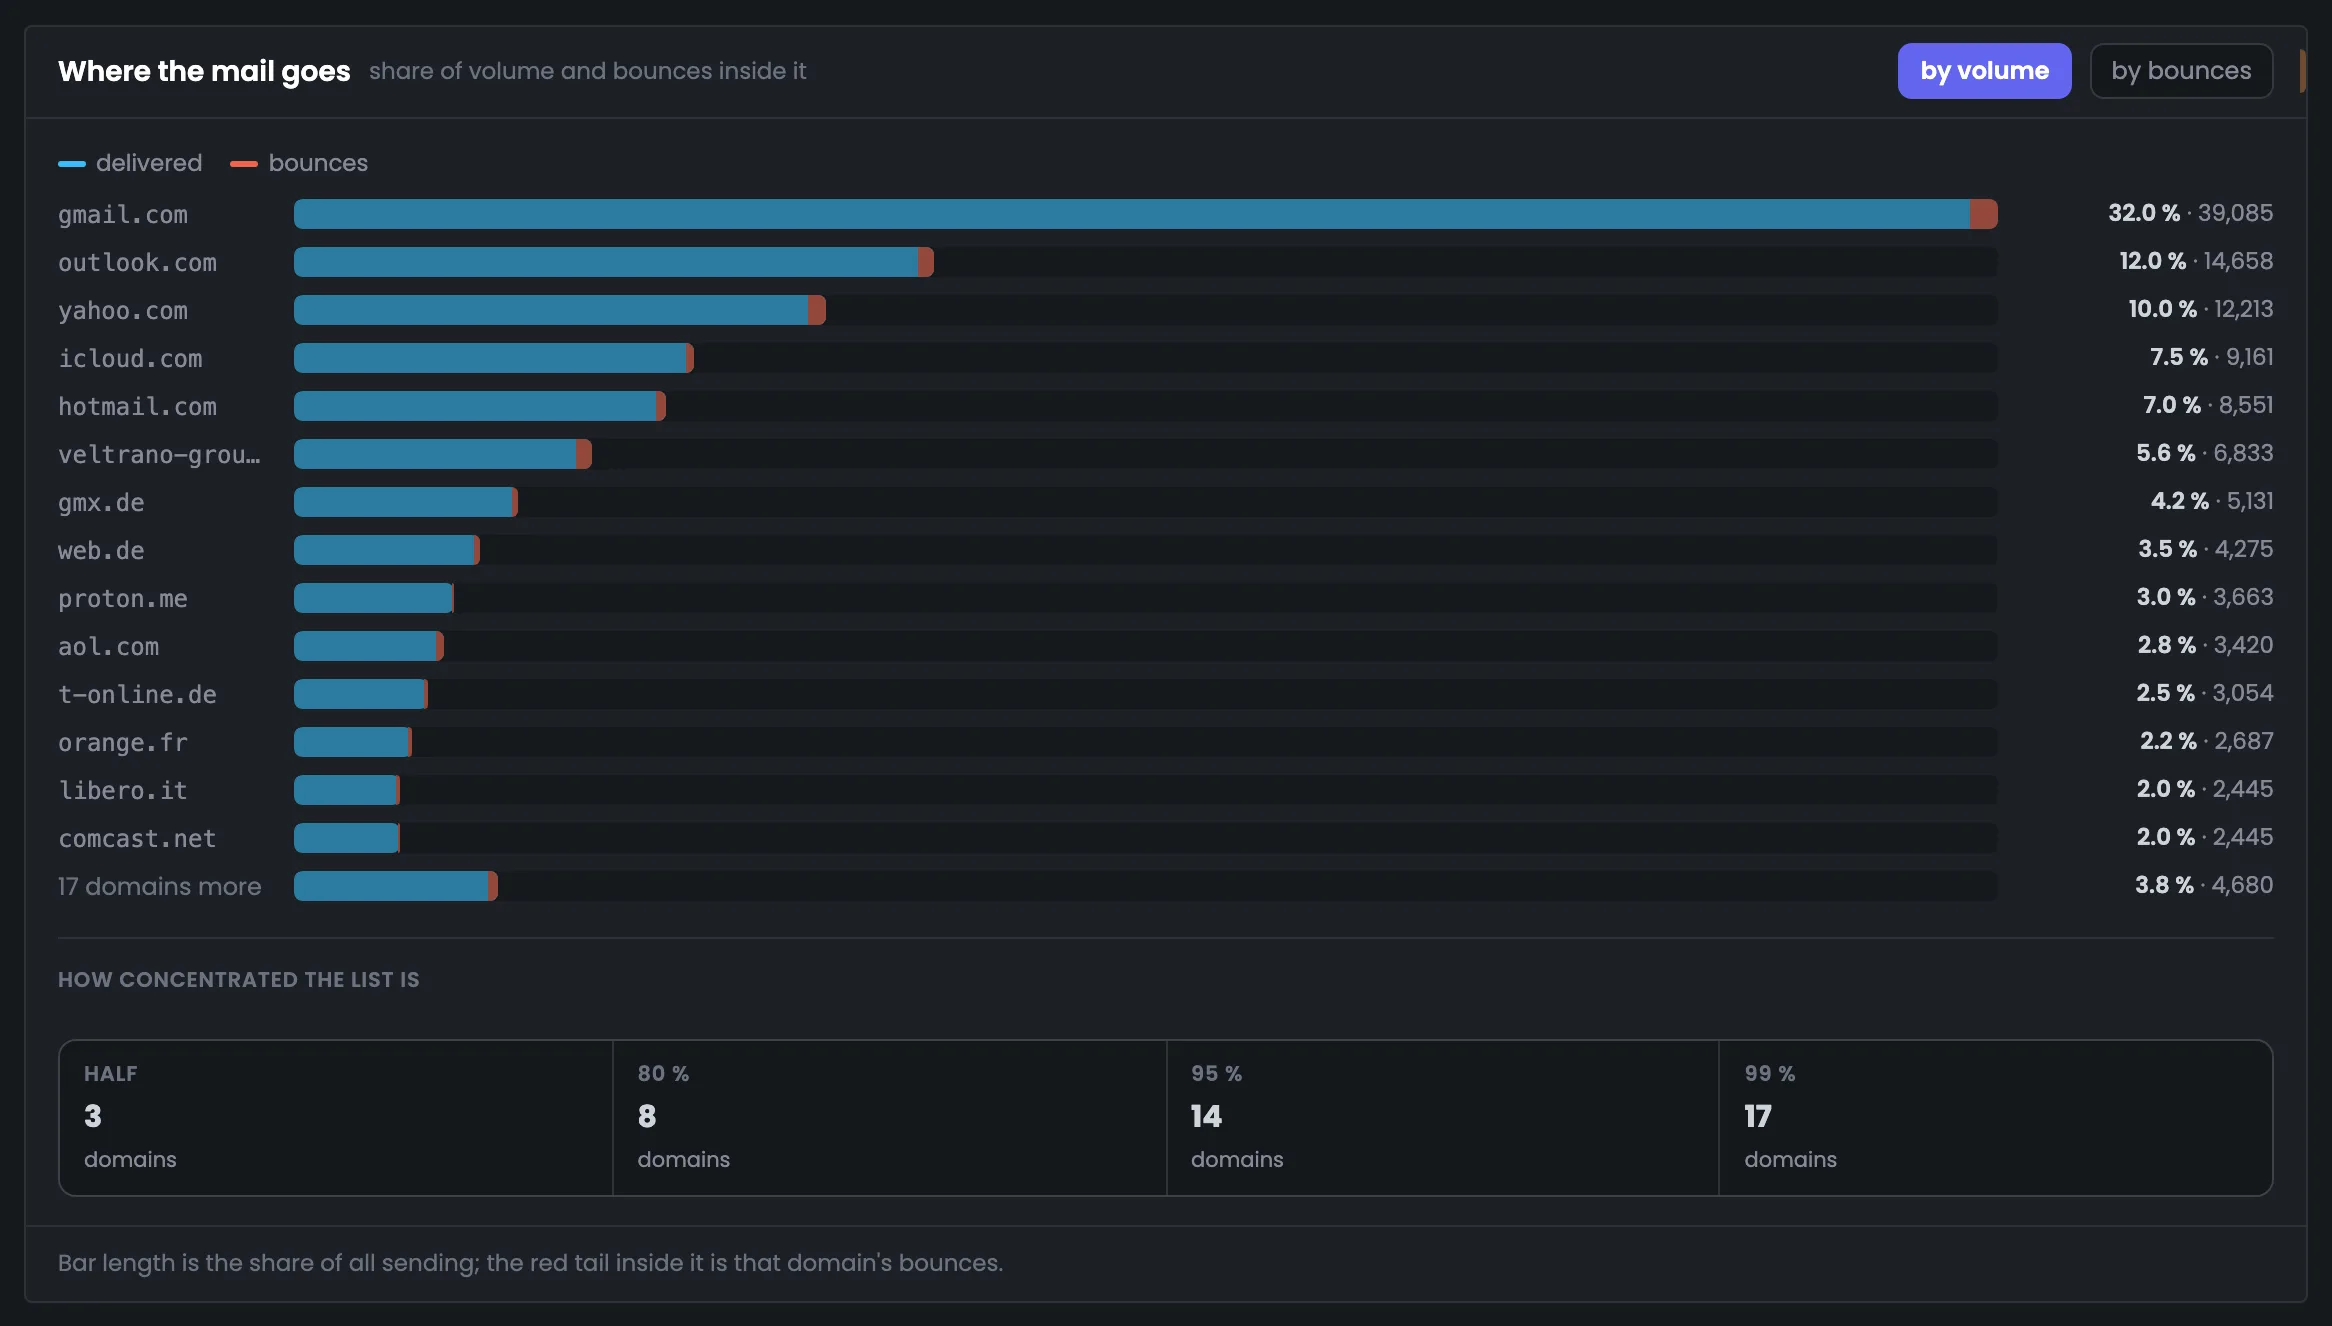
The bars show which recipient domains take most of the volume, and the red part inside each bar is that domain's bounces. Next to them — how many domains account for half, 80, 95 and 99% of sending. This shows how much your mailings depend on a few large mailbox providers.
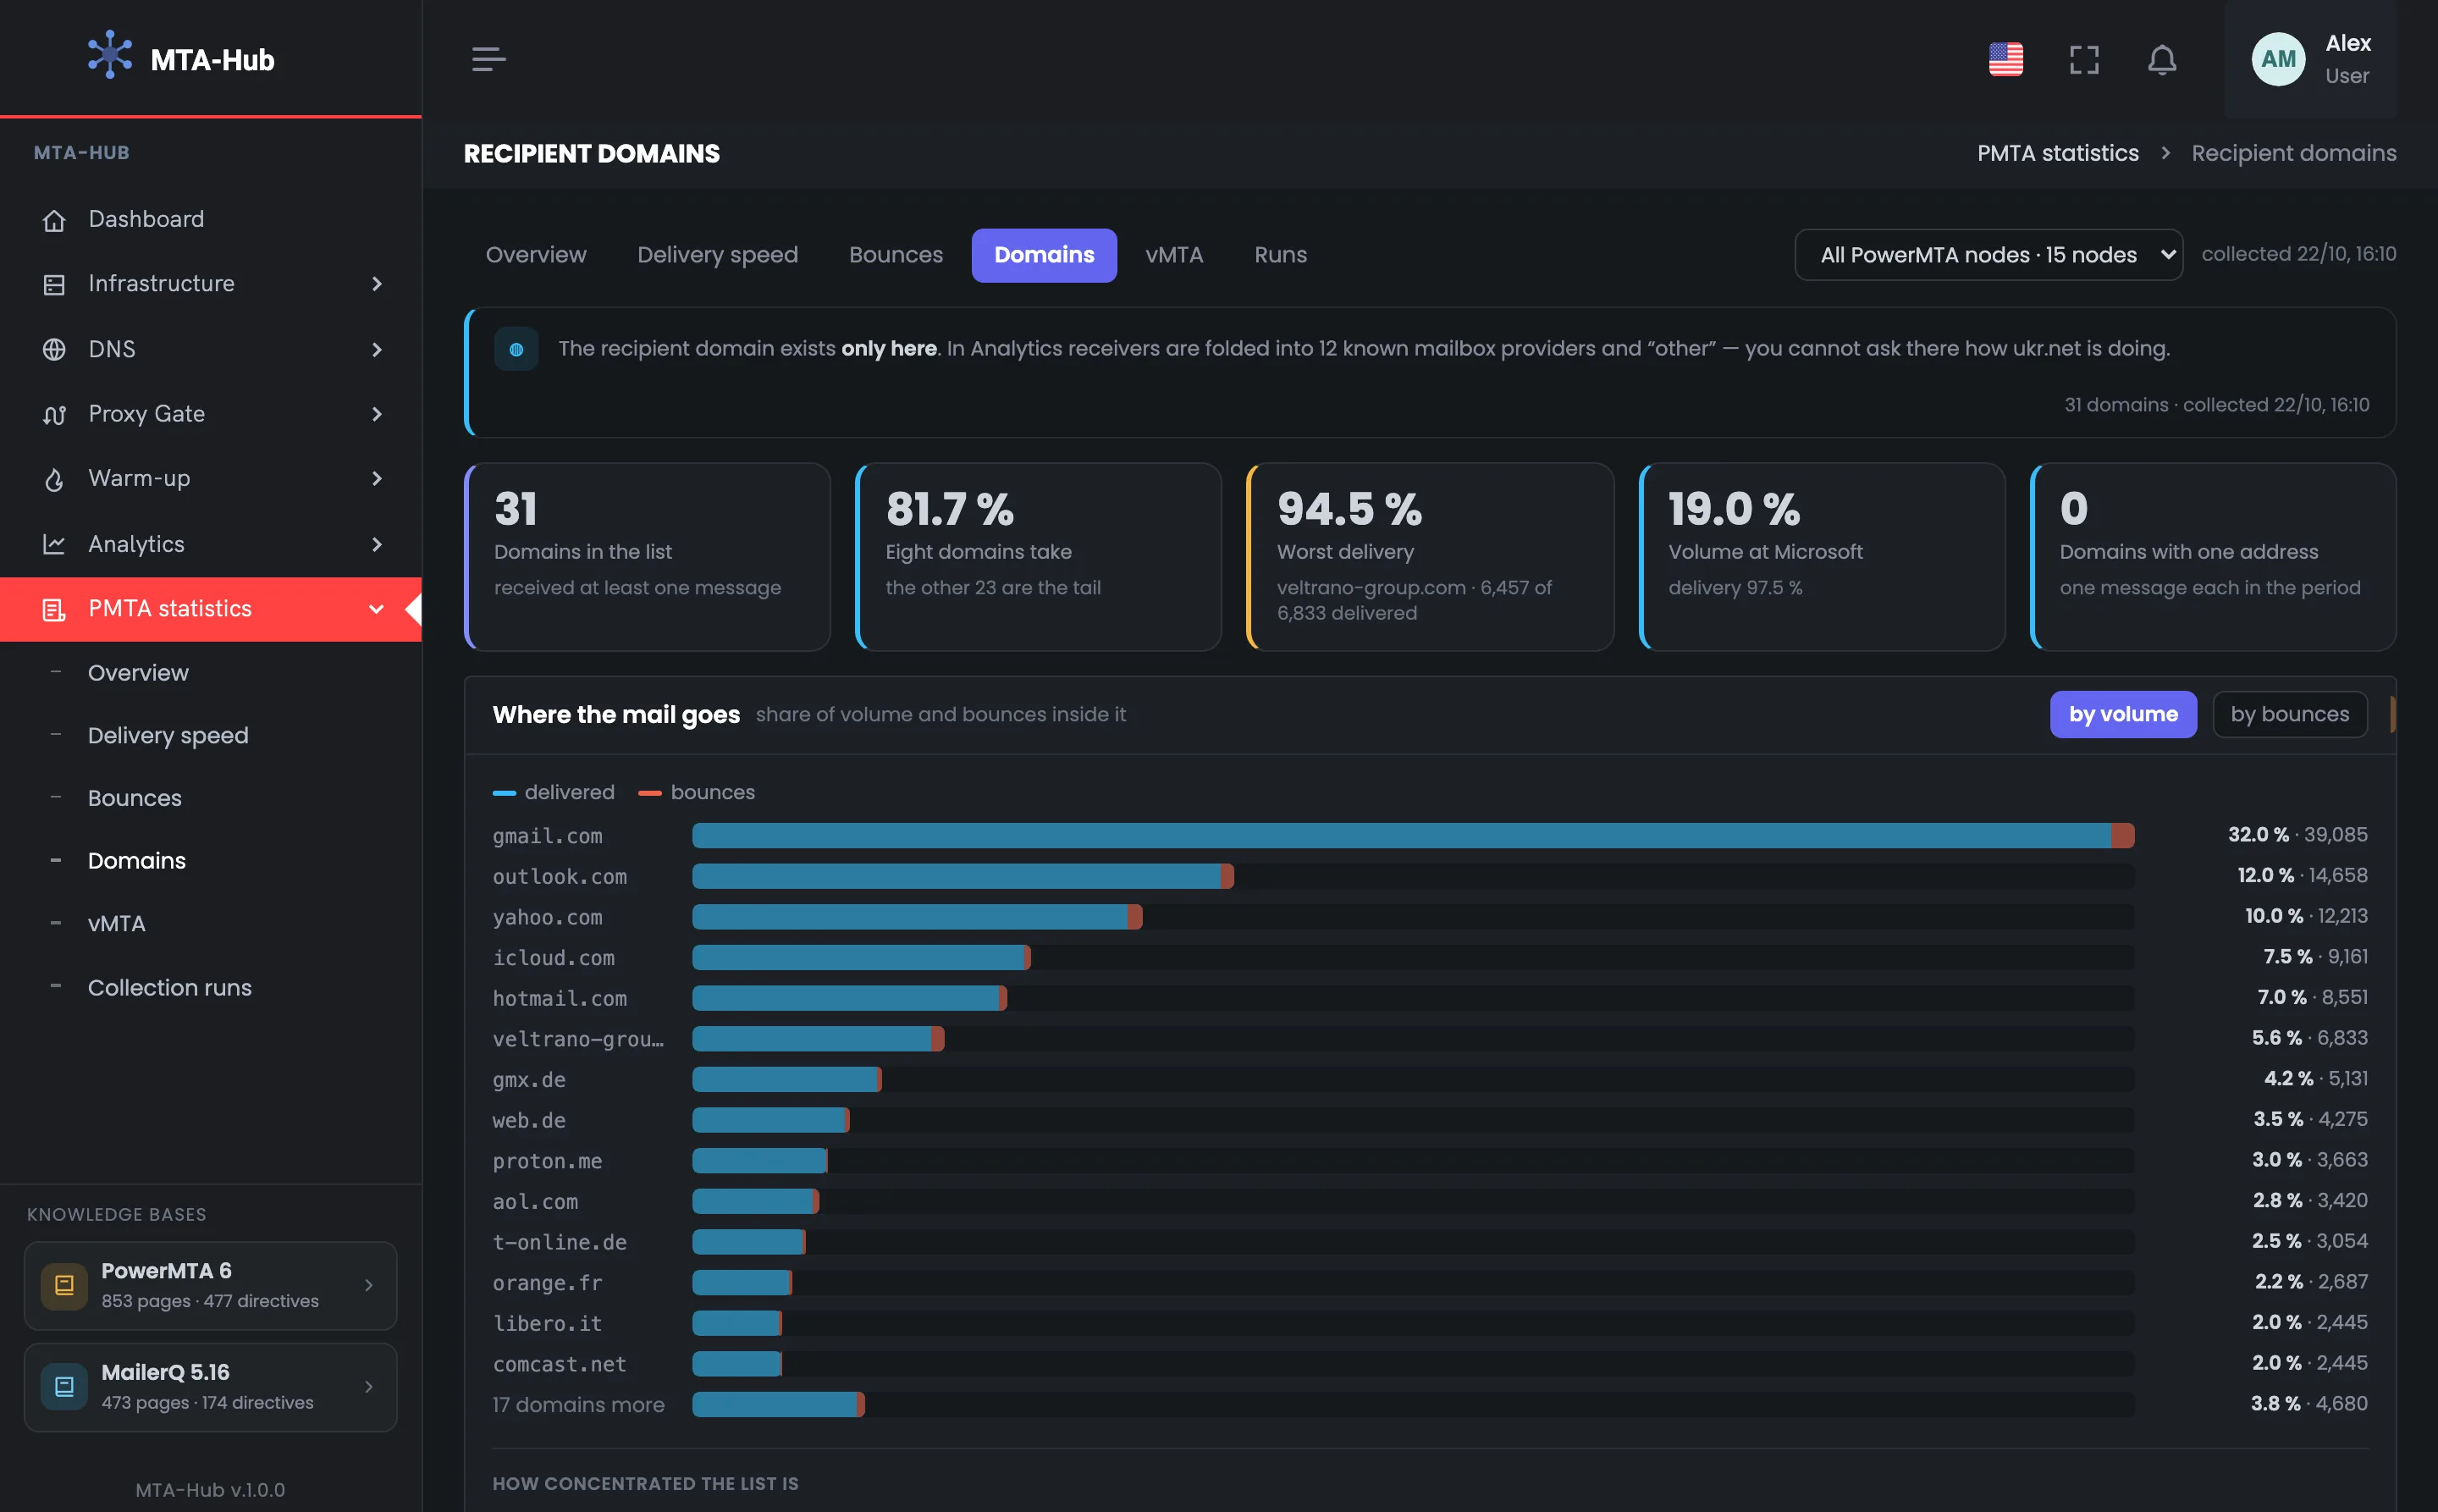
In total 31 domains received mail; gmail.com — 32.0% of sending, outlook.com — 12.0%, yahoo.com — 10.0%
The “by bounces” switch redraws the bars by share of all bounces.
02 / Domain table
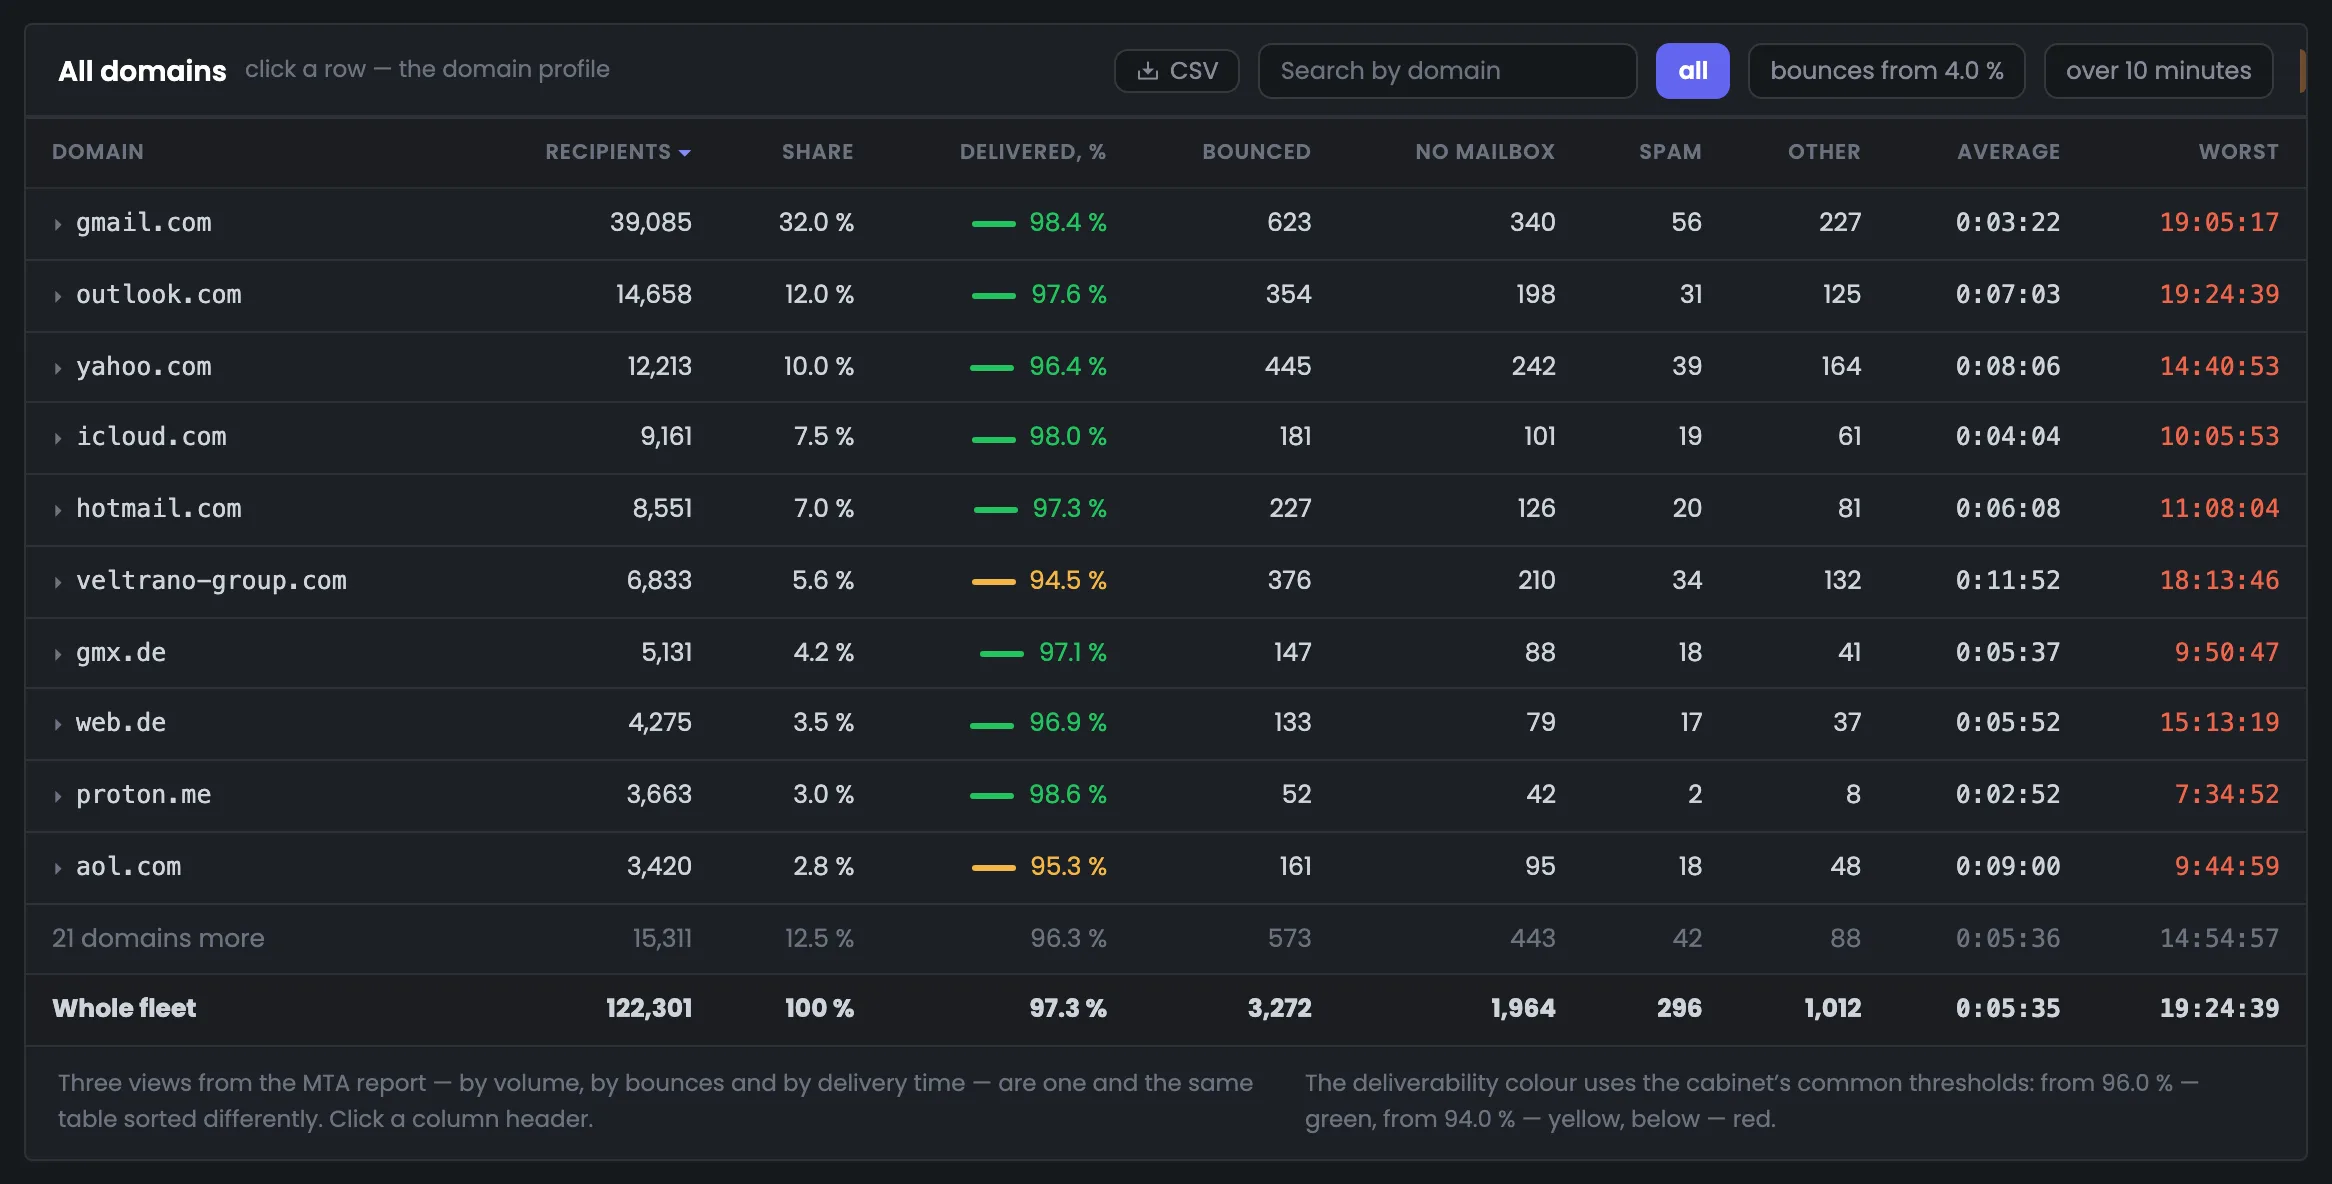
“Who gets the most”, “where delivery is worse” and “where it takes longer” are one domain statistics table with different sorting. Search and the “bounces from 4%” and “over 10 minutes” filters narrow it down, and the totals are counted over the rows shown.
98.4% delivered, 623 bounces, 0:03:22 on average — mail to the biggest domain in your list arrives better than average.
A customer's corporate domain: 94.5% — the worst delivery among the large domains, and the longest average time — 0:11:52.
The deliverability thresholds are shared across the Hub and shown under the table: from 96% — green, from 94% — yellow, below that — red.
03 / Domain card
Clicking a row opens the domain's bounce reasons, delivery time and the sending points that deliver to it worst. This way you dig into one problem domain without being distracted by the rest. The delivery curve for a single domain can be calculated on the server with a button.
From the MTA's own analysis, not by code type: 1,964, 296 and 1,012 across all domains.
All domains together — 0:05:35 on average.
The vMTAs that deliver to this domain worst.
04 / Typos in your list
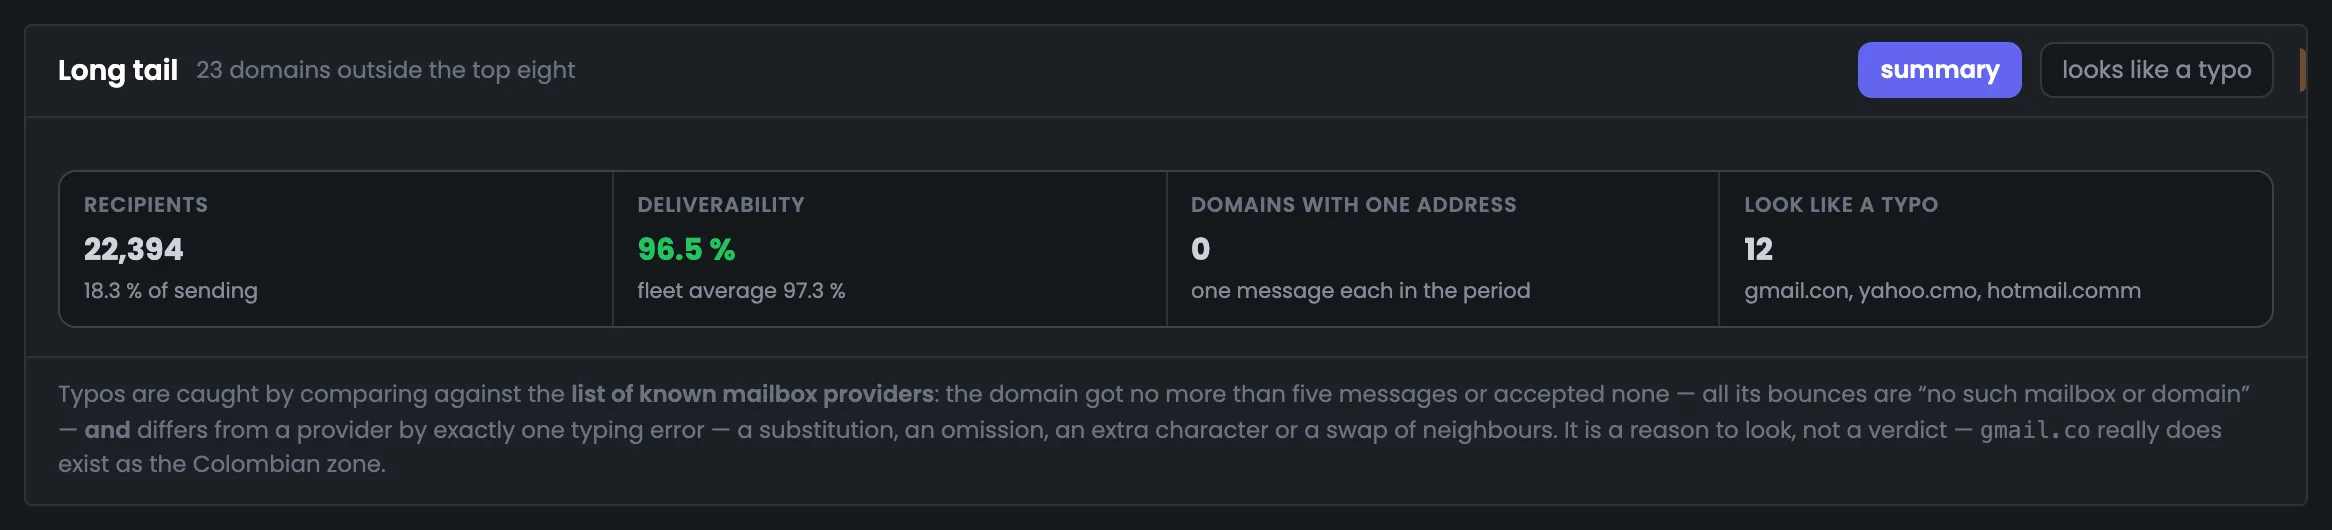
In the long tail, small domains are compared with a list of well-known mailbox providers. gmail.con and yahoo.cmo get found even if dozens of addresses have piled up on them: they have no deliveries at all. These addresses are worth checking and fixing or removing from your list.
22,394 recipients outside the top eight, 96.5% deliverability versus 97.3% on average. 12 look like typos.
The Hub finds a common typo not by how rare it is but by the result: not a single delivered message, and every bounce is “no such domain”.
This is a reason to check, not a final verdict: gmail.co, for example, is a real domain in Colombia's .co zone.
05 / The interface in detail
Key figures, where your mail goes, the table of all domains and the long tail with typos. Above each screenshot: why the screen matters. Below it: what it shows.
The tab starts with the key figures and volume bars: how many domains received mail, which of them take most of the sending, and which one has the worst delivery. The red part of each bar shows the domain's bounces. These screens show which mailbox providers your mailings depend on and where to look for a problem.
The tiles hold the key figures for recipient domains: how many domains received mail, what share of sending the top eight make up, and which large domain has the worst delivery. It's a quick answer to whether everything is fine with your main recipients. In the example there are 31 domains, the top eight make up 81.7% of sending, and the worst deliverability belongs to the corporate veltrano-group.com: 94.5%, the tile is yellow. If there is such a domain, the next step is to open its card in the table below. Microsoft has 19.0% of the volume with 97.5% delivered, and there are no single-address domains in this list. Tile colors follow the deliverability thresholds: from 96% — green, from 94% — yellow, below that — red.
 Enlarge
The color follows the deliverability thresholds.
This screen shows where your mail goes: one bar per domain sized by its share of sending, with the red part inside showing that domain's bounces. Below — how concentrated your list is: how many domains make up half, 80, 95 and 99% of sending. In the example gmail.com gets 32.0%, and three domains take half of all sending — so the deliverability of your mailings rests on a few mailbox providers. The “by bounces” switch redraws the bars by share of all bounces. Another 17 domains together make up only 3.8% of sending. If one of the top three domains has problems, it's immediately visible across the whole mailing, so they're checked first.
 Enlarge
The “by bounces” switch redraws the bars.
Next — all domains in one table with deliverability, bounces by reason and delivery time. In a separate block — the long tail of small domains where typos in your list like gmail.con hide. These two screens help you find both a problem large domain and junk addresses in your list.
The table of all recipient domains answers three questions — who gets the most, where delivery is worse and where it takes longer; you sort by clicking a column header. Deliverability is colored by the Hub's thresholds, and bounces are split into “no mailbox”, “spam” and “other”. In the example gmail.com gets 98.4% delivered, while veltrano-group.com only 94.5%, and it has the longest average time — 0:11:52. Clicking a row opens the domain card with reasons and sending points. The “bounces from 4%” and “over 10 minutes” filters leave only problem domains, and the totals are recalculated over the rows shown. The delivery curve for a single domain can be calculated on the server with a button in the card.
 Enlarge
Thresholds: from 96% — green, from 94% — yellow, below that — red.
The long tail is 23 small domains outside the top eight, where typos in your email list usually hide. The Hub compares them with a list of well-known mailbox providers and finds the ones that look like typos by the result: not a single delivery, and every bounce is “no such domain”. In the example there are 12 of them, including gmail.con with 52 addresses. This is a reason to check the addresses and fix them in your list, not a final verdict: gmail.co, for example, is a real domain in Colombia's .co zone. Here you can also see that the tail as a whole gets delivered worse: 96.5% versus 97.3% on average. Two former corporate domains don't look like mailbox providers and didn't make it onto the typo list.
 Enlarge
A reason to check, not a verdict: gmail.co is a real domain in Colombia's .co zone.
06 / Questions about domains
In short: how this tab differs from “Analytics” and how typos are found.
EnlargeTwelve domains look like a typo: no deliveries at all, every bounce is “no such domain”.
In “Analytics” recipients are grouped into mailbox providers and “other”. Here every real domain is shown separately.
From the PowerMTA accounting files on the servers. The Hub parses them with the MTA's report utility and checks the slices against the overall total.
By the reasons from the MTA's own analysis — no mailbox, spam, other — not by code type.
How concentrated your list is in a few domains: here eight domains receive 80% of sending.
Small domains are compared with a list of well-known mailbox providers; a typo has no deliveries at all.
No, it's a reason to check: gmail.co, for example, is a real domain in Colombia's .co zone.
Yes: in the domain card it's calculated on the server with a button.
Over the rows shown: search and filters change the totals along with the table.
07 / Next step
If mail reaches a domain worse from some addresses than from others, the problem is the addresses. The sending point comparison is on the “vMTA” tab.
Who your messages take longer to reach — on the “Delivery speed” tab.