Added up
PublishedNightly runs on Oct 21 and Oct 23 at 03:40: 15 servers and 104 files each, 122,462 and 122,769 records, the check added up — “success”.
HMTA-Hub
check
Nightly runSuccess
104 files1 m 15 s

PowerMTA statistics collection
Once a day the Hub runs the MTA's report utility right on the server, parses the result and checks that every slice adds up to the total — only then do the numbers appear on the screens.
Here you see how collection went: the schedule, the state of each server, the history depth and the log of runs with a detailed step-by-step record of each one.
01 / Checking the accounting data
Totals by domain, vMTA, day and category must add up to the server's overall total before anything is saved. If they don't, the result of that statistics collection isn't shown, and the tabs keep the previous data. That way unchecked numbers never reach the screen.
The screens still show data from the nightly run — Oct 23, 03:40
Nightly runs on Oct 21 and Oct 23 at 03:40: 15 servers and 104 files each, 122,462 and 122,769 records, the check added up — “success”.
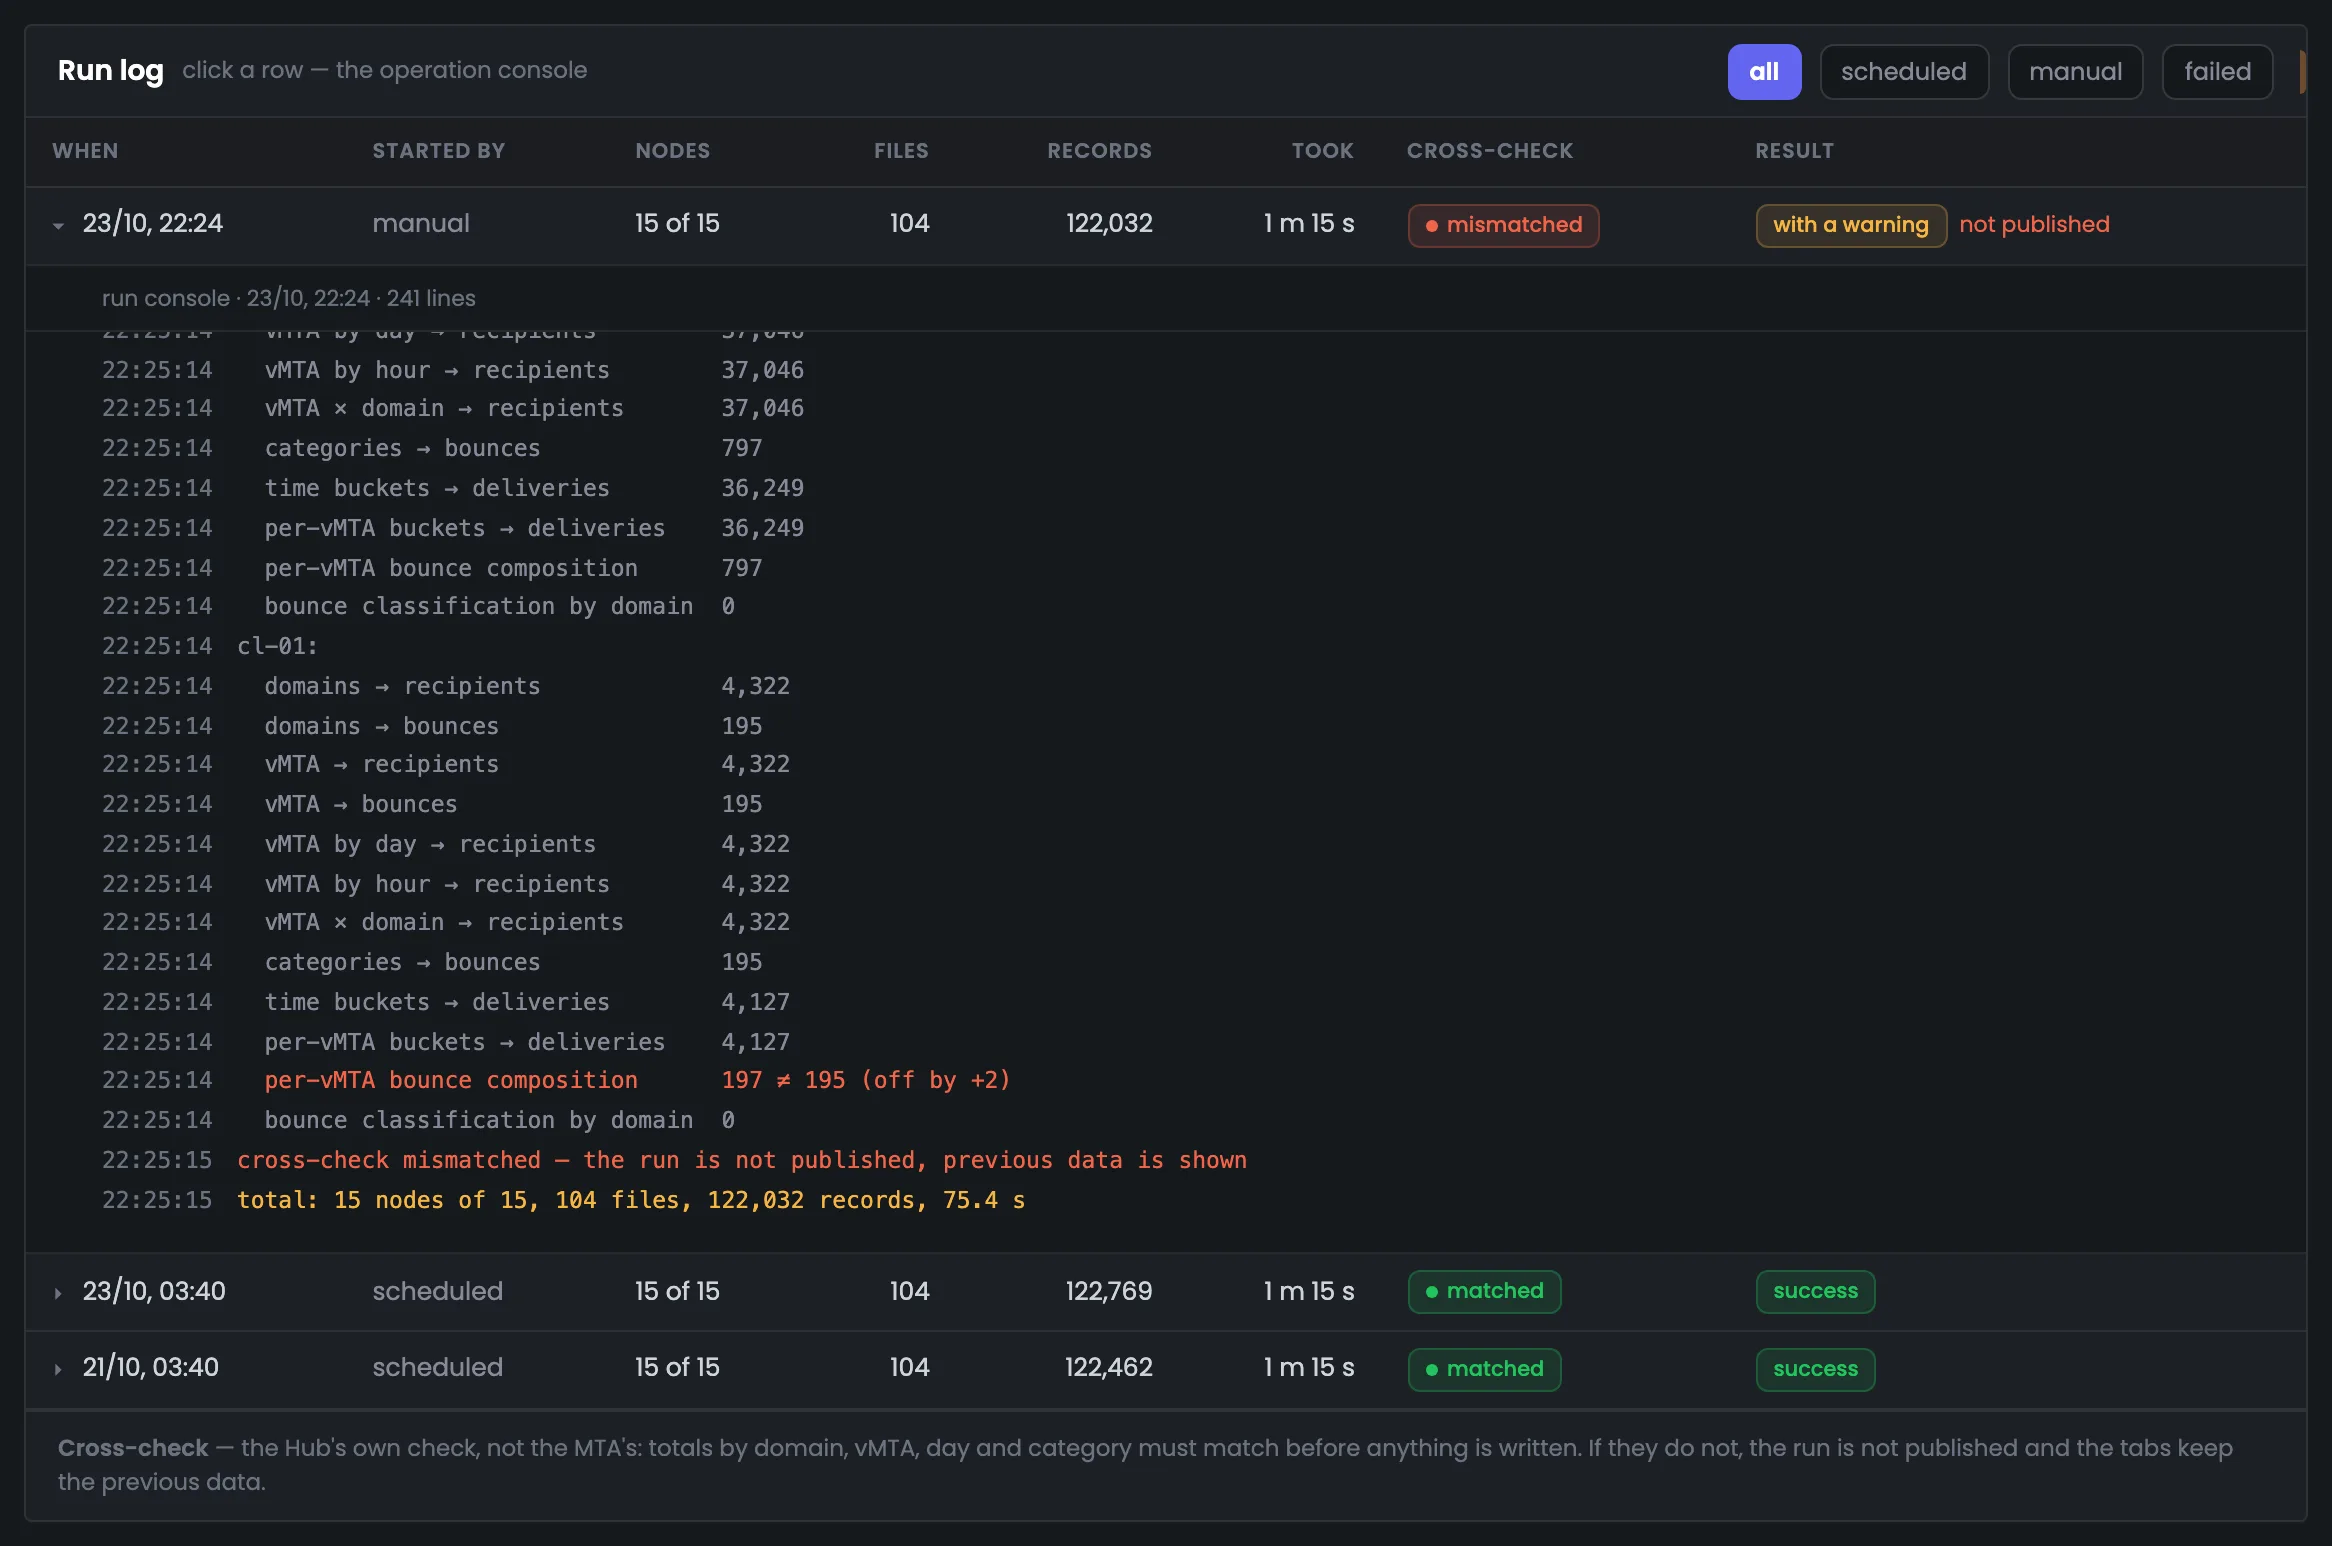
On cl-01 the bounce breakdown by vMTA didn't add up: 197 versus 195. This happens when records are appended to the current day's file while it's being parsed.
02 / Each server separately
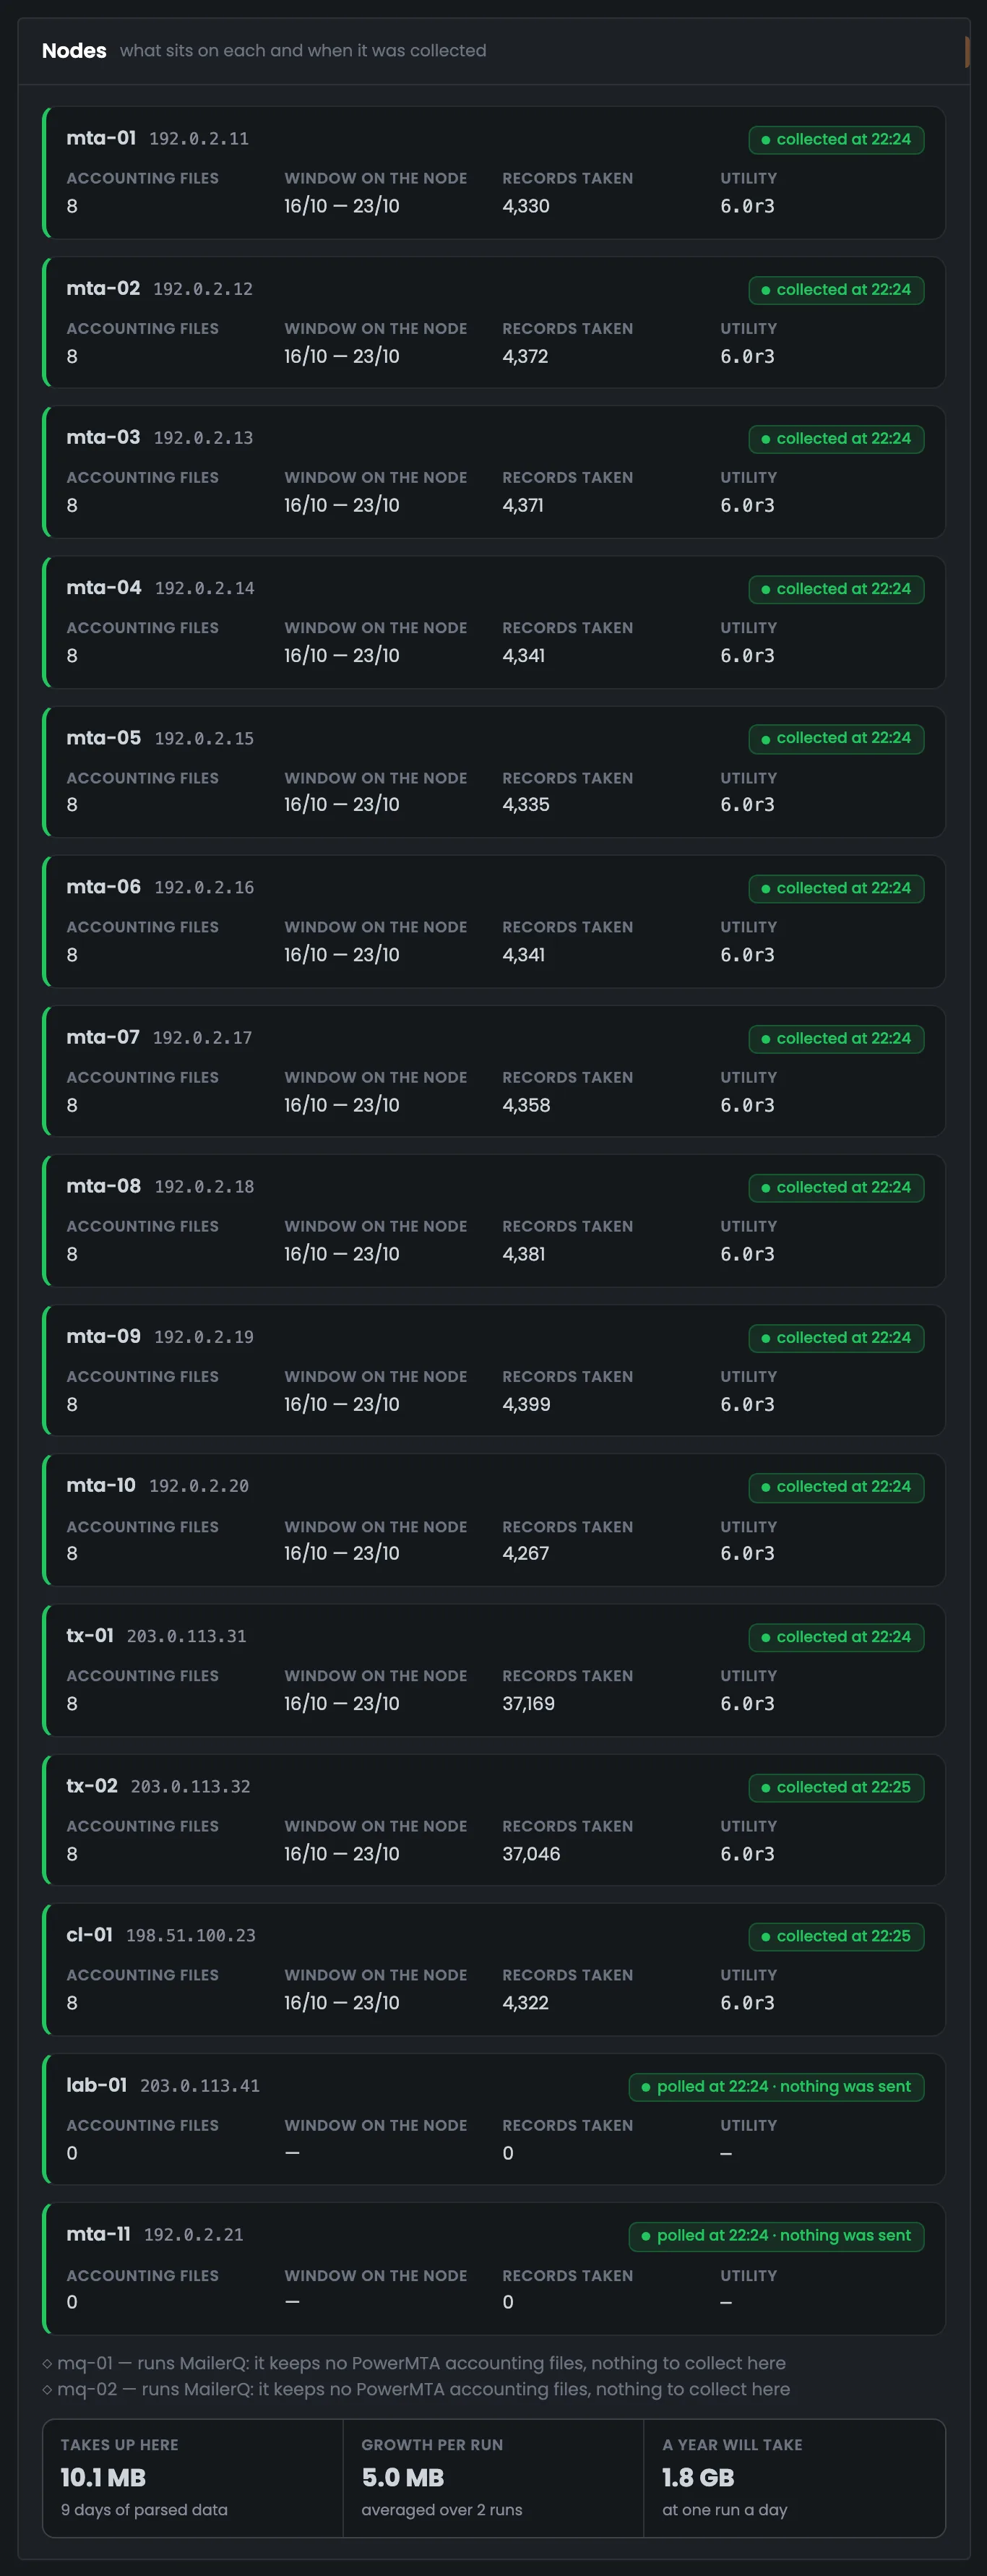
A server card tells you when it was polled, what period of files it keeps and how many records were taken. A server that sent nothing is marked “polled, no sending” — that's not an alarm. What travels over the network is the utility's result, not the accounting files themselves.
Data from Oct 16 to Oct 23, from 4,267 records up to 37,169 on tx-01.
Polled and sent nothing — not an alarm: the file count is zero, not a dash.
They have no PowerMTA accounting.
10.1 MB for 9 days, 5.0 MB per run.
03 / History depth
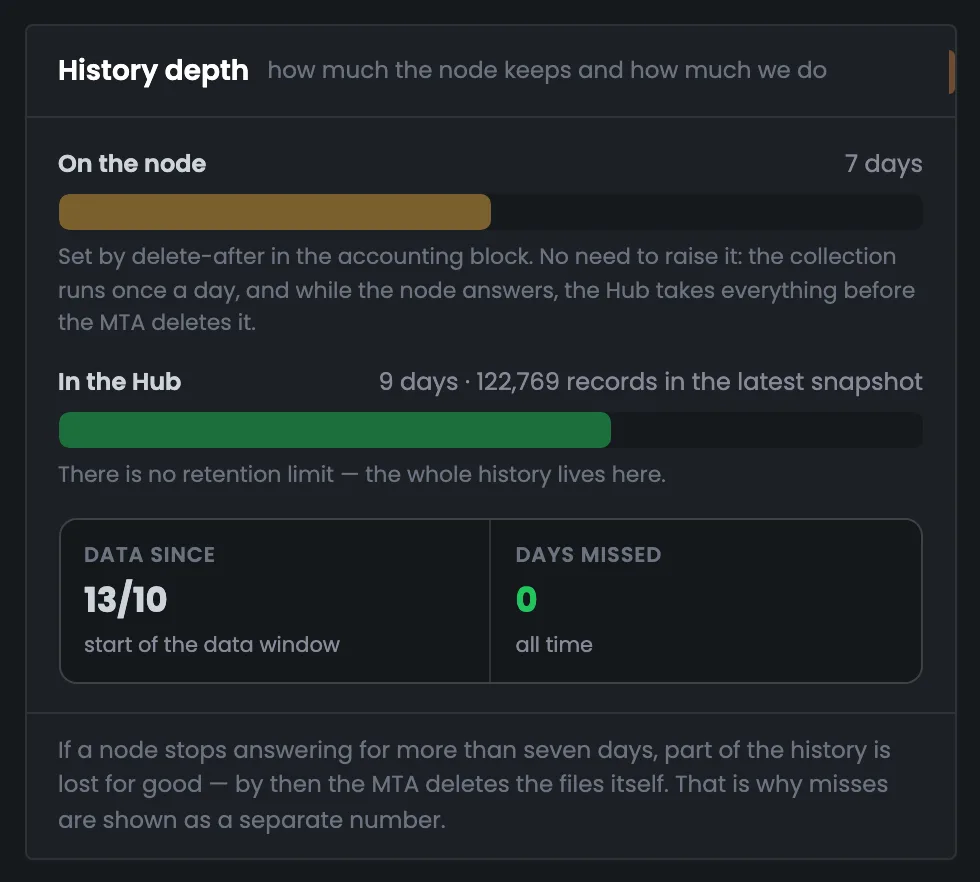
On the server the files are kept for a week: the period is set by the delete-after directive in the accounting settings, which the Hub writes itself. In the Hub there's no time limit. Only days that are truly lost count as gaps.
The delete-after 7d directive — the Hub writes it into the PowerMTA accounting settings itself.
122,769 records in the latest snapshot, data since Oct 13. Missed days — 0.
A gap is only a day that's no longer on the server and that no run collected — not a day that's still on the server and will come with the next run.
04 / Log and console
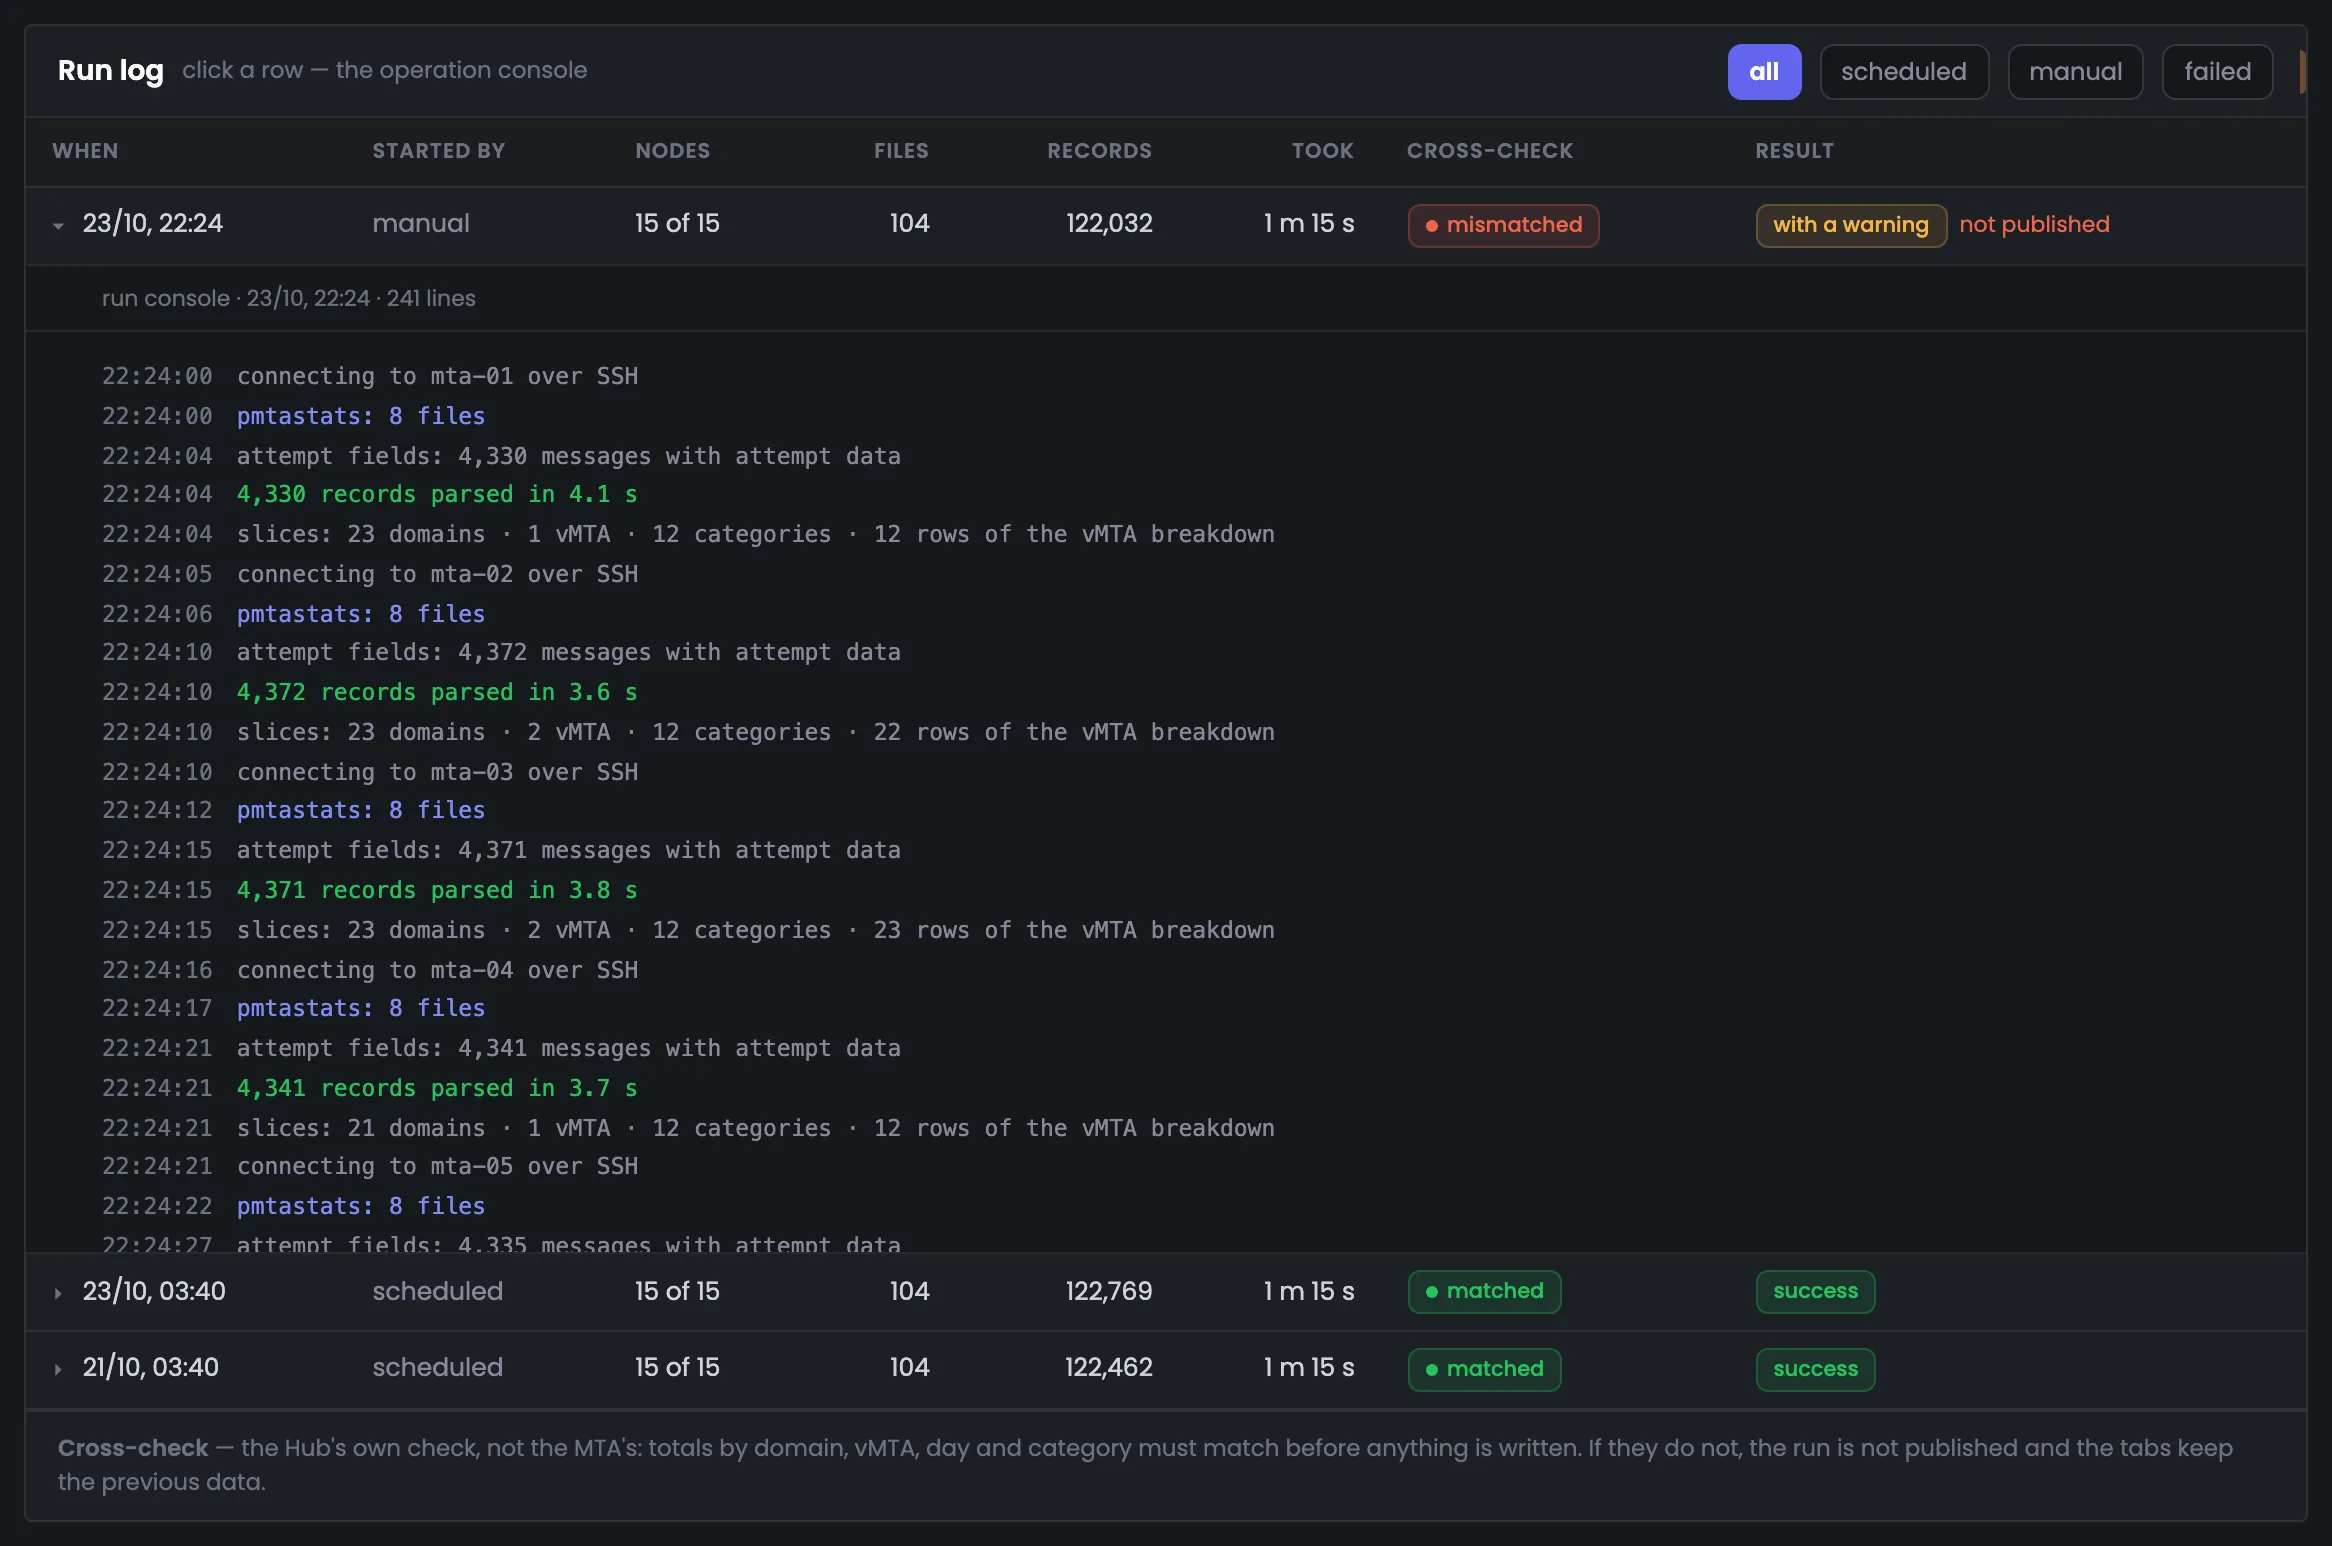
A run's row expands into a console: SSH connection, pmtastats over the files, parsing, slices and, at the end, a check for each server — twelve checks in a column. The console shows on which server and which check failed.
Console lines are in the Hub's interface language, along with the numbers and server names
Collection follows the Hub's time zone, while the tab shows the next run in the viewer's own time zone.
05 / The interface in detail
Key figures, servers, history depth, the run log, the end of the console and what's worth knowing. Above each screenshot: why the screen matters. Below it: what it shows.
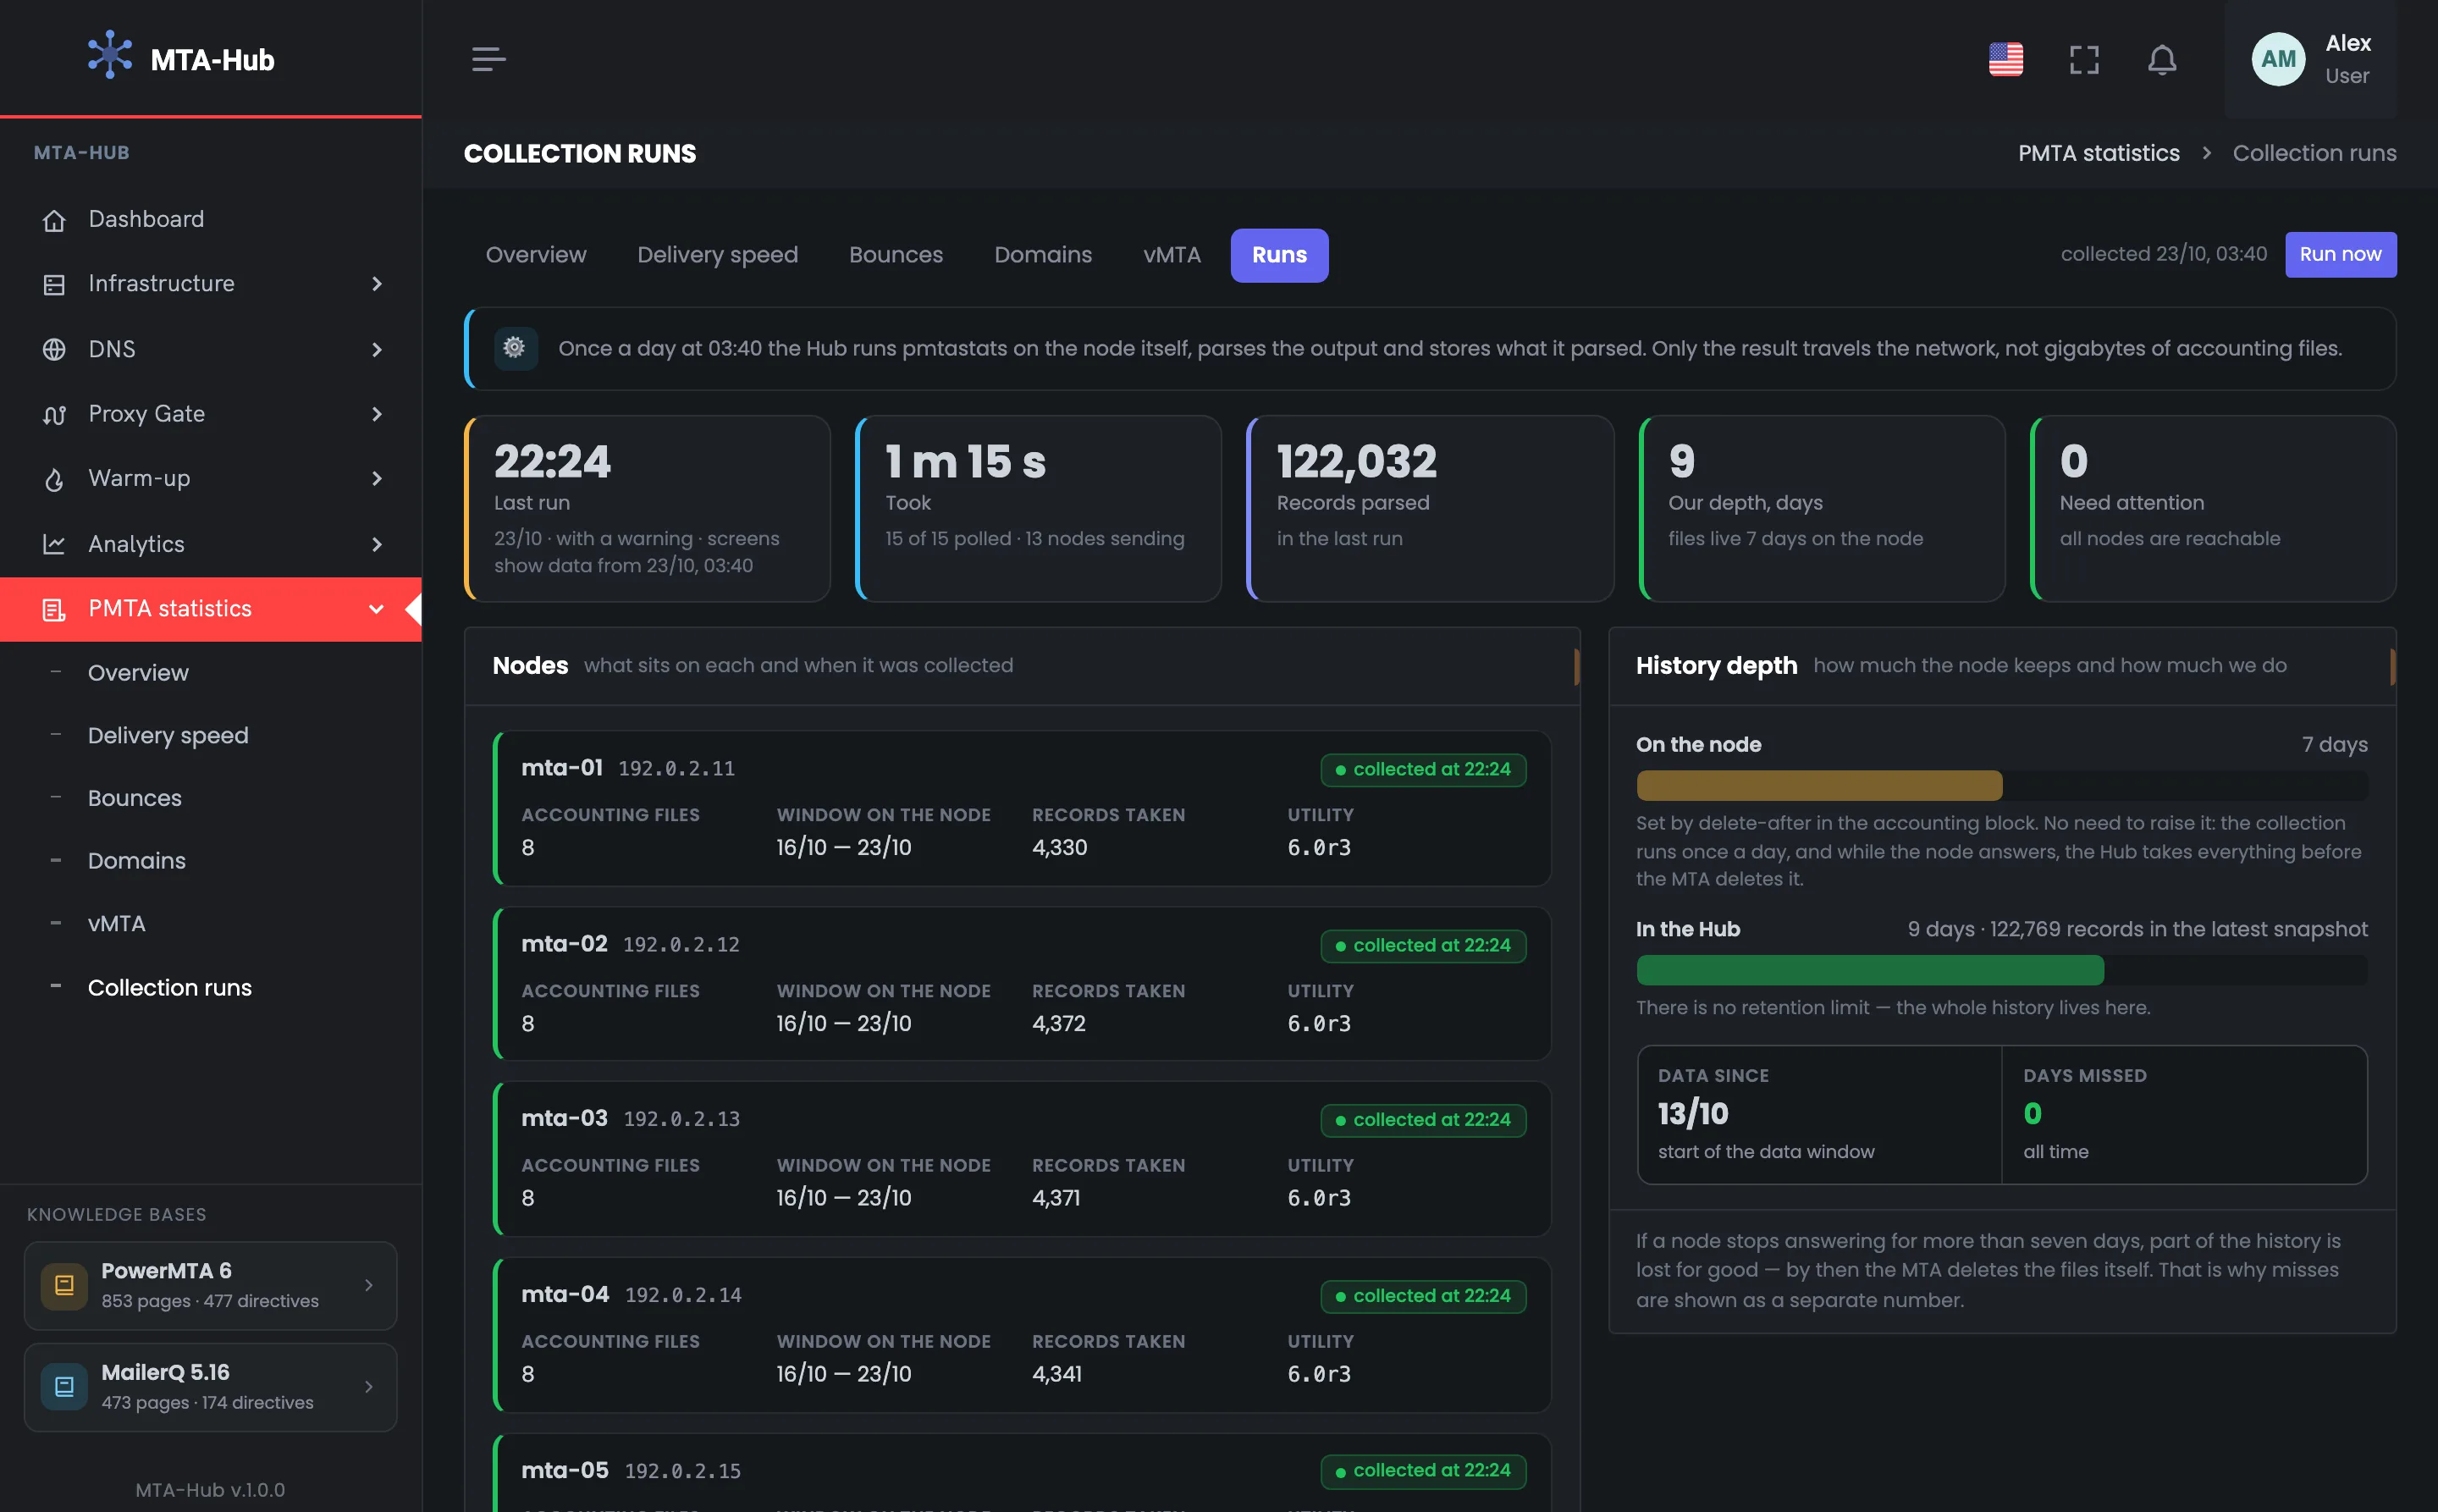
The tab starts with the PowerMTA statistics collection schedule and the result of the last run. Below is a card for each server: when it was polled, what period of files it holds and how many records were taken. The group ends with history depth — how many days are kept on the server and how many have been collected in the Hub.
The tiles show the statistics collection schedule and the result of the last run — the first thing to check if the numbers on other tabs look doubtful. Once a day at 03:40 the Hub runs pmtastats right on the server, and what travels over the network is the result, not the accounting files themselves. In the example the last run is a manual one, Oct 23 at 22:24, “with a warning”, and the tile tells you right away that the screens show data from 03:40. 15 of 15 servers polled, needing attention — 0. The last run took 1 m 15 s and parsed 122,032 records; the history in the Hub is 9 days, with a one-week retention on the server. If it says “with a warning”, look for the cause in the log below.
 Enlarge
What travels over the network is the result, not the accounting files themselves.
The cards show how collection went on each server: when it was polled, how many accounting files were taken, what period of data it keeps and how many records were parsed. The screen tells you whether every server made it into the statistics. In the example thirteen servers handed over 8 files each, from 4,267 to 37,169 records, while lab-01 and mta-11 are marked “no sending” — that's normal, not an alarm. At the bottom — how much space the accounting takes in the Hub: about 1.8 GB a year. MailerQ servers are listed separately: they have no PowerMTA accounting. It's important to tell “no sending” apart from a silent server: an empty accounting file and a server that didn't answer are different things.
 Enlarge
“No sending” is normal, not an alarm.
The history depth screen shows how much accounting data is kept on the server and how much has already been collected in the Hub. It tells you whether any days were lost: files on the server live for a week, and whatever isn't collected in time disappears. In the example the server keeps 7 days under the delete-after directive, which the Hub writes itself, while the Hub holds 9 days and 122,769 records, with 0 missed days. Days still on the server don't count as gaps. If a server doesn't answer for a long time, its days will sooner or later be deleted from the server and become a real gap — so it's worth keeping this counter at zero.
 Enlarge
Days still on the server don't count as gaps.
Next is the run log: scheduled nightly runs and manual ones, each expanding into a console with a detailed step-by-step record. At the end of the console is the check for each server, and a separate block gathers the warnings and errors of recent runs. This is where you look for the cause if a collection finished “with a warning”.
The run log is the list of collection runs with the result of each: time, number of servers and files, records, duration and the check result. A row expands into a console where you follow the run server by server. In the example the two nightly runs on Oct 21 and Oct 23 finished with “success”, and the manual run on Oct 23 at 22:24 is expanded: SSH connection, pmtastats over 8 files, “4,330 records parsed in 4.1 s”. Console lines are in the Hub's interface language, with numbers and server names. The nightly runs took 1 m 15 s each, 104 files each, 122,462 and 122,769 records. If a run failed, the result of its check is at the end of the console, on the next screen.
 Enlarge
Console lines are in the Hub's interface language.
The end of the console shows the result of the run — the check for each server: the server name and twelve checks in a column. This is exactly where you see why the result wasn't published. In the example the bounce breakdown by vMTA didn't add up on cl-01: 197 versus 195 — this happens when records are appended to the current day's file while it's being parsed. So the result wasn't published, and the statistics tabs still show the nightly run's data. The run's result — 15 of 15 servers, 104 files, 122,032 records, 75.4 s. Unchecked numbers didn't reach the screens: they keep the data that added up.
 Enlarge
The tabs show the nightly run's data.
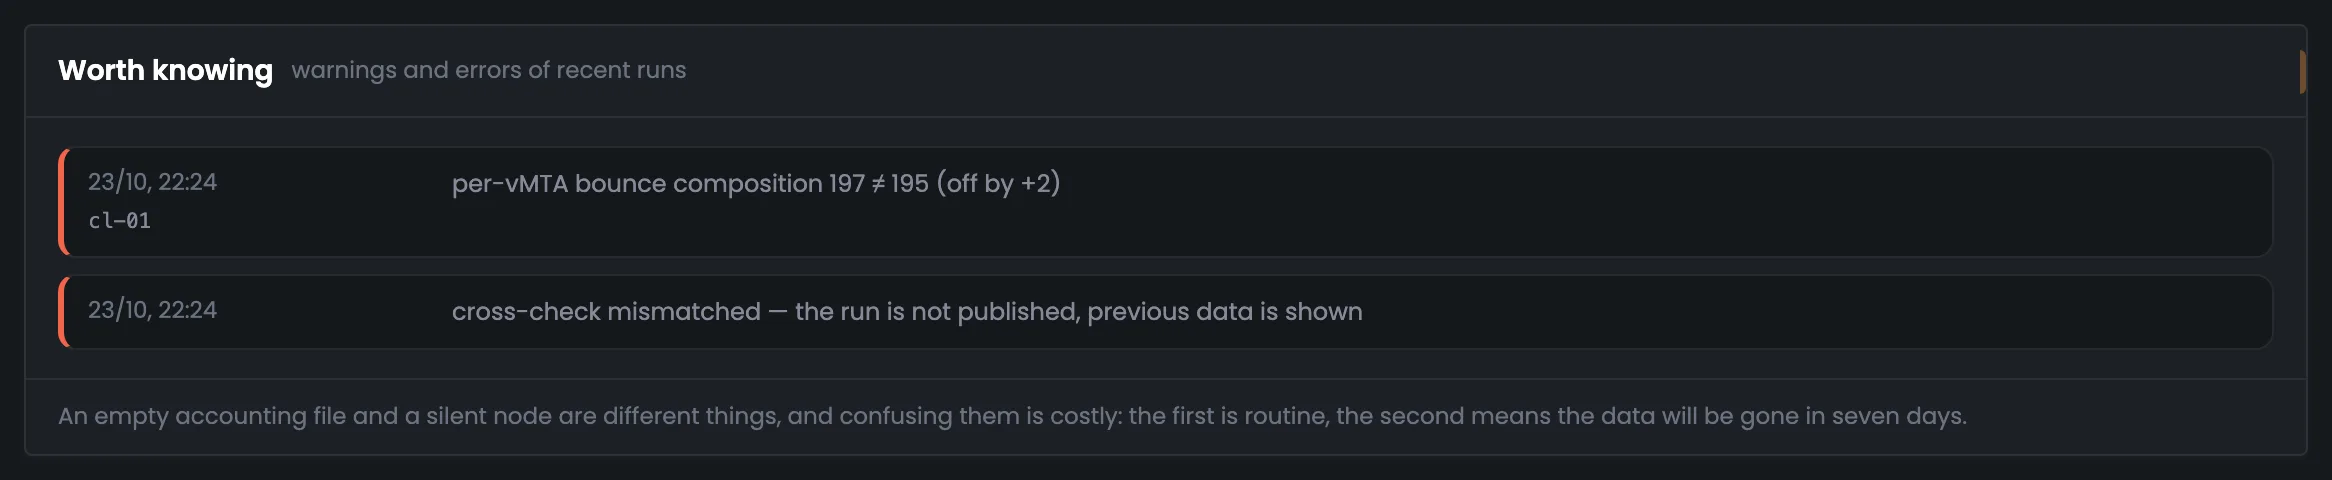
The “Worth knowing” block gathers the warnings and errors of recent runs in one place, so you don't have to read the whole console. Each entry names the server and gives the numbers. In the example there's one line here: the check didn't add up on cl-01 — “run not published, previous data is shown”. The overall run result doesn't go here, because it isn't an event. Look here after every run that finishes “with a warning”. Under the list is a reminder: an empty accounting file and a silent server are different things, and mixing them up is dangerous. The detailed course of the run is in the log console above.
 Enlarge
An empty accounting file and a silent server are different things, and mixing them up is dangerous.
06 / Questions about collection runs
In short: how often collection runs and why you can trust the numbers on the screen.
EnlargeA check that didn't add up — with the server and the numbers; the result isn't published.
Once a day on a schedule, at 03:40 in the Hub's time zone; you can also start it manually.
The result of the MTA's report utility, not the accounting files themselves.
Totals by domain, vMTA, day and category must add up to the server's overall total.
The result isn't published, the tabs show the previous data, and the console tells you where and which check failed.
It was polled and sent nothing: “no sending” is normal.
A week — the Hub writes the delete-after 7d directive into the accounting settings itself.
Only days that are no longer on the server and that no run collected.
The Hub's interface language — along with the check numbers and server names.
07 / Next step
Collection runs is a service tab. The whole week of sending is on the “PMTA statistics” overview.
How the Hub sets up PowerMTA accounting on the server — in “Configurations”.