Automatic rules. Pause sending on complaints and bounces.
A rule watches complaints, bounces, the queue, blacklists and a server that has gone silent — and when its condition is met, it holds back mail to a mailbox provider or stops sending.
Checks run every five minutes, with no AI and no credits. A new rule starts by only watching.
By the time a person notices that a mailbox provider has started complaining, hundreds of emails are already gone. Automatic sending rules are checked every five minutes, day and night. But a new rule starts by only observing: it counts, notifies and writes to the log without stopping anything — and it is put to work only after a check against history.
From observing to enforcing
01 · ObservingCounts and notifies
02 · CheckAgainst 7 days of history
03 · EnforcingActs on its own
04 · LogEverything recorded
Rules are moved to enforcing one at a time — with a button in the row, after you see how many times each would have fired
Automation summary
Every 5 minutes
Four rules are defined: one is enforcing, three are observing. Zero triggers in 24 hours, no rules without data. “Check now” runs a check without waiting for the schedule.
HMTA-Hub
check
Rules defined4 · 1 enforcing
3 observing0 triggers in 24 h
Moving to enforcing
With confirmation
Before switching a rule on, the Hub tells you what will change: for a rule that stops sending — which actions it will start taking on its own; for a notifying rule — only the mode label.
HMTA-Hub
mode
Observing → enforcingWith confirmation
written to the logone rule at a time
02 / An example rule
Pause a mailbox provider when complaints go above 0.3%.
The rule fires when complaints reach at least 0.3% and at least 500 emails were sent over six hours: on twenty emails any share is just chance. It doesn’t stop the whole server — only mail to the worst mailbox provider.
Complaints rule
01 · Complaints≥ 0.3% over 6 h
02 · And volume≥ 500 emails
03 · ActionStop provider
04 · Duration1 hour
A rule can fire only when all of its conditions are met at once
Check against history
Once in 7 days
The rule window shows how many times the rule would have fired on your data, with a chart next to the threshold. Changed the threshold — click “Recalculate”, and the number updates before the rule starts acting.
HMTA-Hub
history
Would have firedOnce in 7 days
threshold 0.3%now — 0%
A trigger on mta-04
Microsoft only
Complaints at 0.48% against a 0.3% threshold: the rule held back mail to Microsoft — outlook.com, hotmail.com, live.com, msn.com and office365.com — and an hour later the pause lifted by itself. The rest of the server’s mail kept going out.
Mmta-04
stop
HeldMicrosoft · 1 hour
0.48% complaintsQueue(s) paused
03 / Limits on automation
Protection against unwanted triggers.
Automatic rules must not stop more than they should. That is why they have safeguards: a limiter of no more than 10 actions an hour across all servers, a pause after manual intervention and a “do not repeat” interval. Every trigger is written to the feed and the operations log.
Limiter
10 actions an hour
Across all servers together; once they are used up, a person decides.
Manual intervention
Hands off for half an hour
If a person did something on a server by hand, automation leaves it alone for half an hour.
Cooldown
Do not repeat
A rule fires again no sooner than the set interval — 6 hours for the complaints rule.
Undo
While the action is in effect
The feed has an “undo” link next to the action.
04 / Complaints and backoff
FBL complaints and PowerMTA backoff in plain sight.
Rules count what comes from the servers: deliveries, bounces, complaints and temporary failures, added up by the hour. Two blocks show where complaints come from — mailbox providers’ feedback loops (FBL) — and which queues PowerMTA has already put into backoff on its own, that is, slowed down.
Provider feedback loops
FBL
Mailbox providers send complaints only to those who have set up a feedback loop with them. 25 of 26 domains have fbl.<domain> records, and complaints are arriving — 179 in 30 days, the last one 9 hours ago.
FFBL
complaints
In 30 days179 complaints
25 of 26 domainslast one 9 h ago
What PowerMTA did on its own
BACKOFF
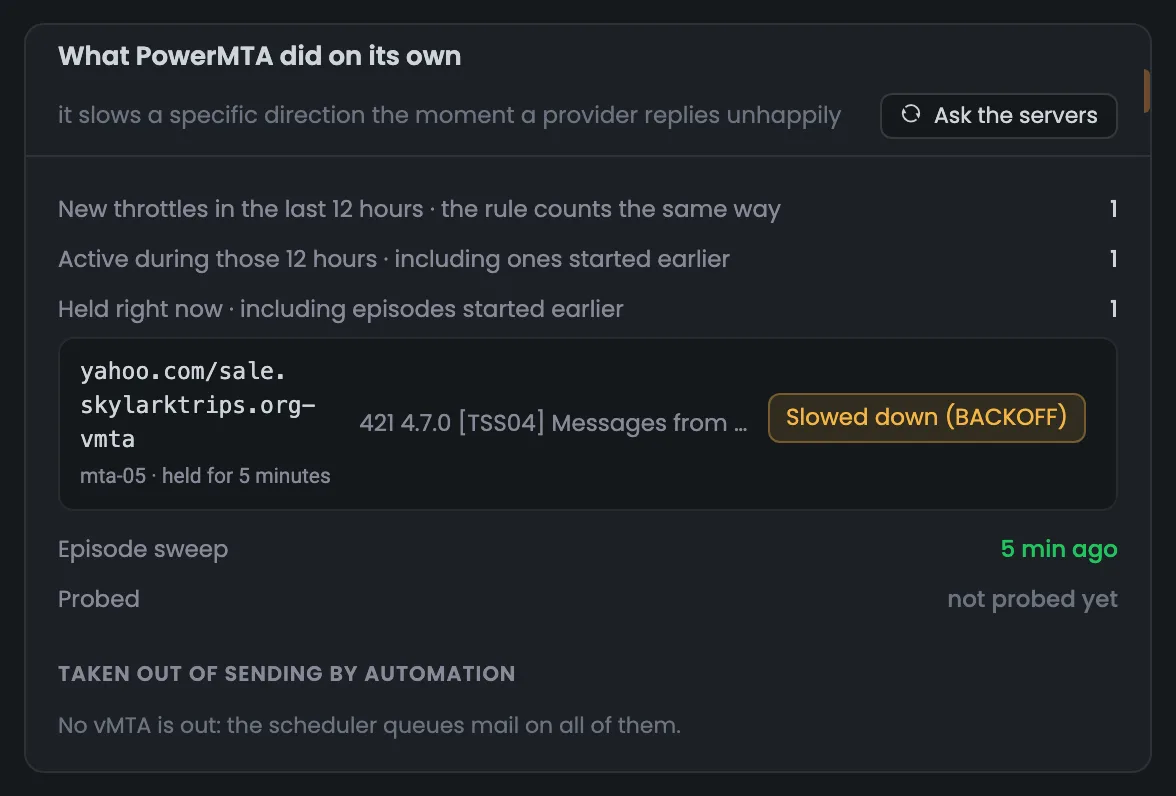
When it gets an unhappy answer from a mailbox provider, PowerMTA slows down by itself. The Hub checks the queues every five minutes: right now the yahoo.com queue on mta-05 is slowed down after “421 4.7.0 [TSS04]”.
YYahoo
421
mta-05 · yahoo.comSlowed down
BACKOFFchecked every 5 min
If there are no complaints at all, the FBL block says so: “the channel is silent”, not “no complaints”.
05 / The interface in detail
The “Policies” section — 13 screens.
Summary, the list of rules, ready-made rules, complaints and slowdowns, the trigger feed, and the rule window with the check against history. Above each screenshot: why the screen matters. Below it: what it shows.
Summary and rules
3 screens
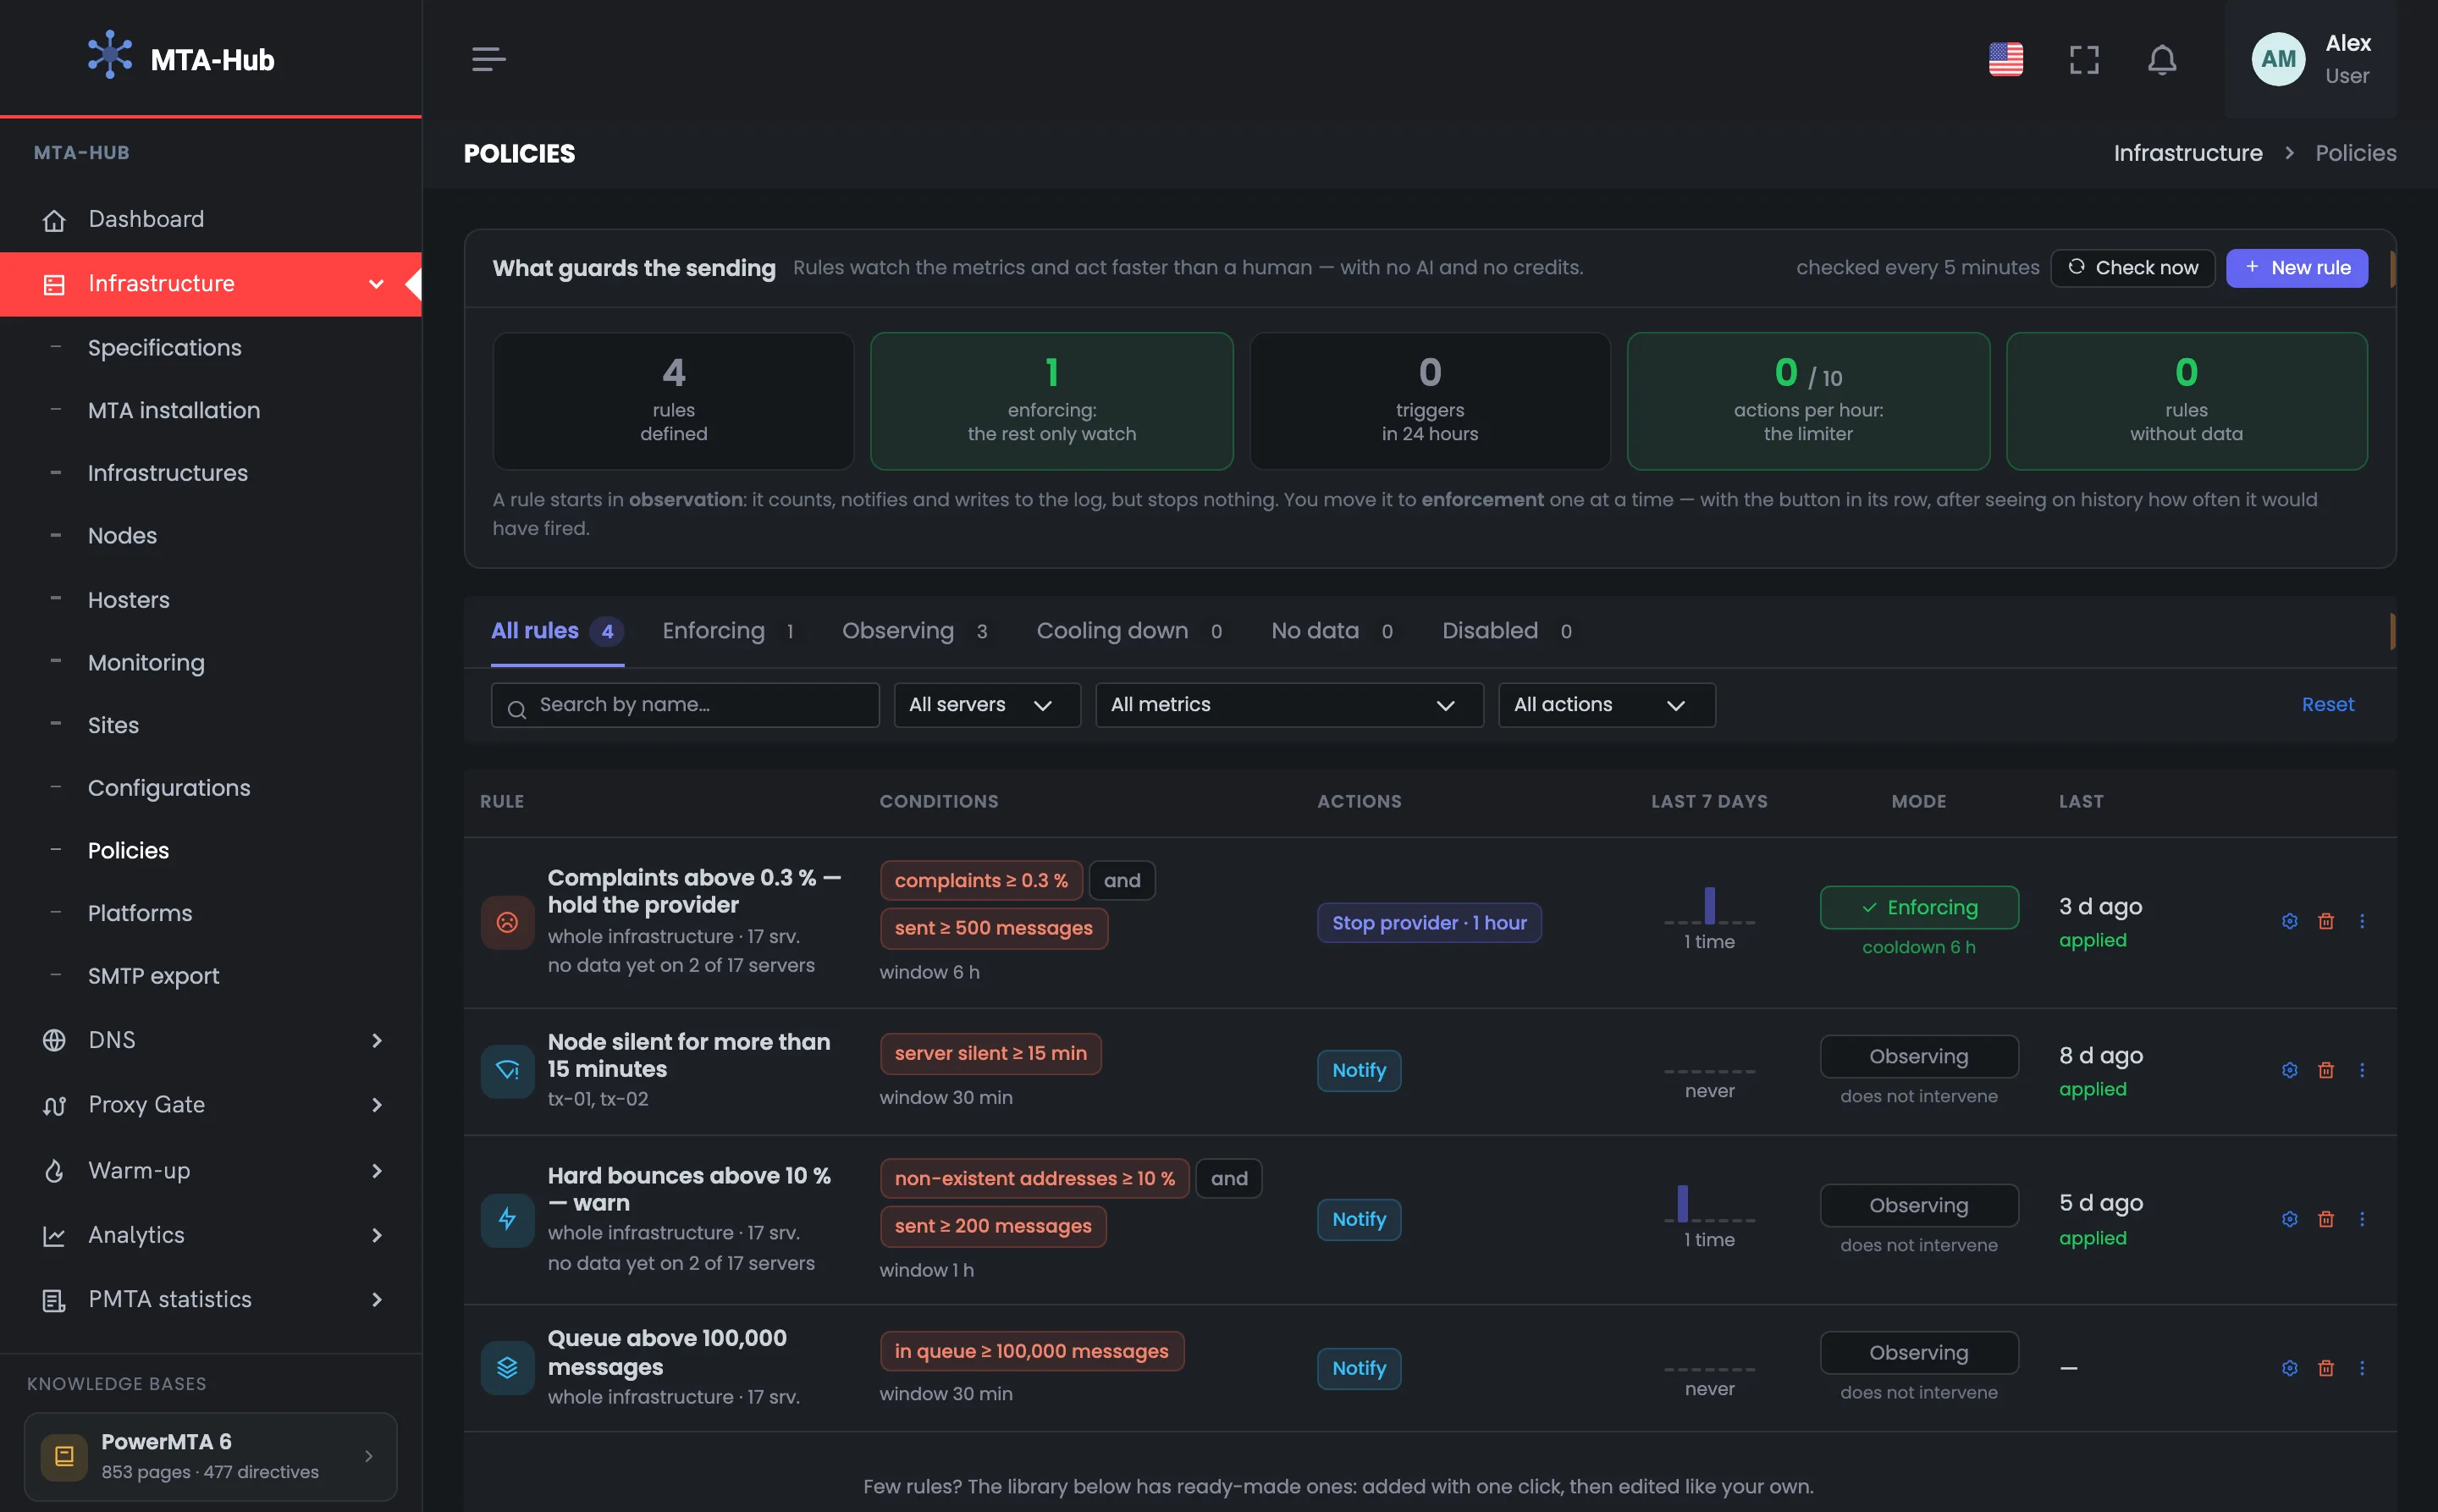
The page opens with the automation summary: how many rules are defined, how many of them are enforcing, how many triggers there were and how many actions the limiter has left. Below are filters by state, server and metric. Then come the automatic rules themselves, one row each, with conditions, actions and triggers over the week.
01
What guards your sending
Automation summary
The automation summary is the first thing you see on the Policies page. Five tiles tell you whether everything is watched: how many rules are defined, how many act on their own, how many triggers there were in 24 hours and how many more actions the limiter allows. The “Rules without data” tile warns you if some rule has nothing to count. The “Check now” button checks all rules without waiting for the five-minute schedule, and “New rule” creates a rule of your own. Open the summary to make sure in a second that automation is working: if there were many triggers in 24 hours or the limiter is running low, the trigger feed below shows what happened.
EnlargeScreen 01 · What guards your sending. An example from the MTA-Hub interface.
Rules defined — 4.
Enforcing — 1 — the others only watch.
Triggers in 24 hours — 0.
Actions per hour — 0 of 10 — the limiter.
Rules without data — 0 — every rule has something to count.
The caption under the tiles is a reminder of a rule’s path from observing to enforcing.
02
Picking rules
State, server, metric
The filter bar above the list helps once you have many automatic rules. States split them into groups: enforcing, observing, cooling down after a trigger, without data and disabled. Search by name and filters by server, metric and action quickly find the rule you need. This makes it easy to go through one server or one metric — all complaint rules, for example — without scrolling the whole list. The “cooling down” state shows rules that fired recently and are waiting out their “do not repeat” interval, and “no data” shows rules that have nothing to count. These two filters are a good place to start.
EnlargeScreen 02 · Picking rules. An example from the MTA-Hub interface.
States — all, enforcing, observing, cooling down, no data, disabled.
Search and filters — by name, server, metric and action.
If you pick a server, the table shows what is happening with the rules on that server.
03
Rules
One row, one rule
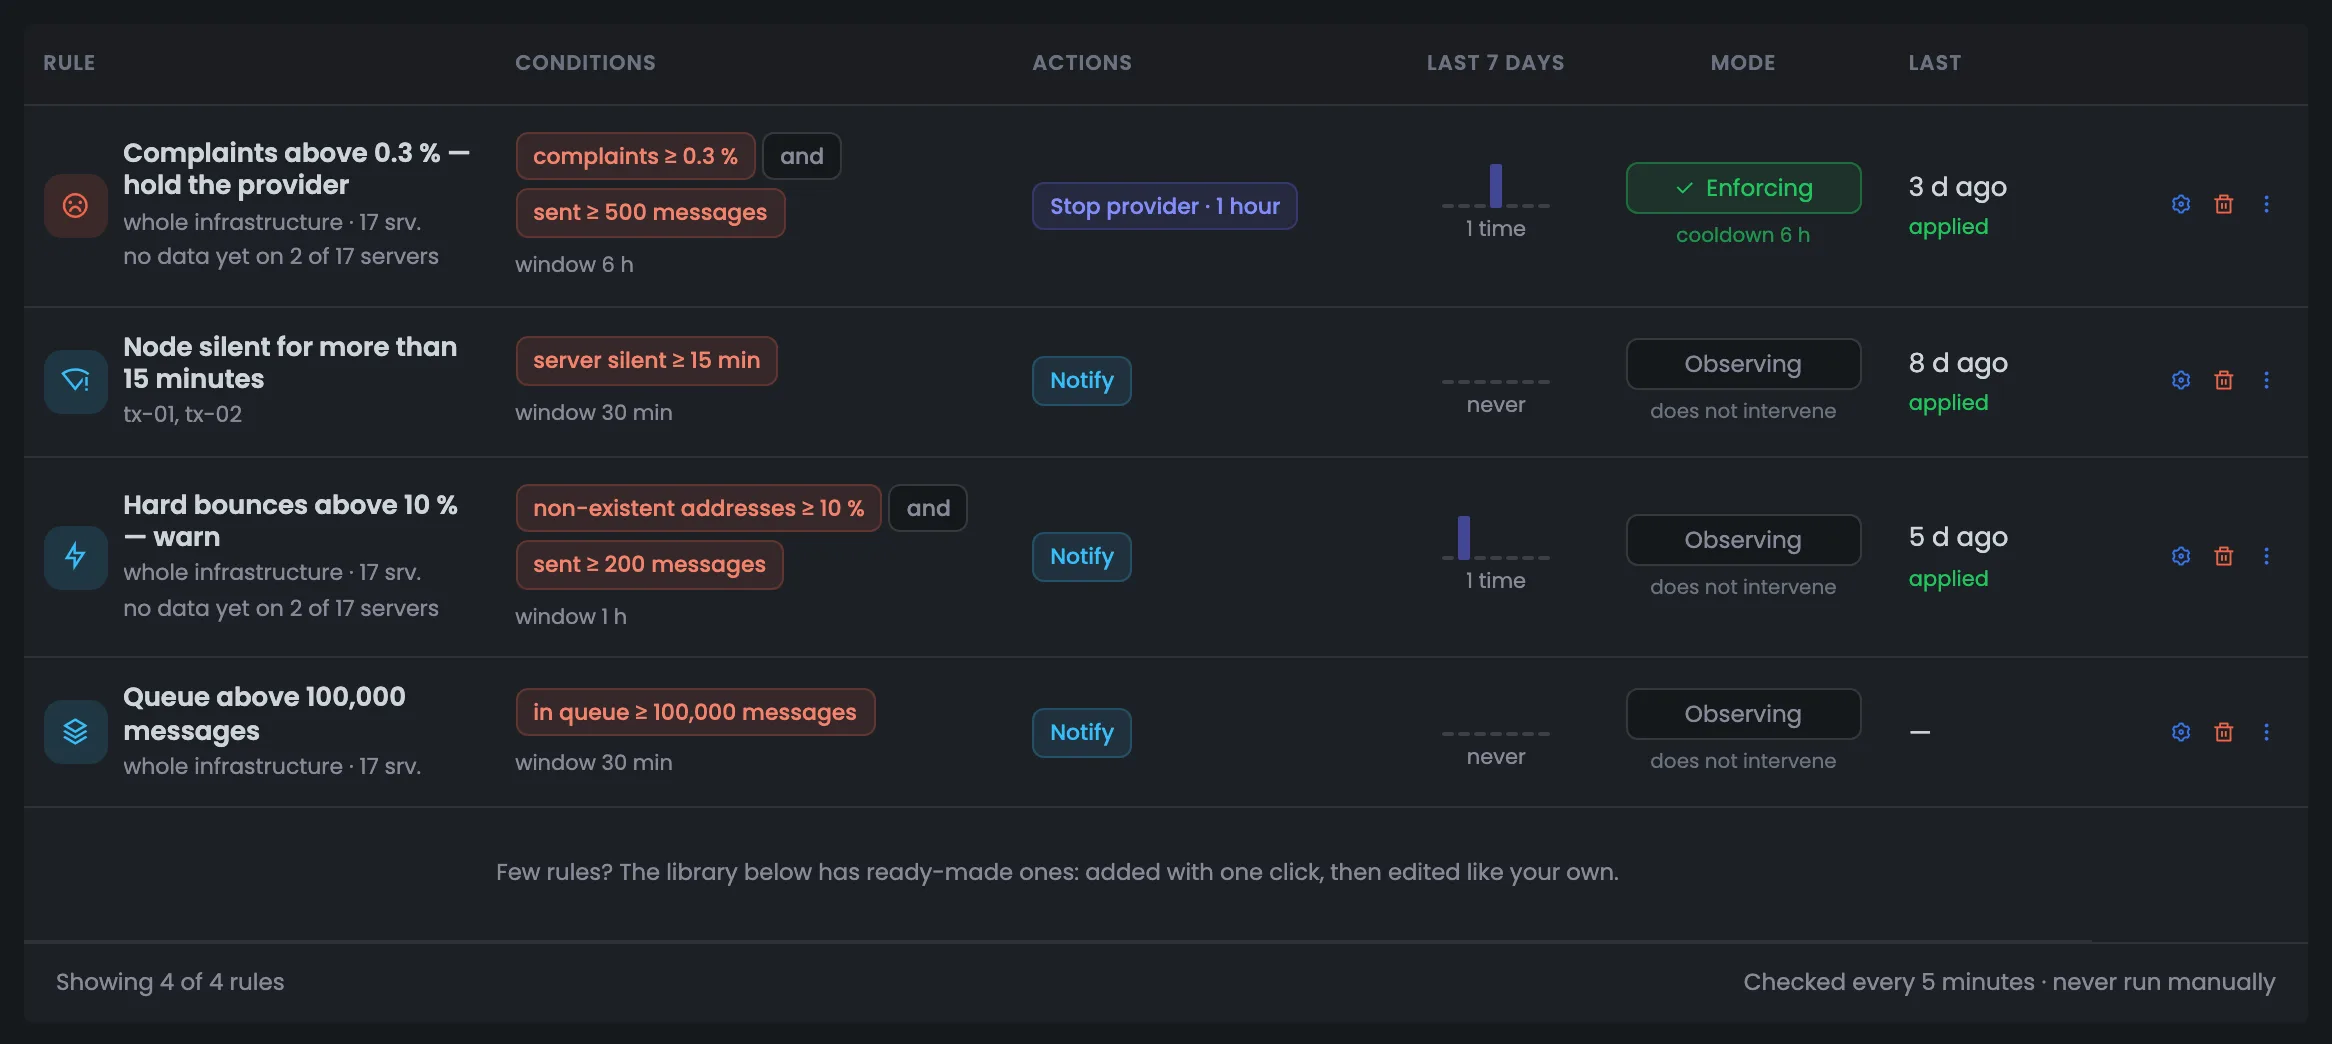
The list of automatic sending rules: one row is one rule. A row shows where the rule applies, its conditions and actions, how many times it fired over the week — as bars by day — its mode and when it last fired. The example has four rules: on complaints, on a silent node, on hard bounces and on queue size. If a rule has nothing to count on some servers, the row says so right there. On the right — settings, delete and the rule menu. Watch the weekly bars: a rule that fires every day is worth revisiting in the rule window with the check against history.
EnlargeScreen 03 · Rules. An example from the MTA-Hub interface.
Complaints above 0.3% — and at least 500 emails over 6 h — “Stop provider” for an hour; enforcing, 6 h cooldown.
Node silent for more than 15 minutes — only tx-01 and tx-02 — notify; observing.
Hard bounces above 10% — and at least 200 emails an hour — notify; observing.
Queue above 100,000 emails — notify; never fired this week.
No data yet — on 2 of 17 servers — they have no sending domains.
The mode is switched with a button right in the row.
Ready-made rules and signals
3 screens
Next is a library of ready-made rules for common problems: complaints, blacklists, non-existent addresses, an overflowing queue, a silent server. Next to it are two blocks about the signals the rules rely on. The first shows where complaints come from (FBL), the second — which queues PowerMTA has already slowed down on its own.
04
Ready-made rules
For common problems
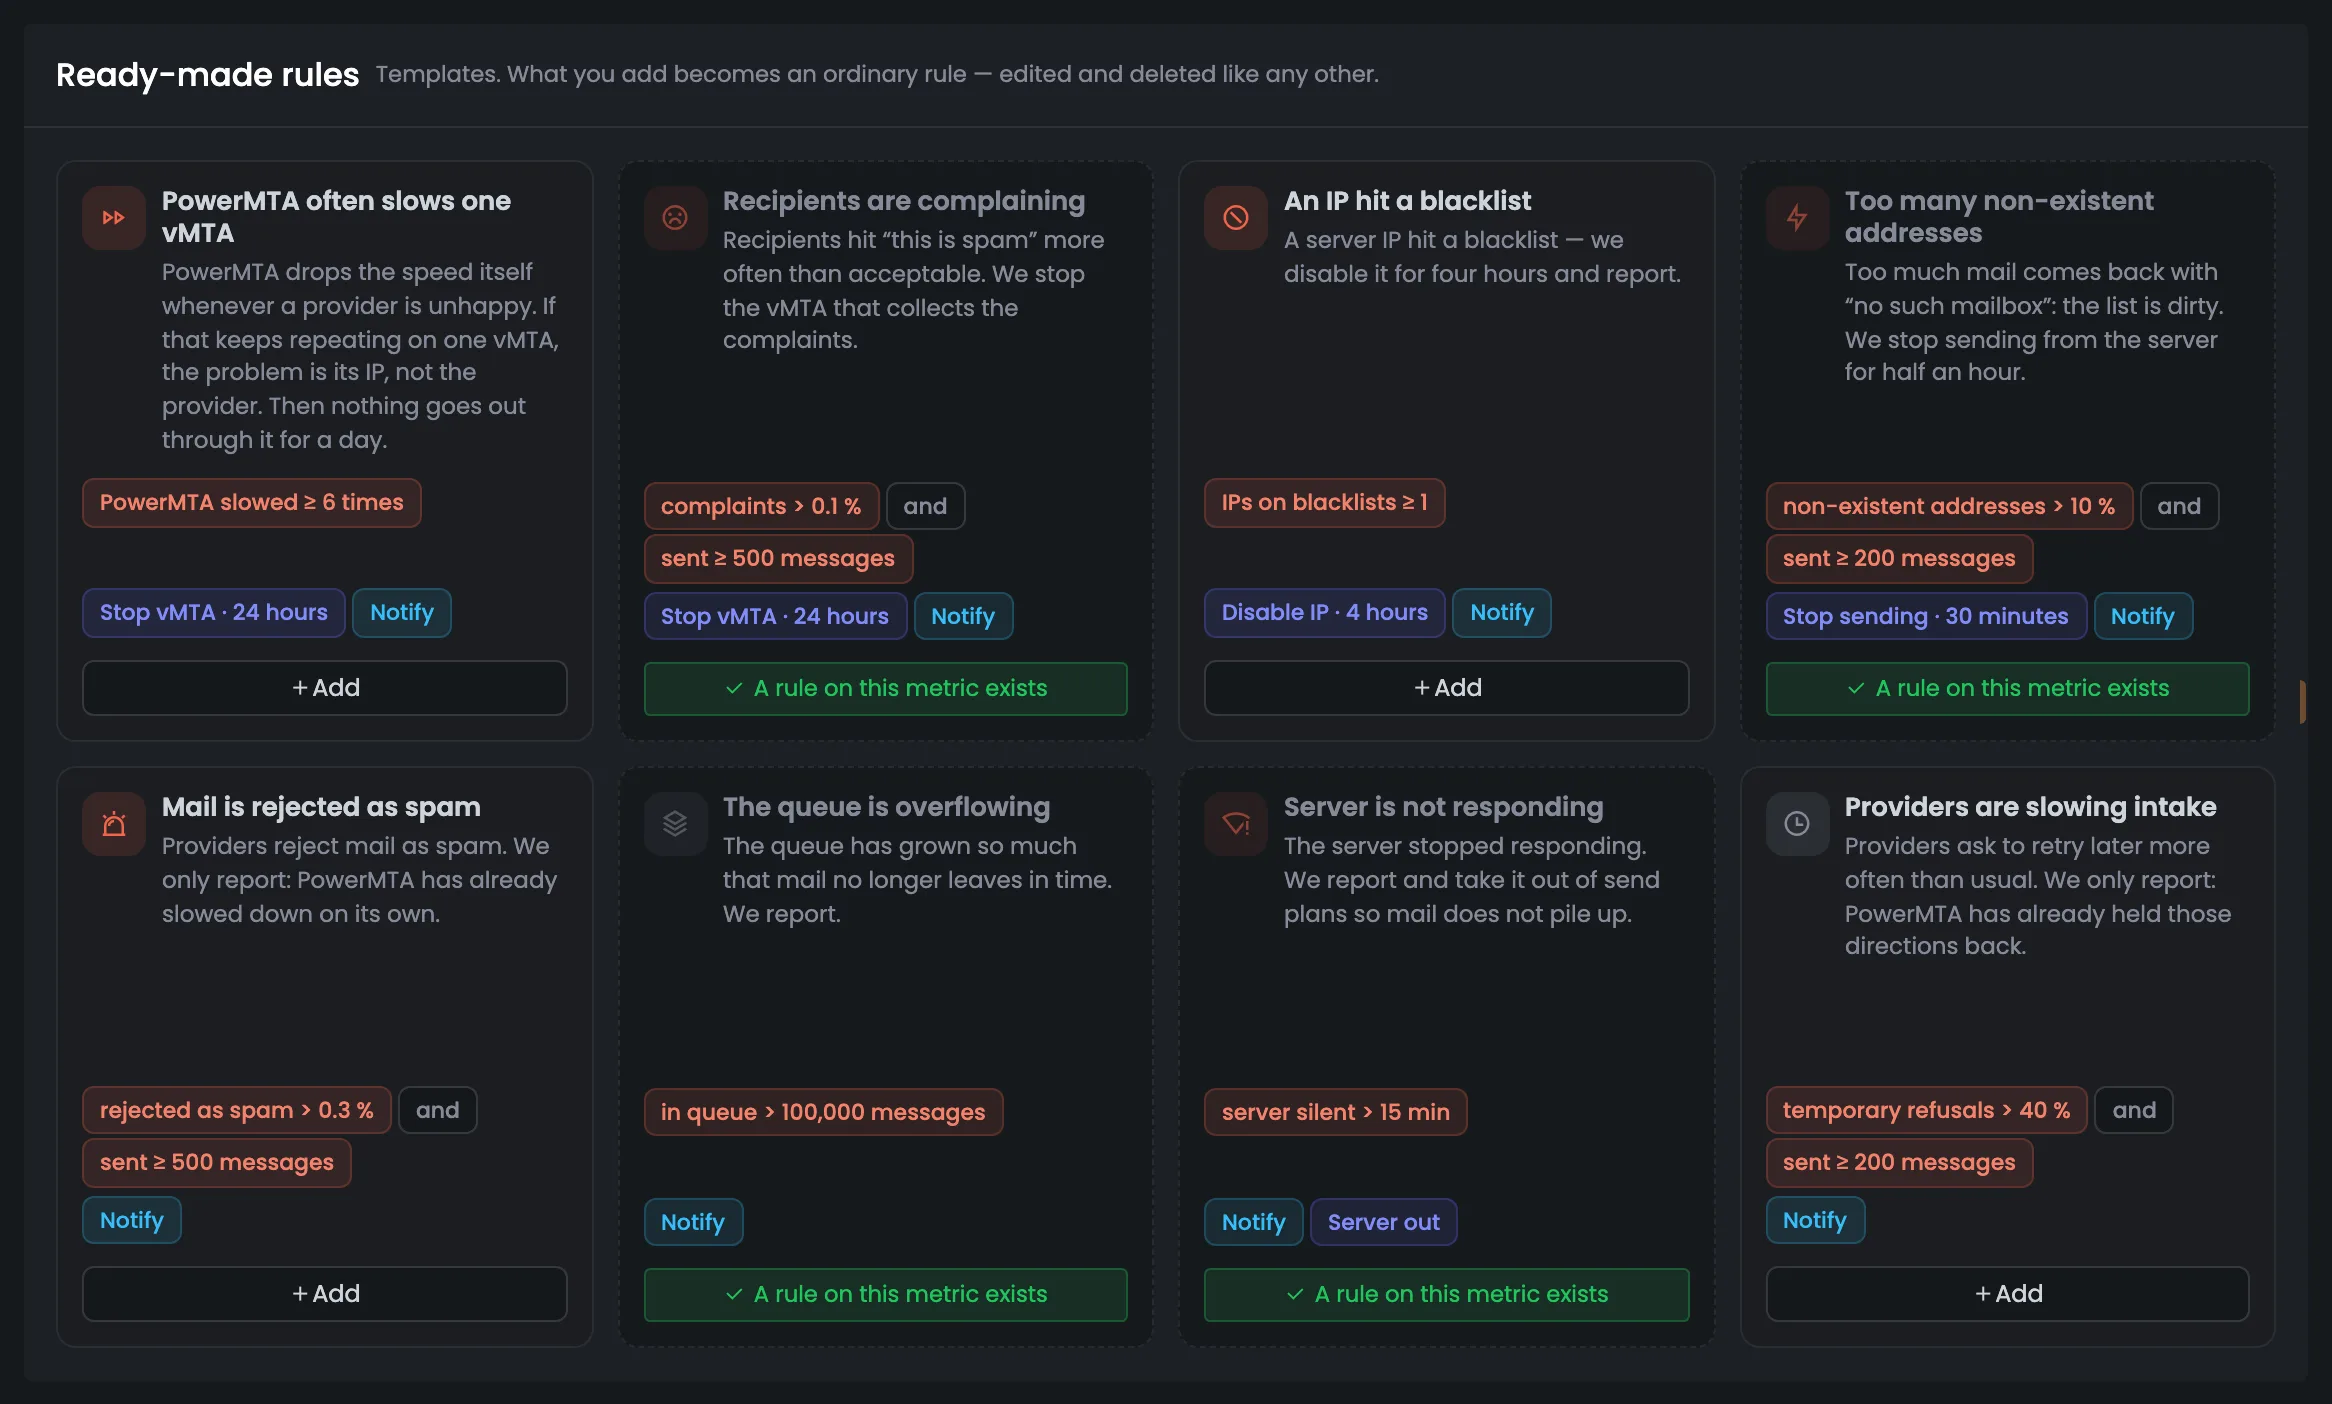
The library of ready-made rules covers common mailing problems: a vMTA keeps slowing down, recipients complain, an IP got on a blacklist, too many non-existent addresses, emails rejected as spam, the queue overflowing, a server not responding. Each card has a plain-words description, conditions and actions, so you can add a rule without building it by hand. An added rule starts in observing mode. If a rule on the same metric already exists, the card fades — it is simpler to adjust the existing one. This is a good place to start with policies: a ready-made rule is already set up for a common problem, and you can tune the threshold later in the rule window.
EnlargeScreen 04 · Ready-made rules. An example from the MTA-Hub interface.
Problems — a slow vMTA, complaints, blacklists, non-existent addresses, spam rejections, the queue, a server not responding, providers slowing intake.
An added rule — becomes an ordinary rule and starts in observing mode.
A faded card — “A rule on this metric already exists” — it is simpler to adjust the existing one.
After that, a ready-made rule is edited like your own.
05
Provider feedback loops (FBL)
Where complaints come from
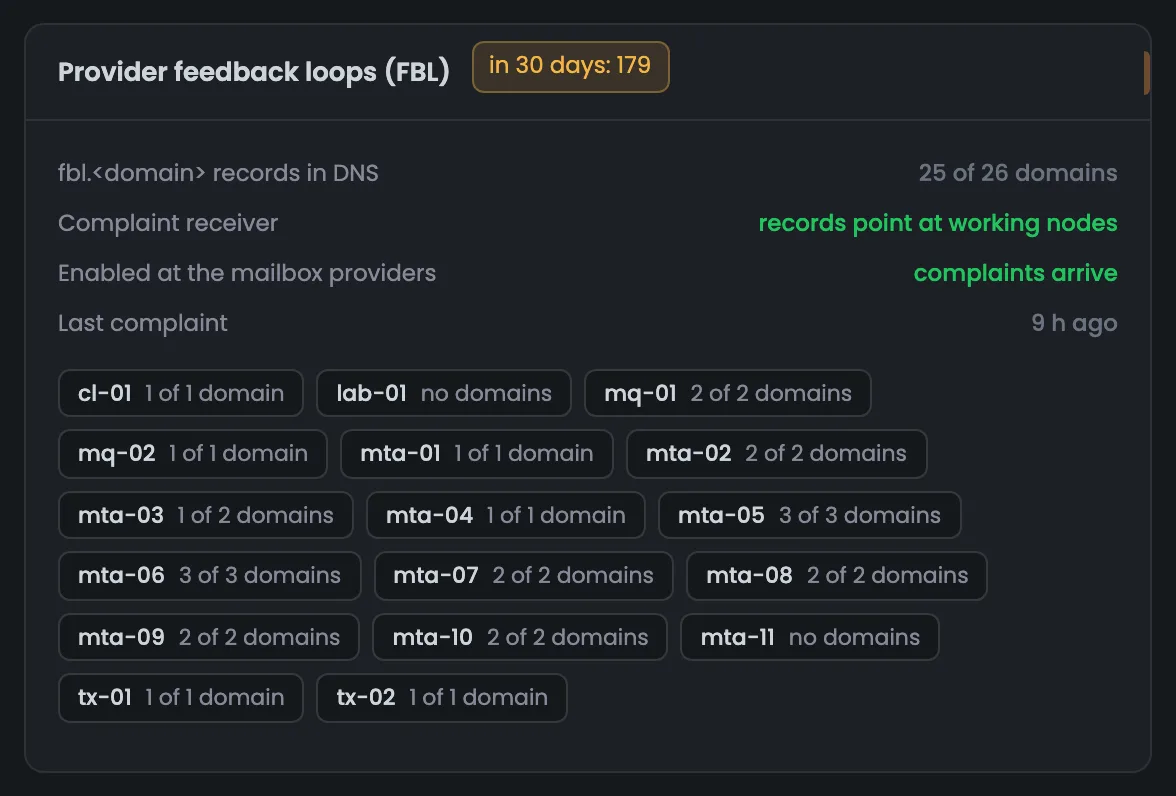
The FBL block shows where the automatic rules get their complaints from. Mailbox providers send complaints only to those who have set up a feedback loop (FBL) with them, and PowerMTA receives them at fbl@fbl.<domain>. The block checks the chain step by step: are the records in DNS, do they point to working servers, and do complaints actually arrive. Below is a breakdown by server. If no complaints arrive, the complaints rule has nothing to count, so check this block first. If a server has the record on only some of its domains, complaints for the other domains will never reach the rule.
EnlargeScreen 05 · Provider feedback loops (FBL). An example from the MTA-Hub interface.
DNS records — 25 of 26 domains.
Complaint receiver — the records point to working nodes.
Set up with providers — complaints are arriving.
In 30 days — 179 complaints, the last one 9 hours ago.
By server — how many of the server’s domains have the record.
If there are no complaints at all, the block says “the channel is silent”, not “no complaints”.
06
What PowerMTA did on its own
Queue slowdowns
PowerMTA reacts to mailbox providers on its own too: when it gets an unhappy answer, it immediately slows down sending to that provider — it switches to BACKOFF mode. The Hub checks the queues every five minutes and shows what is slowed down right now and with which provider answer. In the example it is the yahoo.com queue on mta-05 after Yahoo’s answer “421 4.7.0 [TSS04]”. The block helps you tell what PowerMTA held back by itself from what the Hub’s rules did, and spot vMTAs that automation took out of sending. Look here when mail to some provider is going slowly: if the queue is in BACKOFF, PowerMTA has already slowed down by itself, and the provider’s answer hints at the reason.
EnlargeScreen 06 · What PowerMTA did on its own. An example from the MTA-Hub interface.
Now — the yahoo.com queue on mta-05 is in BACKOFF mode.
Yahoo’s answer — “421 4.7.0 [TSS04]…”.
Counters — how many slowdowns started in 12 hours and how many were running during that time.
vMTAs taken out — none right now.
Slowdowns are counted the same way as in the “PowerMTA often slows one vMTA” rule.
Triggers
2 screens
The trigger feed shows every decision the automation made: what the rule saw, what it did and how it ended. While an action is in effect, you can undo it right from the feed. Moving a rule from observing to enforcing is confirmed in a separate window that says what will change.
07
Triggers
The automation’s decision feed
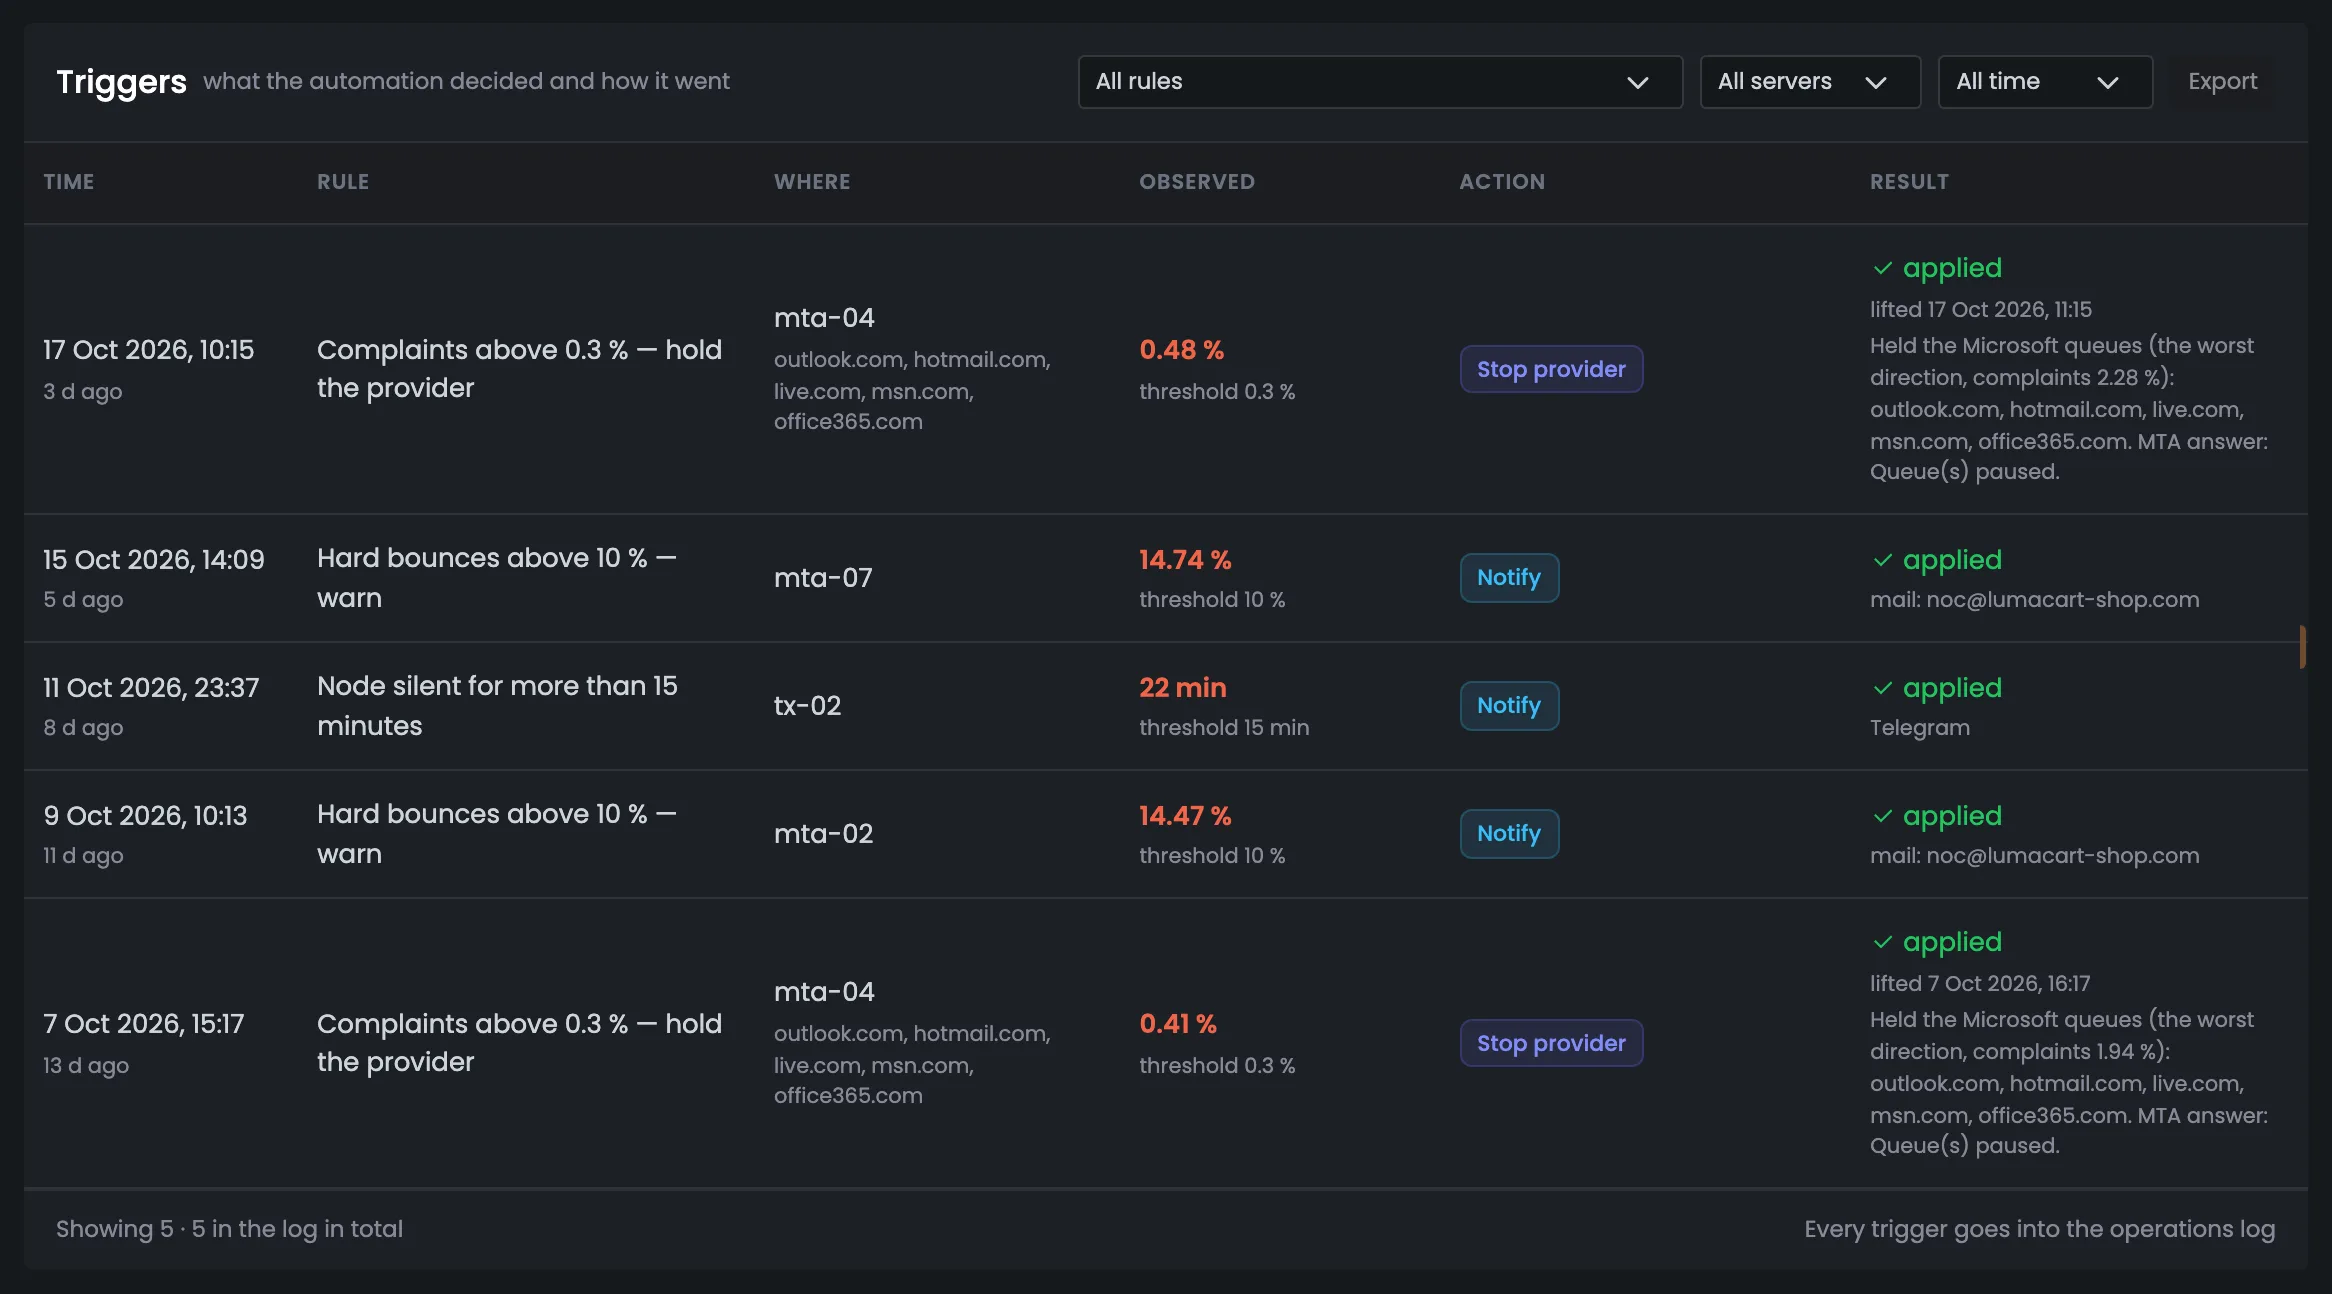
The trigger feed is a log of the automation’s decisions. Each entry shows when and which rule fired, on which server, what value it saw and at what threshold, what it did and how it ended, down to the MTA’s answer. In the example there are five entries over all time: pauses of Microsoft mail on mta-04, notifications about hard bounces and about a silent tx-02. You can filter the feed by rule, server and period and export it to CSV — to go over a case with colleagues, for example. Open the feed when a notification arrives or a provider’s queues turn out to be paused: here you see which rule did it and why. While an action is in effect, you can cancel it with the “undo” link.
EnlargeScreen 07 · Triggers. An example from the MTA-Hub interface.
Oct 17 and Oct 7 · mta-04 — complaints 0.48% and 0.41% — Microsoft queues held, the pause lifted by itself an hour later.
Oct 15 and Oct 9 · mta-07, mta-02 — hard bounces 14.74% and 14.47% — email notification.
Oct 11 · tx-02 — silent for 22 minutes — Telegram notification.
While an action is in effect, there is an “undo” link next to it. Every trigger also goes into the operations log.
08
Moving to enforcing
What will change
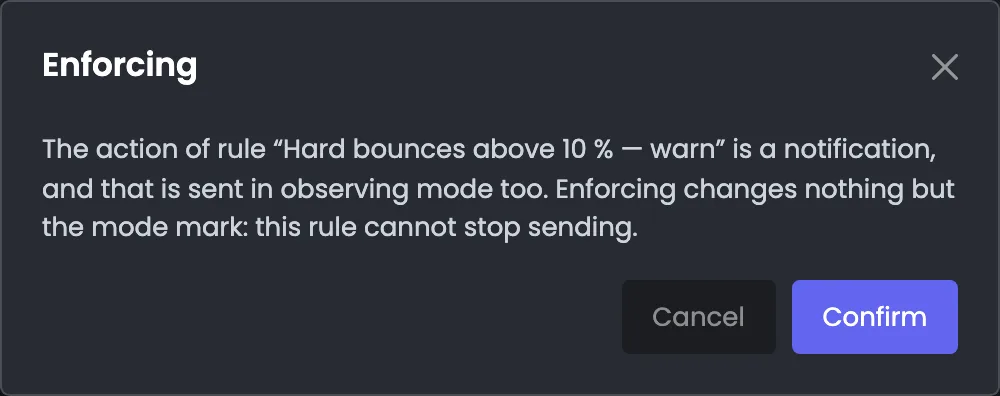
The confirmation window appears when a rule is moved from observing to enforcing. The Hub says plainly what will change: for a rule that stops sending — which actions it will start taking on its own; for a rule that only notifies — that nothing changes except the mode label. Notifications are sent in observing mode too, and such a rule can’t stop sending. So putting a rule to work is never a surprise. Move a rule to enforcing after checking it against history in the rule window: if it would have fired too often, adjust the threshold first.
EnlargeScreen 08 · Moving to enforcing. An example from the MTA-Hub interface.
A rule that stops sending — which actions it will start taking on its own.
A notifying rule — nothing changes except the mode label.
Every such switch is written to the log.
Rule window
5 screens
Each rule opens in its own window. There the conditions are written as one sentence, and you get a check against seven days of history, actions, scope, mode and the trigger history. You need the window both to create a new rule and to understand why an existing one fired.
09
Rule window
Everything about a rule in one window
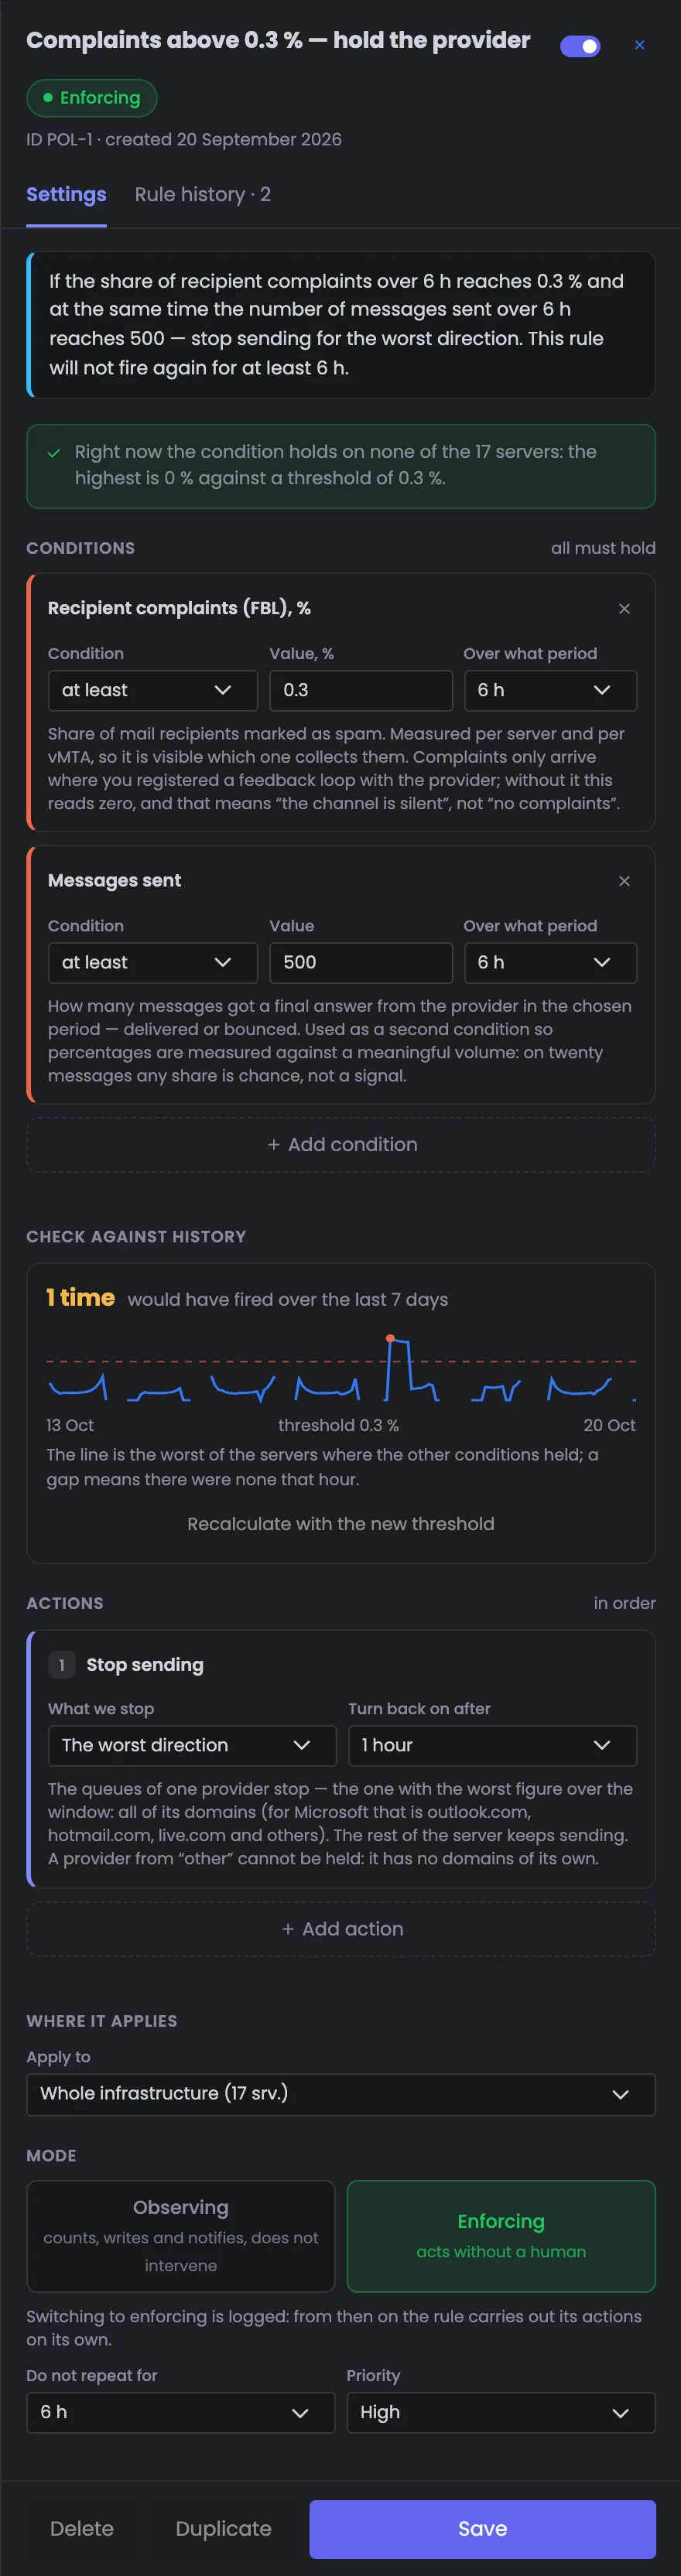
The rule window gathers everything about a rule in one place: the name and the on switch, the state, the number and the creation date. Below are two tabs — settings and this rule’s trigger history. Settings go in order: conditions, the check against history, actions, scope and mode, so a rule reads top to bottom like instructions. At the bottom — delete, duplicate and save; a duplicate is handy for creating a similar rule with a different threshold. You open the window from the rule’s row — to set it up, check it against history or find out why it fired. The “History” tab shows the triggers of this rule only.
EnlargeScreen 09 · Rule window. An example from the MTA-Hub interface.
Settings — conditions, check against history, actions, scope and mode.
History — this rule’s triggers.
At the bottom — delete, duplicate and save.
The window opens from the rule’s row.
10
Conditions
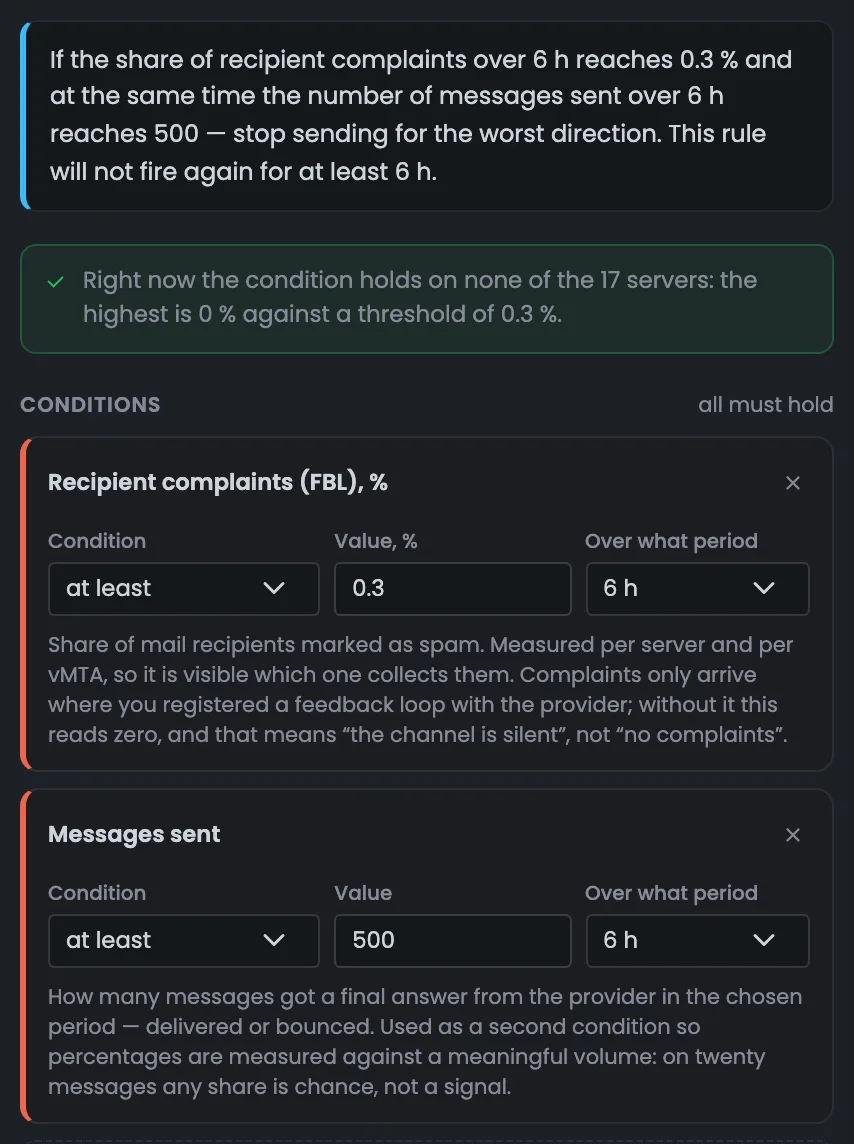
The rule in one sentence
The conditions block shows the automatic rule as one sentence in plain words — this makes it easier to be sure it does exactly what you intended. Under the sentence — what the rule sees right now: whether the condition holds on at least one server and what the highest value is. In the example the highest complaint rate is 0% against a 0.3% threshold, so there is still room. Below are the conditions themselves: the metric, the comparison, the value and the period, with an explanation of what exactly is counted. If a value is already close to the threshold, the rule may fire soon — check it against history in advance. It fires only when all conditions hold at once, including the email volume.
EnlargeScreen 10 · Conditions. An example from the MTA-Hub interface.
Sentence — “If the complaint rate over 6 h reaches 0.3% and emails sent over 6 h reach 500 — stop the worst direction”.
Now — the condition holds on none of the 17 servers; the highest value is 0%.
Conditions — metric, comparison, value and period — with an explanation.
A rule can fire only when all of its conditions are met at once.
11
Check against history
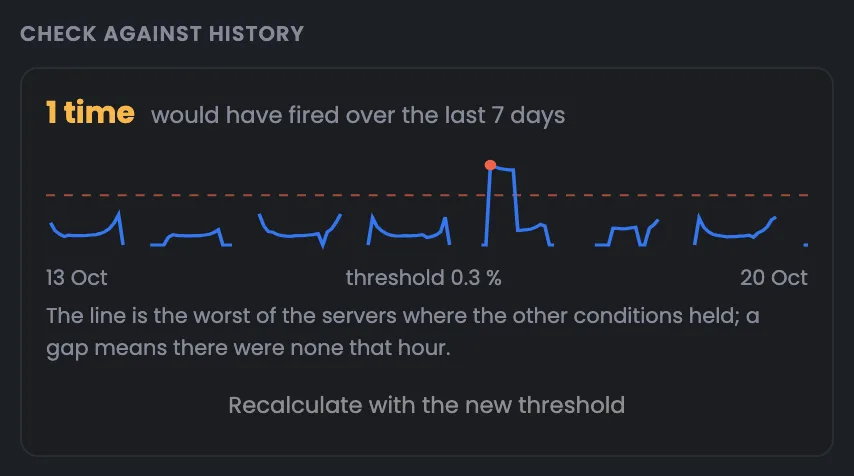
How many times it would have fired
The check against history answers the main question before switching a rule on: is it too strict. The Hub runs the rule over your data for the last seven days and shows how many times it would have fired, next to a chart of the metric and the threshold. The line is the worst of the servers where the other conditions held; a dot is a trigger, taking the “do not repeat” interval into account. Changed the threshold — click “Recalculate”, and the result updates before the rule starts acting. If the number of triggers seems high, raise the threshold or the volume and recalculate: this is how you fit a rule to your own sending before switching it on.
EnlargeScreen 11 · Check against history. An example from the MTA-Hub interface.
Result — once.
Line — the worst of the servers where the other conditions held.
Gap — there were no such servers that hour.
Recalculate with a new threshold — the number updates before the rule is switched on.
At night no server reached 500 emails in six hours — hence the gaps in the line.
12
Actions, scope and mode
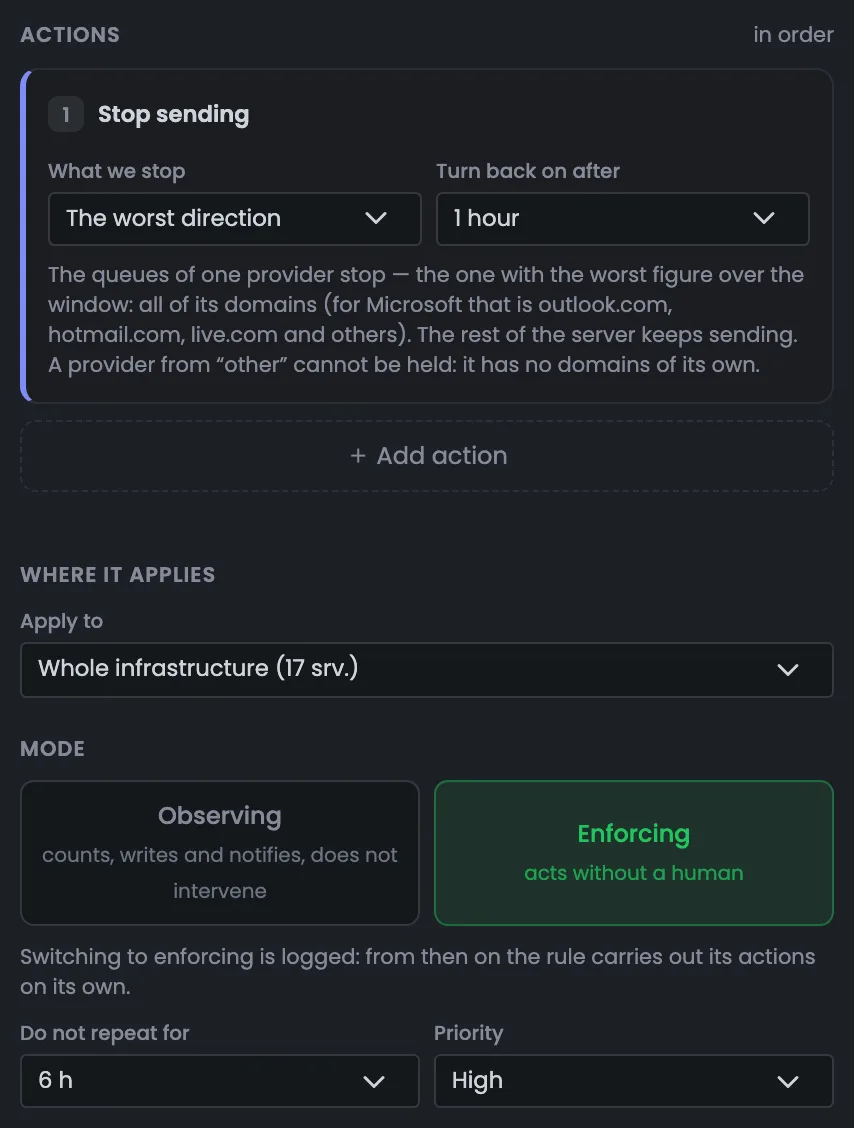
What it does and where
The lower part of the window sets what the rule does, where and in which mode. Actions run in order. Stopping sending comes in two kinds: all sending from the server, or only the worst direction — mail to the one mailbox provider with the worst figure over the period, across all its domains. A stop duration is required, so queues never stay switched off forever. Below — where the rule applies, the mode, the “do not repeat” interval and the priority. Stop only the worst direction when the problem is with one mailbox provider: the rest of the server’s mail keeps going out. The “do not repeat” interval keeps a rule from firing again and again for the same reason.
EnlargeScreen 12 · Actions, scope and mode. An example from the MTA-Hub interface.
Stop sending — the whole server or only the worst direction — mail to one mailbox provider across all its domains.
Duration — required: after an hour the queues switch back on by themselves.
Where it applies — on all servers or on chosen ones.
Mode, “do not repeat”, priority — the settings at the bottom.
The rest of the server’s mail keeps going out.
13
Rule history
Triggers of one rule
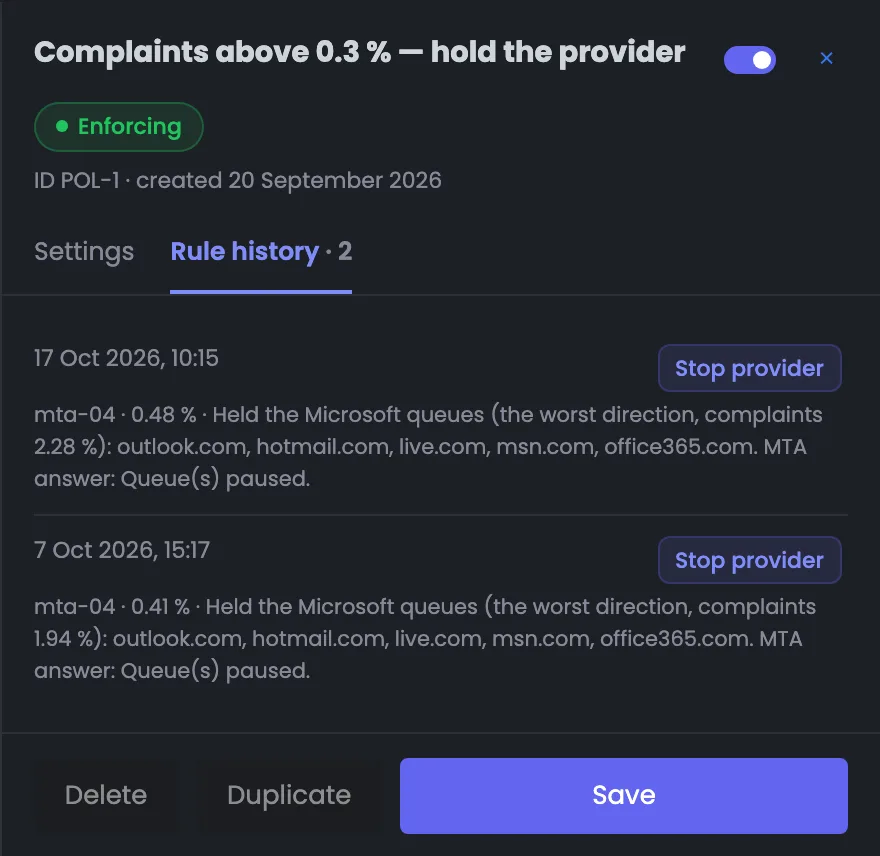
The “History” tab shows every trigger of one rule: when, on which server, what value and what was done. The result of each trigger is written as a sentence, together with the MTA’s answer — in the example the Microsoft queues were held at a complaint rate of 2.28%. The entry explains the decision right away: which direction was judged the worst and which of the provider’s domains it included. The history helps you decide whether it is time to change the rule’s threshold. Open the tab after a notification or a question like “why did the Microsoft mail stop”. If a rule fires often and always on the same server, take a look at the server itself in Monitoring.
EnlargeScreen 13 · Rule history. An example from the MTA-Hub interface.
Result as a sentence — “Held the Microsoft queues (the worst direction, complaints 2.28%): outlook.com, hotmail.com, live.com, msn.com, office365.com”.
MTA answer — Queue(s) paused.
You can see why this particular provider was chosen and which queues stopped.
06 / Questions about policies
Common questions about automatic sending rules.
In short: how a rule goes from observing to enforcing, and why automation won’t make a mess.
When, which rule, where, what it saw and at what threshold, what it did and how it ended.
How often are rules checked?
Every five minutes, day and night. No AI and no credits.
What does a rule do in observing mode?
It counts, notifies and writes to the log, but stops nothing.
How do I know if a rule is too strict?
With a check against history: the rule window shows how many times it would have fired over the last seven days, with a chart next to the threshold.
Will a rule stop the whole server?
Only if you set it up that way. You can stop just the mail to the worst mailbox provider — the rest keeps going out.
Can automation make a mess?
No more than ten actions an hour across all servers, hands off a server for half an hour after manual intervention, and no repeats before the set interval.
Can I undo a rule’s action?
Yes, while it is in effect — with the “undo” link in the trigger feed. A stop with a set duration lifts by itself.
Where do rules get complaints from?
From mailbox providers’ feedback loops (FBL), which PowerMTA receives. The FBL block shows whether they are set up and whether complaints arrive.
How are policies different from PowerMTA slowdowns?
PowerMTA slows down by itself after an unhappy answer from a mailbox provider. Policies decide on the scale of hours and periods and can stop sending entirely.
07 / Next step
Watch your servers in Monitoring.
Policies act on their own, while you watch the state of a single server — queues, mailbox provider answers and manual controls — in Monitoring.
Speed and per-provider rules that PowerMTA follows on its own are set in Configurations.