Proxy analytics. Delivery and the cost of every email.
The key question is not “how much does an address cost” but how much a delivered email costs: the rent for the period is divided by the emails that got through.
MTA accounting for every proxy — by seller, day, grade, subnet neighbors and pool. At the end — the addresses that hold delivery up and the ones that drag it down.
How much an email delivered through a proxy costs.
A free proxy sends for nothing but delivers worse, and every undelivered email is a recipient address from your list spent for nothing. That is why the rent for the period is divided by the emails that got through, with the number of burned emails shown next to it. This way proxy analytics compares expensive and cheap addresses by results, not by price lists.
Whole fleet over 7 days
01 · Rent$5.02 for 8 addresses
02 · Sent27,506 emails
03 · Delivered26,163 · 95.1%
04 · Cost$0.19 per 1,000
Rent is divided by delivered emails — expensive and cheap addresses are compared by results
Cost per email
$0.19 per thousand
A thousand delivered emails cost $0.19: the rent for 7 days is $5.02 for 8 addresses. This way expensive and cheap addresses are compared by real results, not by price lists.
$Rent
over delivered
Per 1,000 delivered$0.19
$5.02 for 7 days8 addresses
Burned list
1,343 emails
Every undelivered email is a recipient address from your list spent for nothing. This loss is not in the seller’s price list, and the list can’t be replenished, so it is shown next to the cost.
PProxy
not delivered
Emails burned1,343
undeliveredlist spent
02 / Proxy sellers
Comparing proxy sellers by delivery and cost.
For each seller you see the real quality of their proxies: how many addresses, emails and deliveries, how fast the mail server answers, how many addresses are on blacklists and what a delivered email costs.
Two sellers from the exampleData from the screenshots · 7 days
Delivery
3 addresses
15,278 emails, 97.8% delivered. The mail server answers in 440 ms on average, and no address is on a blacklist.
3ProxyLine
emails
Delivered97.8%
14,947 of 15,278440 ms to banner
Cost
$0.16 per thousand
The rent for 7 days is $2.45. A thousand delivered emails cost $0.16, and 331 emails burned.
$Rent
over delivered
Per 1,000 delivered$0.16
rent $2.45331 burned
Delivery
5 addresses
12,228 emails, 91.7% delivered. The mail server answers in 1.2 s, and two addresses are on blacklists.
5IPRoyal
emails
Delivered91.7%
11,216 of 12,2281.2 s to banner
Cost
$0.23 per thousand
The rent of $2.57 is almost the same as ProxyLine’s, but a delivered email costs more: $0.23 per thousand, and 1,012 emails burned.
$Rent
over delivered
Per 1,000 delivered$0.23
rent $2.571,012 burned
A free address sends an email for nothing but loses more of your list, and the list can’t be replenished. What you should count is the cost of a delivered email plus the list you lose.
03 / What affects delivery
How grade and subnet affect deliverability.
An address’s grade and its neighbors in the same /24 subnet hint at which addresses to take next time. The share for each grade is counted over the emails in the period.
2 addresses
Grade A
98.2% delivered of 10,297 emails.
4 addresses
Grade B
97.0% delivered of 10,238 emails.
1 address
Grade C
78.9% delivered of 2,469 emails.
1 address · not fit for mail
Grade D
92.7% of 4,502 emails — sent while it was still grade C.
/24 neighbors
Shared reputation
With two addresses in one /24 subnet delivery is 91.1%, with three or four — 96.7%. Subnet neighbors matter more than grade: mailbox providers treat such addresses as one sender.
24Subnet
group
Three or four in a /2496.7%
6 addresses19,780 emails
The grade is the current one
Emails over the period
The grade shown is today’s, while the emails cover the whole period. px-06 sent them as grade C and became D when its port 25 closed — that is why grade D has such a high share.
Ppx-06
grade
Was C, now D92.7%
4,502 emailsport 25 closed
04 / Verdict
The best proxies and candidates for replacement.
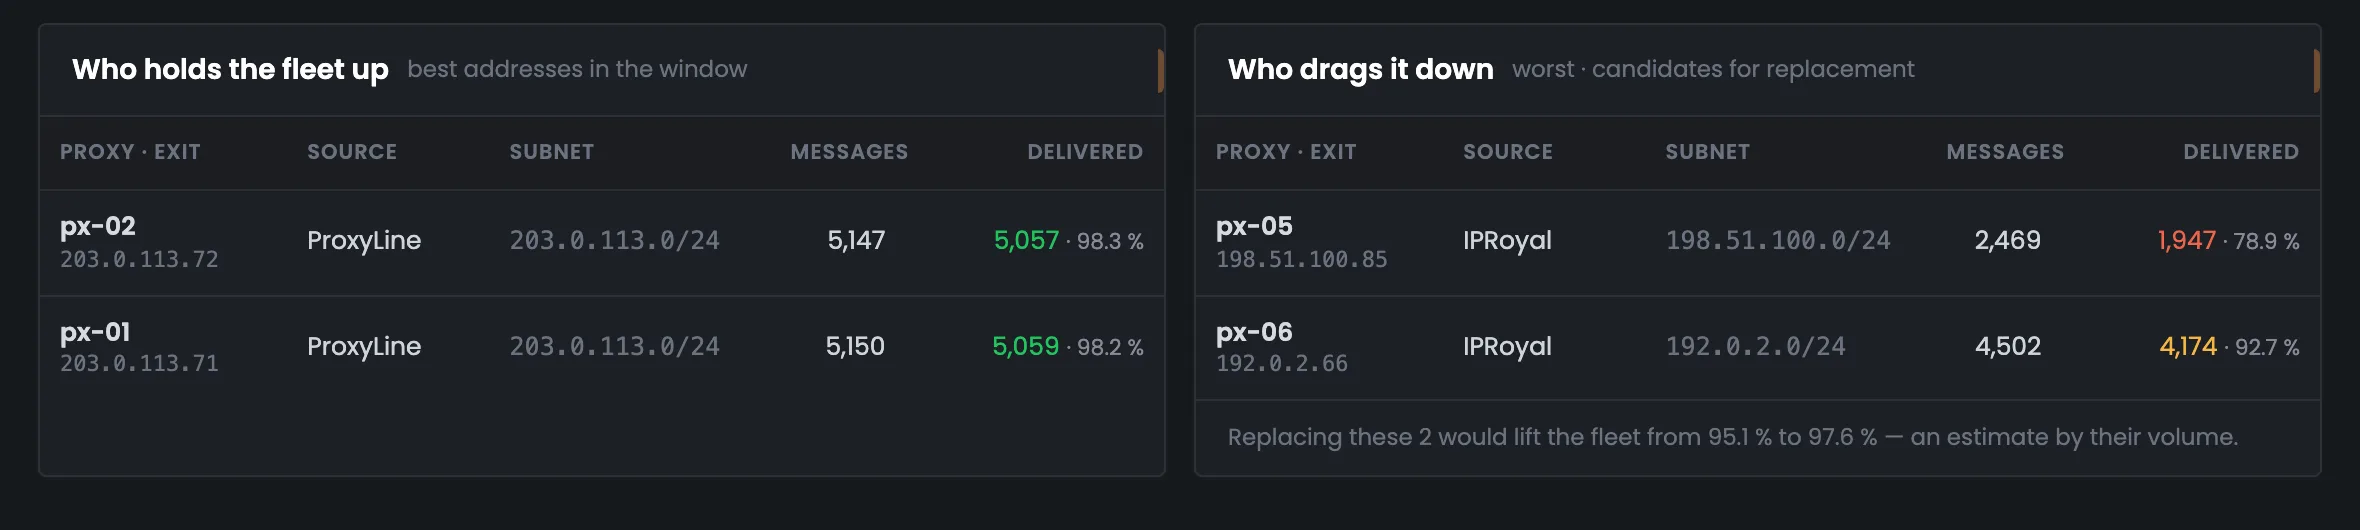
At the end the page names the addresses that hold delivery up and the candidates for replacement — and estimates how far the whole fleet’s delivery would rise if the worst ones were replaced.
Holding delivery up
ProxyLine
px-02 — 98.3% of 5,147 emails, and px-01 — 98.2% of 5,150. Both from ProxyLine, in subnet 203.0.113.0/24.
Ppx-02
delivery
Holding the fleet up98.3% · 98.2%
px-02, px-01ProxyLine
Dragging it down
Candidates for replacement
px-05 — 78.9% of 2,469 emails, refused by Yahoo, and px-06 — 92.7% of 4,502. Replacing these two would lift the fleet’s delivery from 95.1% to 97.6%.
HMTA-Hub
estimate
If both are replaced95.1 → 97.6%
px-05, px-06by their email volume
Only addresses with noticeable volume make the lists: at least 20 emails and at least one percent of all emails in the period.
05 / The interface in detail
The “Analytics” section — 6 screens.
All proxy analytics screens: four numbers, sellers, the daily chart, the impact of grade and subnet, pools and the per-address verdict. Above each screenshot: why the screen matters. Below it: what it shows.
Cost and sellers
2 screens
The page opens with the essentials: how much the fleet delivered and what a delivered email cost. At the top — the scope (the whole fleet or a pool) and the period: 24 hours, 7 or 30 days. Below — proxy sellers side by side, with the cost and the lost list for each. These two screens tell you whom to buy addresses from next.
01
Four numbers
Delivery, cost, best seller, burned list
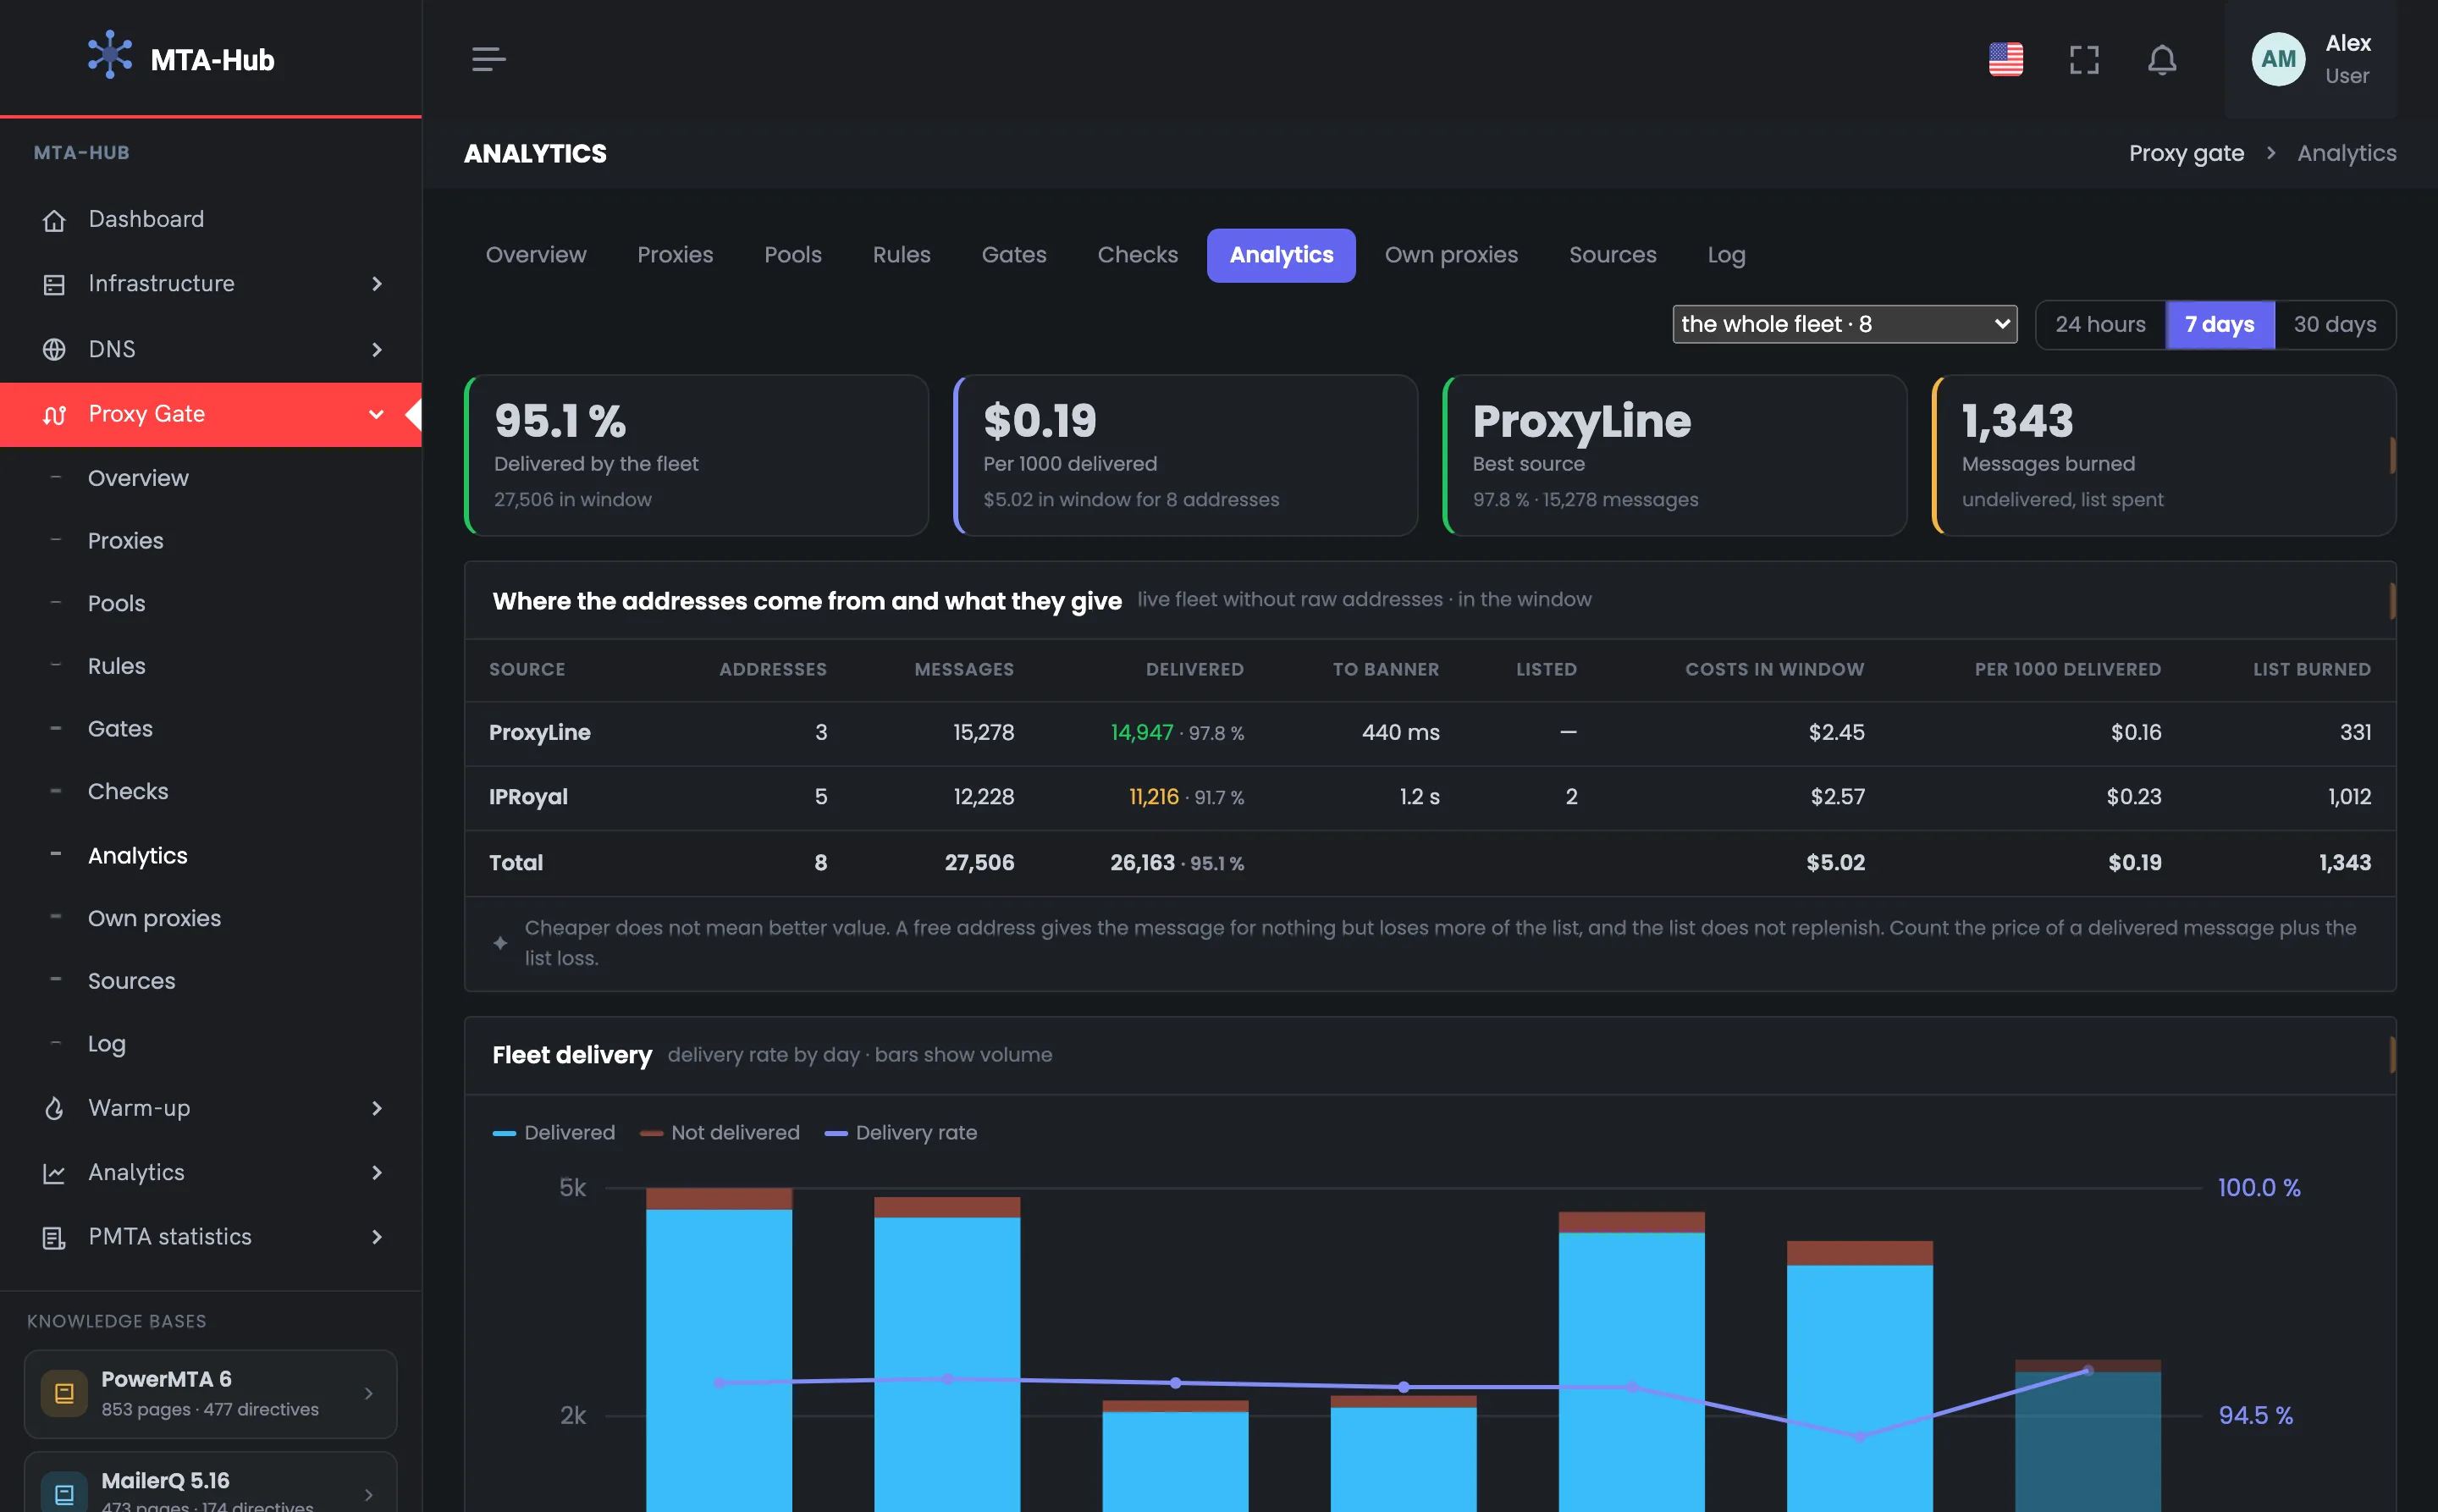
Four tiles give a short summary of proxy analytics for the chosen period. Over 7 days the fleet delivered 95.1% of 27,506 emails, a thousand delivered cost $0.19, the best source is ProxyLine, and 1,343 emails burned. These are the key answers: do the proxies deliver well, what does the result cost, and how many list addresses were wasted. At the top — the scope (“whole fleet · 8” or a pool) and the period; changing them recalculates the whole screen. If the fleet’s delivery is dropping or the cost per email is rising, look next at the seller table and the per-address verdict at the bottom of the page, where the candidates for replacement are named.
EnlargeScreen 01 · Four numbers. An example from the MTA-Hub interface.
Delivered by the fleet — 95.1% of 27,506 emails over the period.
Per 1,000 delivered — $0.19 — rent of $5.02 for the period for 8 addresses.
Best source — ProxyLine: 97.8% of 15,278 emails.
Emails burned — 1,343 — undelivered, list addresses spent.
Scope and period — “whole fleet · 8” or a pool; 24 hours, 7 or 30 days.
Scope and period recalculate the whole screen at once.
02
Where the addresses come from and what they deliver
Proxy sellers side by side
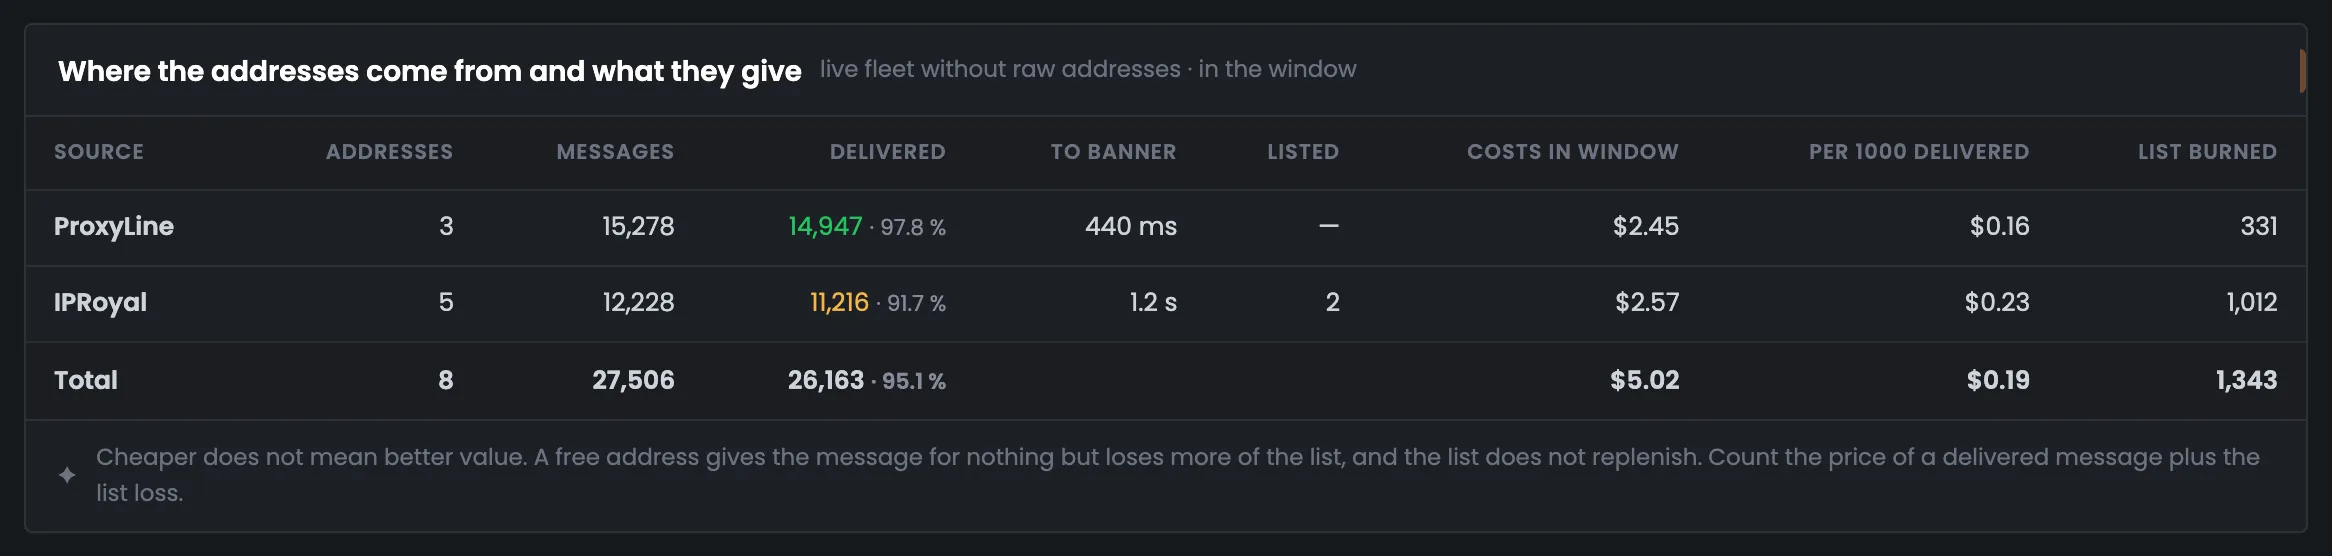
The proxy seller table is the screen for deciding whom to take addresses from next. For each seller — addresses, emails, delivery, time to the mail server’s greeting, blacklists, rent and the cost of a thousand delivered, and the last column is the burned list. In the example ProxyLine and IPRoyal have almost the same rent, but ProxyLine delivers 97.8% against 91.7%, and a thousand delivered costs less — $0.16 against $0.23. At the bottom — why cheaper doesn’t mean better value. A free address sends an email for nothing but loses more of your list, so what you should count is the cost of a delivered email plus the list you lose.
EnlargeScreen 02 · Where the addresses come from and what they deliver. An example from the MTA-Hub interface.
ProxyLine — 3 addresses, 15,278 emails, 97.8%, 440 ms, none on blacklists, $2.45, $0.16 per thousand, 331 burned.
IPRoyal — 5 addresses, 12,228 emails, 91.7%, 1.2 s, 2 on blacklists, $2.57, $0.23 per thousand, 1,012 burned.
Total — 8 addresses, 27,506 emails, 95.1%, $5.02, $0.19 per thousand, 1,343 burned.
A free address sends an email for nothing but loses more of your list. What you should count is the cost of a delivered email plus the list you lose.
Trend and what affects it
2 screens
Next — how delivery changed by day and what affects it. The chart shows both the share and the volume, so a day of four emails doesn’t look like a success. The impact blocks break delivery down by address grade and subnet neighbors.
03
Fleet deliverability
Share and volume by day
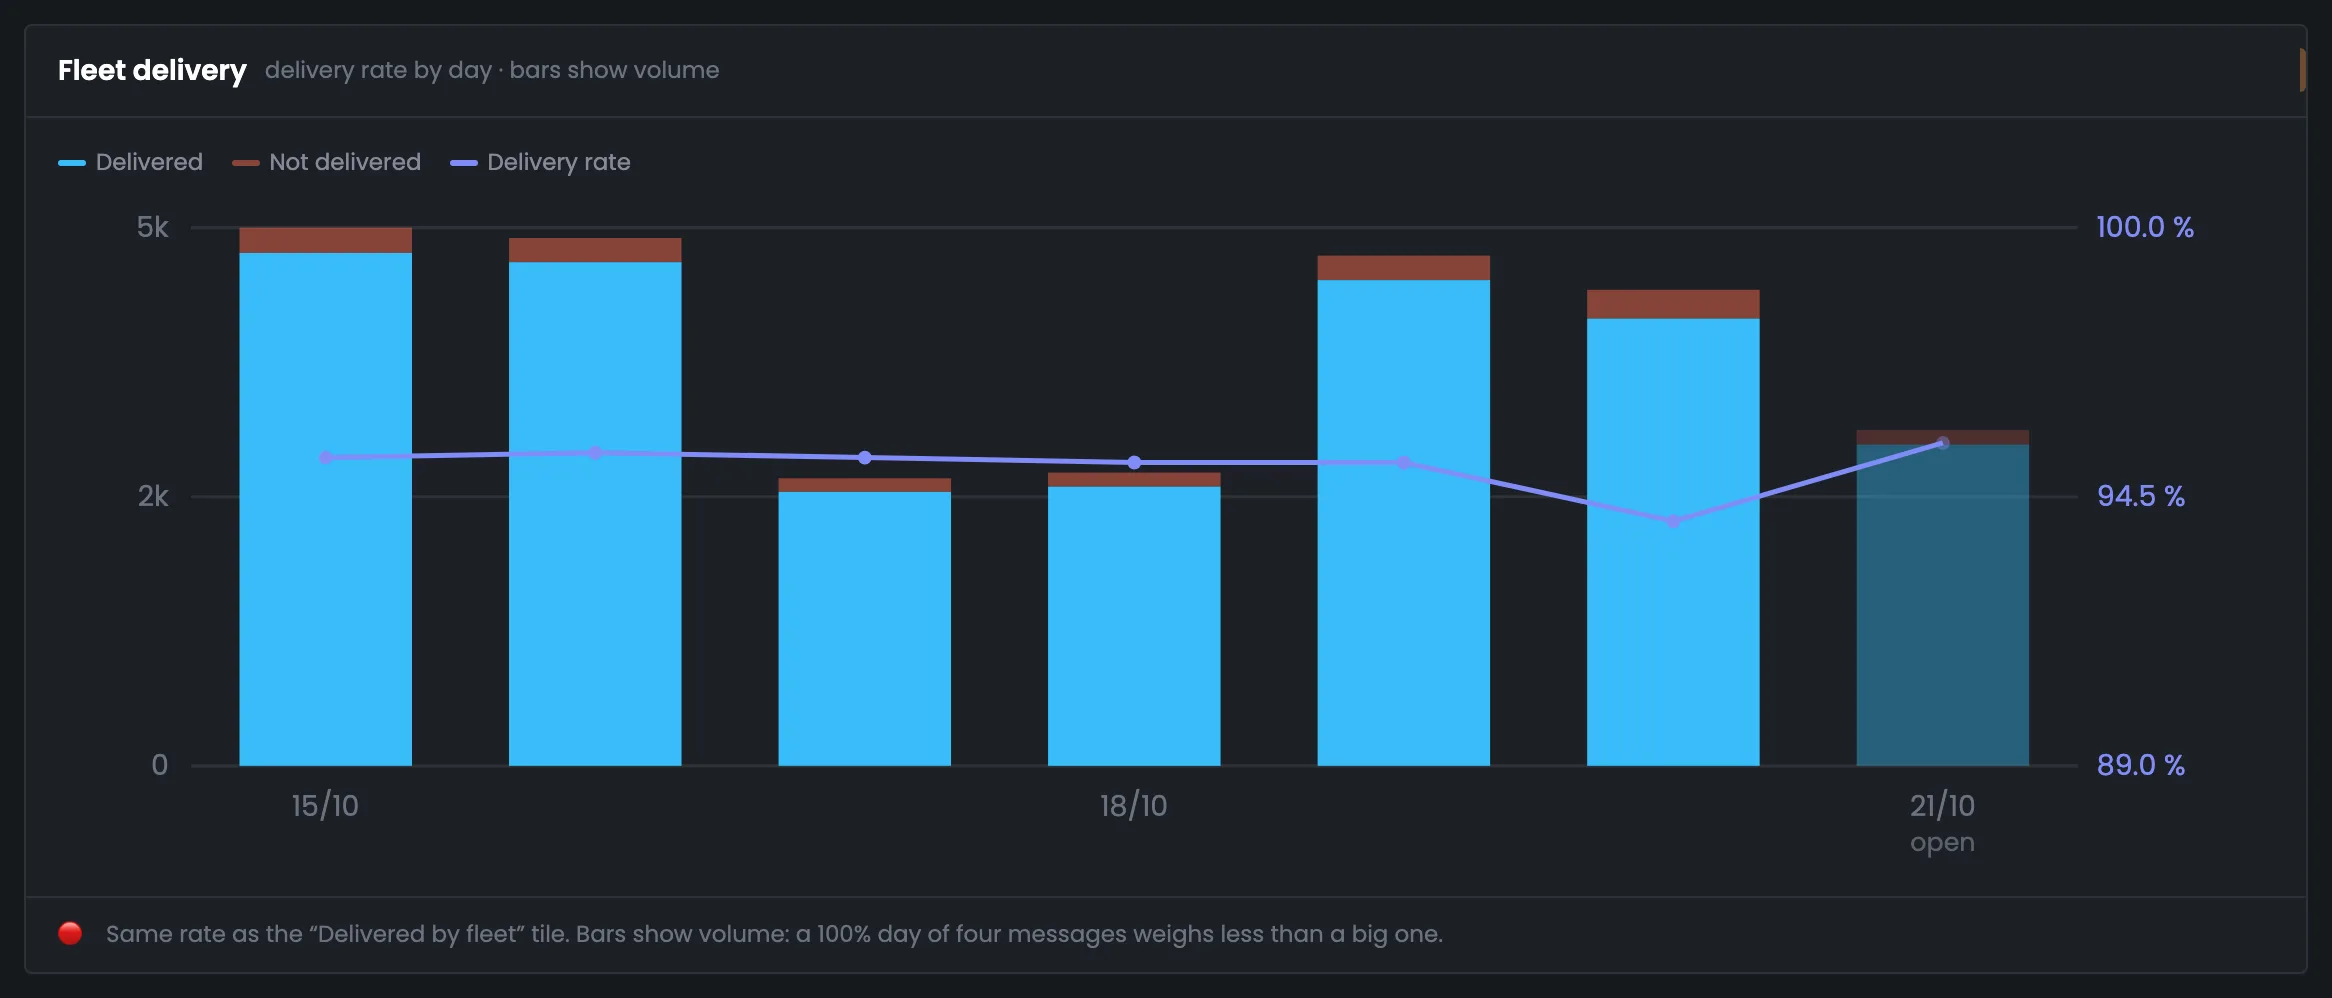
A chart of deliverability through proxies over seven days, by the panel’s clock. Bars are delivered and undelivered emails, the line is the delivered share: this way you see both quality and volume, and a day of a few emails doesn’t look like a success. The share axis runs from just below the worst day up to 100%, so the difference between days is visible. Today is paler and labeled “open”: the bar is lower than its neighbors because the day isn’t over yet, not because of a drop. The line is the same share as in the “Delivered by the fleet” tile. If it dips on some day, look for the reason in the impact blocks and in the per-address verdict below.
EnlargeScreen 03 · Fleet deliverability. An example from the MTA-Hub interface.
Delivered and not delivered — the blue and red parts of the bar — the day’s email volume.
Delivered share — the line on the right axis — the same share as in the “Delivered by the fleet” tile.
“open” — today’s bar is lower than its neighbors because the day isn’t over yet, not because of a drop.
Bars show volume: a 100% day of four emails weighs less than a big one.
04
What affects it
Grade and /24 neighbors
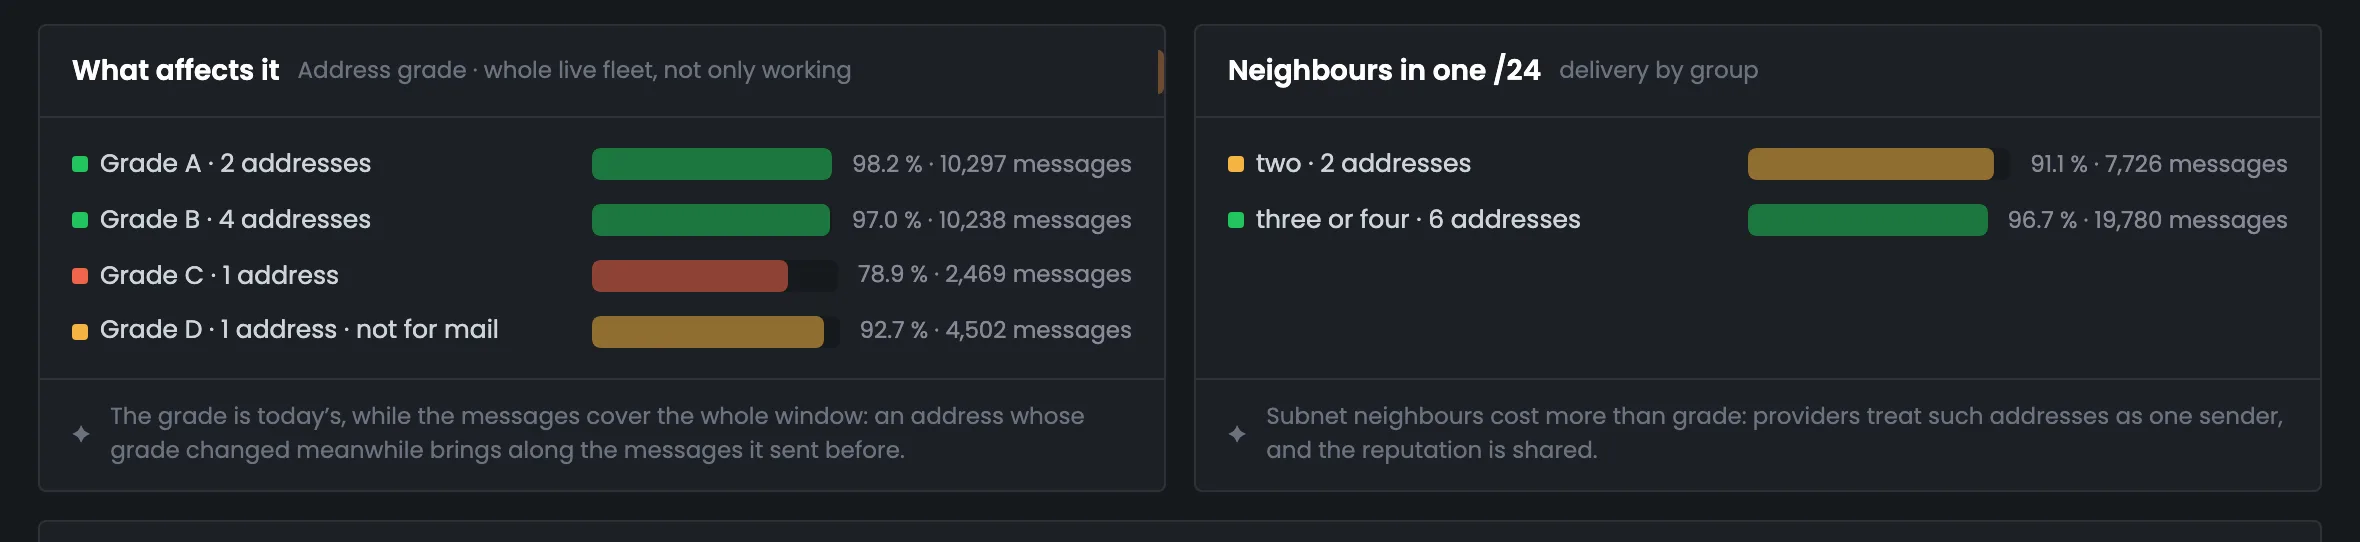
Two blocks about what proxy quality depends on. On the left — delivery by address grade: from 98.2% for grade A down to 78.9% for grade C. On the right — by the number of neighbors in one /24 subnet: two neighbors give 91.1%, three or four — 96.7%. The blocks hint at which addresses to take next time. Under each one is a note on how to read the numbers: the grade shown is the current one, while the emails cover the whole period, so px-06, which sent its emails while still grade C, gives grade D a high share. Subnet neighbors matter more than grade: mailbox providers treat addresses from one /24 as one sender, and they share a reputation.
EnlargeScreen 04 · What affects it. An example from the MTA-Hub interface.
Grade A — 2 addresses — 98.2% of 10,297 emails.
Grade B — 4 addresses — 97.0% of 10,238.
Grade C — 1 address — 78.9% of 2,469.
Grade D — 1 address, not fit for mail — 92.7% of 4,502.
Neighbors in one /24 — two — 91.1% of 7,726 emails, three or four — 96.7% of 19,780.
The grade is the current one, while the emails cover the whole period: px-06 sent them as grade C and became D when port 25 closed.
Pools and verdict
2 screens
At the end — a comparison of pools and a verdict by name. You see which addresses hold up the fleet’s delivery and which drag it down. The page itself estimates how far deliverability through proxies would rise if the worst ones were replaced.
05
Pools side by side
Delivery by pool
Pools side by side — the deliverability of each proxy pool over the period. The bar shows the delivered share, and on the right is the number of emails: “Sending · marketing” delivered 97.8% of 15,278 emails, “Ramping up new addresses” — 91.7% of 12,228. The screen helps you see which pool performs worse and needs attention. At the bottom is a reminder of how to compare pools fairly: only when they do the same job — for a list-cleaning pool a low share is not the proxies’ fault. Here “Ramping up new addresses” lags behind, and that is exactly where px-05 and px-06 work — the candidates for replacement from the next screen.
EnlargeScreen 05 · Pools side by side. An example from the MTA-Hub interface.
Ramping up new addresses — 5 addresses — 91.7% of 12,228.
Pools are comparable only when they do the same job: a list-cleaning pool hits unknown addresses, and a low share there is not the proxies’ fault.
06
Who holds the fleet up and who drags it down
The best and candidates for replacement
The proxy analytics verdict by name. On the left — the best addresses for the period: px-01 and px-02 from ProxyLine. On the right — the worst, candidates for replacement: px-05, which Yahoo refuses, and px-06. Under the right table is an estimate of how far the fleet’s delivery would rise without them: from 95.1% to 97.6%. Only addresses with noticeable volume make the lists — at least 20 emails — so a random address with three emails won’t get in. This screen is a good place to start replacing addresses: you see which ones to replace and what that would gain you. Both candidates for replacement are from IPRoyal, and both best addresses are from ProxyLine.
EnlargeScreen 06 · Who holds the fleet up and who drags it down. An example from the MTA-Hub interface.
Holding the fleet up — px-02 — 98.3% of 5,147 emails, px-01 — 98.2% of 5,150; both ProxyLine, 203.0.113.0/24.
Dragging it down — px-05 — 78.9% of 2,469 (Yahoo refuses it), px-06 — 92.7% of 4,502; both IPRoyal.
Estimate — replacing these two would lift the fleet from 95.1% to 97.6% — by their email volume.
Only addresses with noticeable volume make the lists: at least 20 emails and at least one percent of all emails in the period.
06 / Questions about analytics
Common questions about proxy analytics.
In short: how the cost per email is calculated, where the numbers come from and how to compare them properly.
Bars are email volume, the line is the delivered share. Today is paler: the day isn’t over yet.
Why count the cost of a delivered email rather than of an address?
A cheap address may deliver worse, and then every email that gets through costs more. The rent for the period is divided by the emails that got through — this way addresses are compared by results.
What does “burned” mean?
Emails that were not delivered. Each one is a recipient address from your list spent for nothing, and the list can’t be replenished. This loss is not in the seller’s price list.
Where does an address’s price come from?
It is the rent recorded for the address: you enter it in the card of a purchased proxy or when importing a list. An empty price counts as unknown, not as zero.
Why is today’s bar lower than the others?
The day isn’t over yet. The bar is paler and labeled “open” so that it isn’t mistaken for a drop.
Why does grade D have such a high share?
The grade shown is the current one, while the emails cover the whole period. The address sent them while still grade C and got D when its port 25 closed.
Why do subnet neighbors matter so much?
Mailbox providers treat addresses from one /24 subnet as one sender, and they share a reputation. That is why subnet neighbors matter more than grade.
Can pools be compared with each other?
Only pools with the same job. A list-cleaning pool has more bounces by definition, and a low share there is not the addresses’ fault.
Who makes it into “holding up” and “dragging down”?
Only addresses with noticeable volume: at least 20 emails and at least one percent of all emails in the period. Otherwise an address with three emails could land among the best by chance.
07 / Next step
Add your own proxy servers.
Analytics compares purchased and free addresses by the cost of a delivered email. Your own VDS are a third source: the address belongs to you, and its reputation depends only on you.
Where free addresses come from is shown in Sources, and the whole route — from the MTA through the gate to the recipient — in the module overview.