01 / EntryGate connection
198.51.100.201:1080Where the gate connects
The proxy’s entry address and port. The Hub uses them to find the proxy in the list.
In the address lineLeft of the arrow

Checking proxies and IPs for email sending
All your proxies in one list: bought, free and your own VDS. Find the address you need, see what state it’s in and choose what to do next.
Entry and exit IP, checks, DNS and MTA data — in one row. From the overall summary to a specific problem — one selection away.
01 / A proxy’s entry and exit IP
The address you connect to a proxy on and the IP the mail server sees can be different. The Hub shows both in one row of the list — and finds a proxy by either of them. It’s the exit IP that lands on blacklists and goes into SPF, so you see it right away.
198.51.100.201:1080The proxy’s entry address and port. The Hub uses them to find the proxy in the list.
203.0.113.71The exit address is checked against blacklists and must be included in SPF.
Grade, TCP/25, blacklists and reverse DNS. The Hub checks through public DNS servers whether the subdomain’s DNS record is visible.
Messages and the delivered share over 24 hours, 7 or 30 days — by the proxy’s exit IP.
The address’s state, its pool, sending node and seller — next to the checks and messages.
02 / Selecting proxies by a metric
Click a metric above the table, and only the matching addresses stay in the proxy list. Above the rows it says which condition is selected and which part of the fleet it looks at, and the number shows how many addresses the next check will take.
With no conditions the table shows the whole list — including reserve, quarantine and dropped
The condition and the scope are always written above the rows — you can see why exactly these addresses are in the table.
The number on the button changes with the selection: the check and the CSV export take exactly the addresses found — including those on other pages of the table.
You clicked the metric — only its addresses stay in the table, and the check will take exactly those
The condition and the scope are always written above the rows — you can see why exactly these addresses are in the table.
The number on the button changes with the selection: the check and the CSV export take exactly the addresses found — including those on other pages of the table.
No matches — the Hub names the condition that’s in the way and what you’d find without it
The condition and the scope are always written above the rows — you can see why exactly these addresses are in the table.
Instead of an empty table — the reason and the next step: which condition to remove and how many addresses you’d then find. In the Hub this is the “Show them” button.
03 / State and fitness
Every address has exactly one state. Together the six states cover the whole list and show what’s happening to a proxy right now: waiting for a check, held in reserve, sending mail, or pulled from sending.
Added from a source or by import. There’s no check result yet.
Waiting for the checks’ verdictPassed the check but isn’t in any sending pool yet.
Needs a poolBelongs to a pool and waits to replace an address that fails.
Not sending yetPut into sending: the subdomain is issued, DNS is visible, the node knows the address.
Takes part in sendingPulled temporarily: a rule fired, TCP/25 closed, or the rent expired.
Find out whyFailed the check or was retired. Bought and own addresses stay in the list.
Free ones are deletedPort 25 is open and the grade is A to C. This is a property of the address itself, not a state: fit proxies can be both sending and in reserve, so their count doesn’t match any of the six states.
How to read the numbers04 / Bulk actions
Tick rows and apply one action to all the selected proxies at once: check, put into sending, add to a pool, move to reserve or retire. The panel shows the available operations and reminds you where exactly the change happens: in the Hub’s list or on the node.
 Enlarge
Check the addresses, put them into sending, add them to a pool, move them to reserve or retire them.
The Hub asks for confirmation and tells you how many addresses are sending and how many are paid for.
After changes in the Hub, pass the new addresses to the gate and update the DNS records as a separate step.
Changing a row in the Hub and passing the settings to the gate are two different steps.
05 / The interface in detail
Summary, filters, states, table, cards and bulk actions of the proxy list. Above each screenshot: why the screen matters. Below it: what it shows.
First, get clear on what exactly you’re looking at. The tabs at the top choose the node and the period, eight metrics give the overall picture of the fleet, and search and filters narrow the list down to the addresses you need. The help on states explains why the numbers on different counters don’t have to match.
The proxy list page starts with the module’s tabs and a choice of node and period. By default the list shows the whole fleet, but you can narrow it to one sending server — then only its addresses stay in the table. The period — 24 hours, 7 or 30 days — only affects messages and the delivered share. The strip below tells you which columns come from the Hub’s checks and which from MTA reports; on the right — a CSV export of the selected addresses and a link to import. Grade, blacklists and DNS are the address’s current state, so they don’t change when you switch the period, while messages and the delivered share are recalculated.
 Enlarge
Grade, blacklists and DNS are the address’s current state: they don’t change when you switch the period.
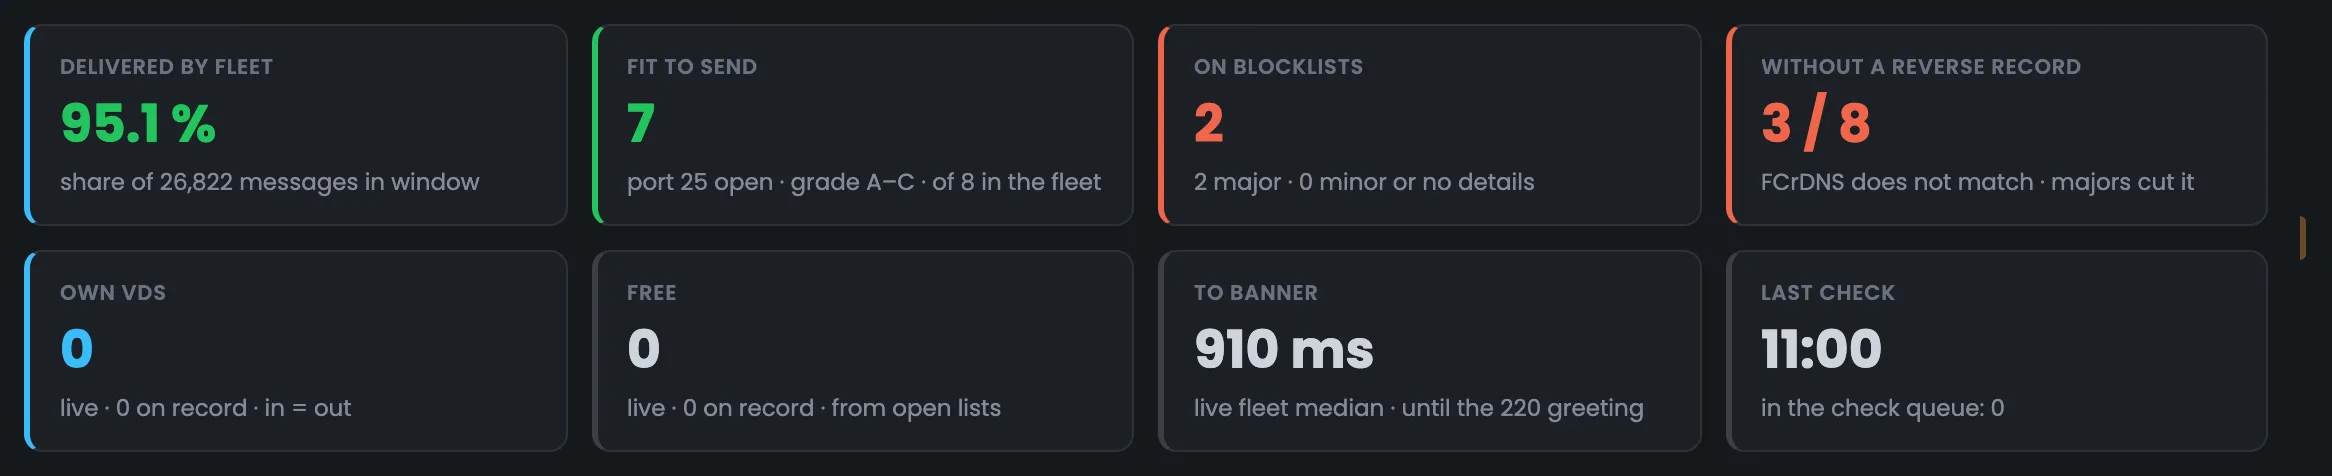
Eight metrics give the overall picture of your proxy fleet: delivery, fit for mail, blacklists, reverse DNS, own VDS, free addresses, time to banner and the last check. The color of the stripe on the left tells you whether all is well: green is normal, red means there’s something to look into. Under each number, small print says how it’s counted. Many metrics work as buttons and immediately select the matching addresses in the table, while “Delivered by fleet” and “Last check” lead to “Analytics” and “Checks”. In the example, 26,822 messages went out over the week with a 95.1% delivered share, seven addresses of eight are fit for mail, and reverse DNS doesn’t match on three.
 Enlarge
The numbers in the screenshot come from a sample fleet. “3 / 8” for reverse DNS means that for three of eight checked addresses the records don’t match.
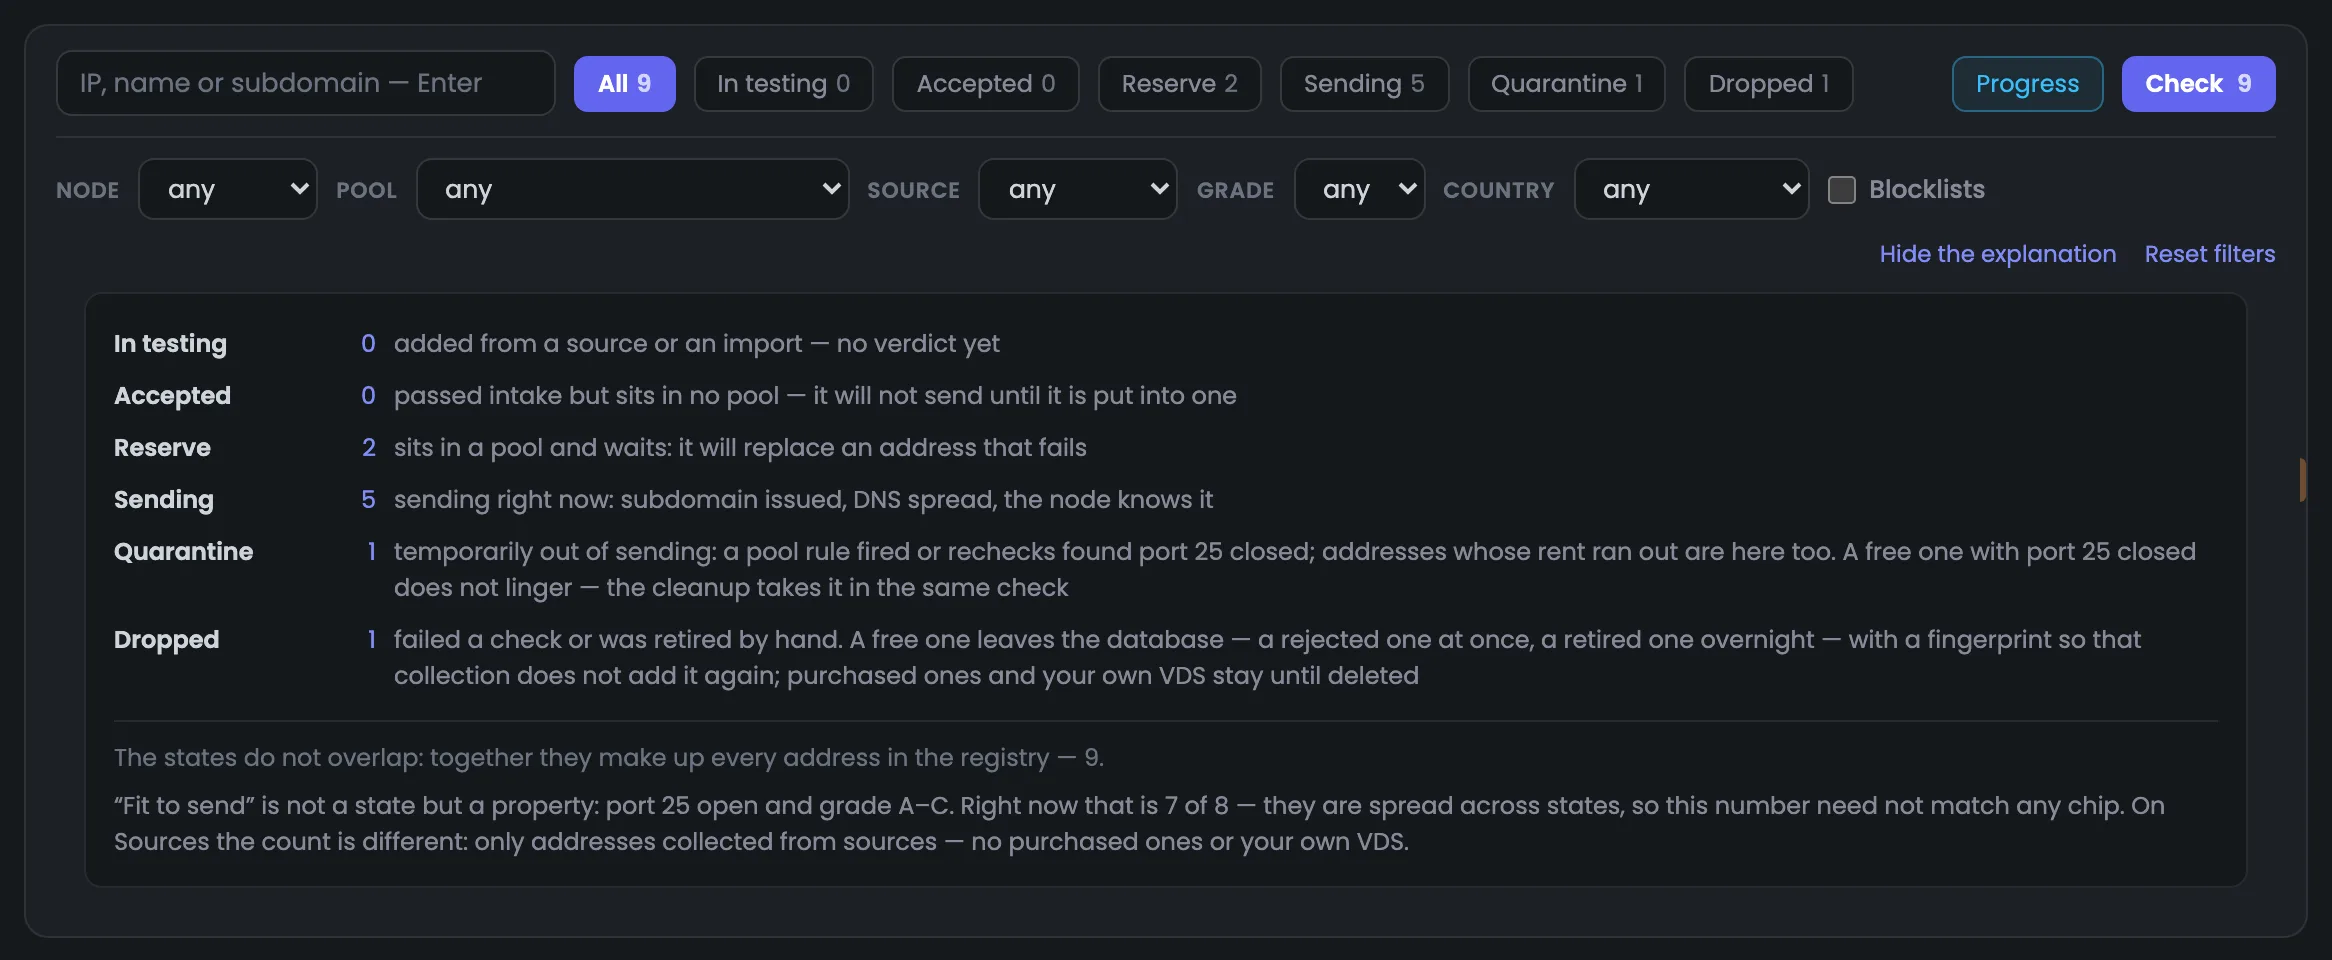
Under the metrics are the search bar and the proxy list filters. You can search by entry or exit address, proxy name or subdomain; the search runs when you press Enter. The state buttons show right away how many addresses are in each, and the filters below refine the selection by server, pool, source, grade, country and blacklists. The check button on the right takes all the addresses found, not just the visible page — so a proxy check runs on exactly the group you need. In the example the chips show reserve 2, sending 5, quarantine 1 and dropped 1 — all nine addresses together, and “Progress” next to the button shows how checks already started are going.
 Enlarge
The number on the “Check” button changes with the selection conditions.
The help opens right under the filters and explains each proxy state together with the number of addresses in it. An address always has one state, so all the states add up to the number of addresses in the list. It also says how an address gets into quarantine and what happens to dropped ones: free ones are deleted, while bought ones and your own VDS stay. It explains separately why “Fit for mail” isn’t a state. When you no longer need the help, you can collapse it. For example, a free address with a closed port doesn’t linger in quarantine — the check removes it right away, and the Hub remembers its fingerprint so that collection doesn’t add the address again.
 Enlarge
A free address is deleted together with its fingerprint so that collection from public lists doesn’t add it again.
Next — the addresses themselves. The table puts everything about an address in one row: where it came from, where it works, how it did in checks and how many messages it sent. You can handle ticked rows with one action, and for a quick look you can switch the table to cards.
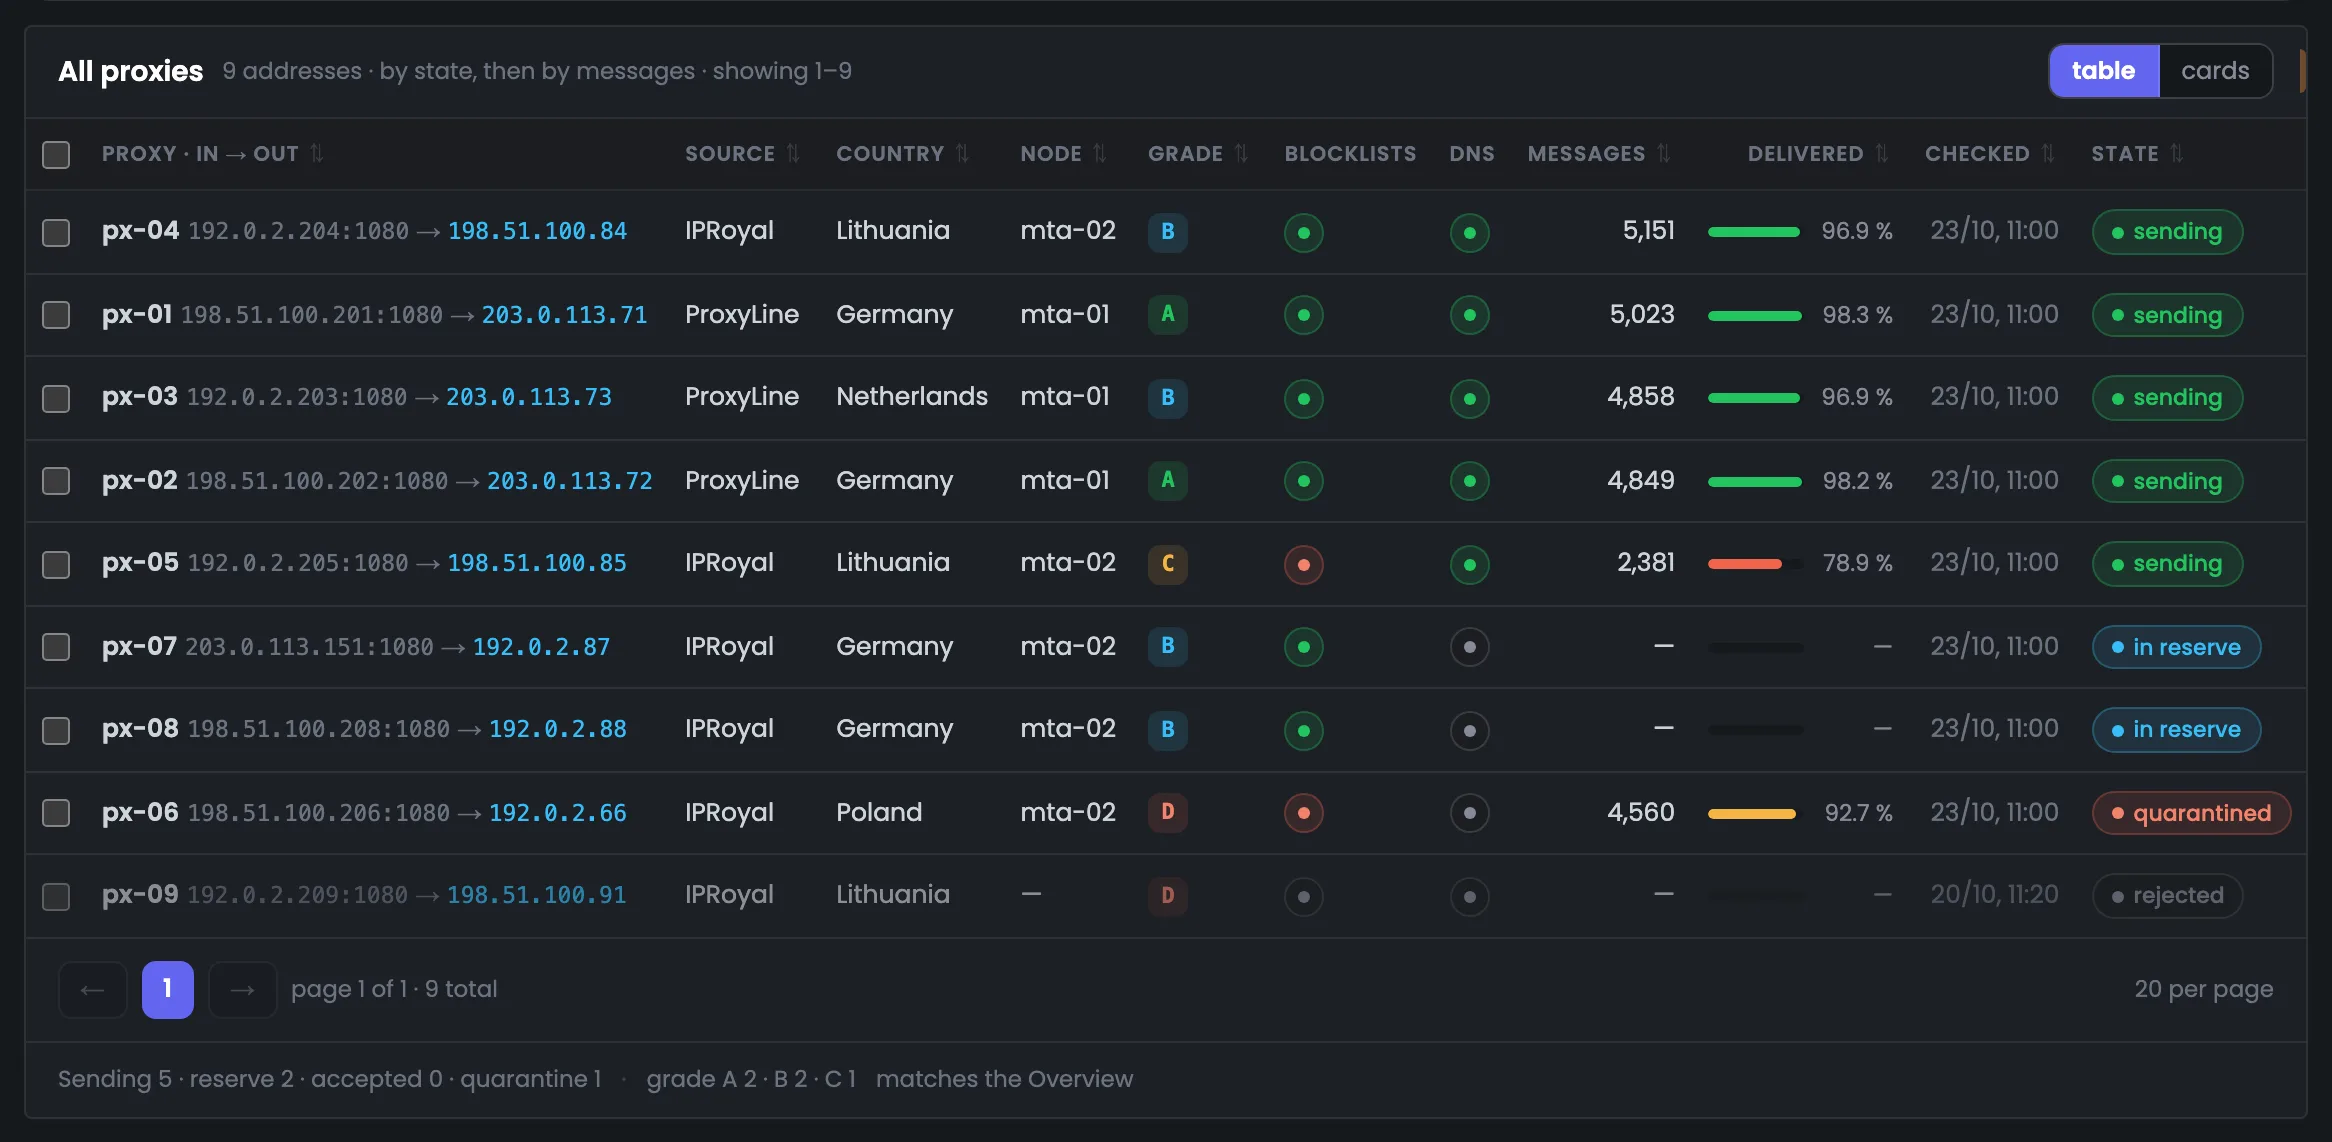
The main part of the page is the proxy table. One row shows everything about an address: entry and exit, seller, country, sending server, grade, blacklists, subdomain records, messages over the period, delivered share and state. At the top are the sending addresses by number of messages, below them reserve, quarantine and dropped, and an address with poor delivery is marked by a red bar. You can sort by any column, and the summary under the table matches the “Overview”. In the example px-04 sent 5,151 messages with a 96.9% share, px-05, which is on blacklists, delivers 78.9%, and px-06, in quarantine with grade D, managed to send 4,560 messages before it was pulled.
 Enlarge
The state is now, messages are for the period. An address in quarantine can show messages if it sent them before it was pulled.
Tick rows and an action panel appears above the table: check, put into sending, move to a pool, to reserve, retire or delete. It says how many addresses are selected and applies one action to all of them at once — no need to open each proxy separately. Before deleting, the Hub asks for confirmation and tells you how many of the ticked ones are sending mail right now and how many are paid for. At the bottom the panel reminds you that the gate and DNS are updated as a separate step. This is handy when you need to put several checked addresses into sending at once, or take a whole group found by a filter out of service.
EnlargeThe panel only changes the list in the Hub. The gate table and DNS records are updated as a separate step.
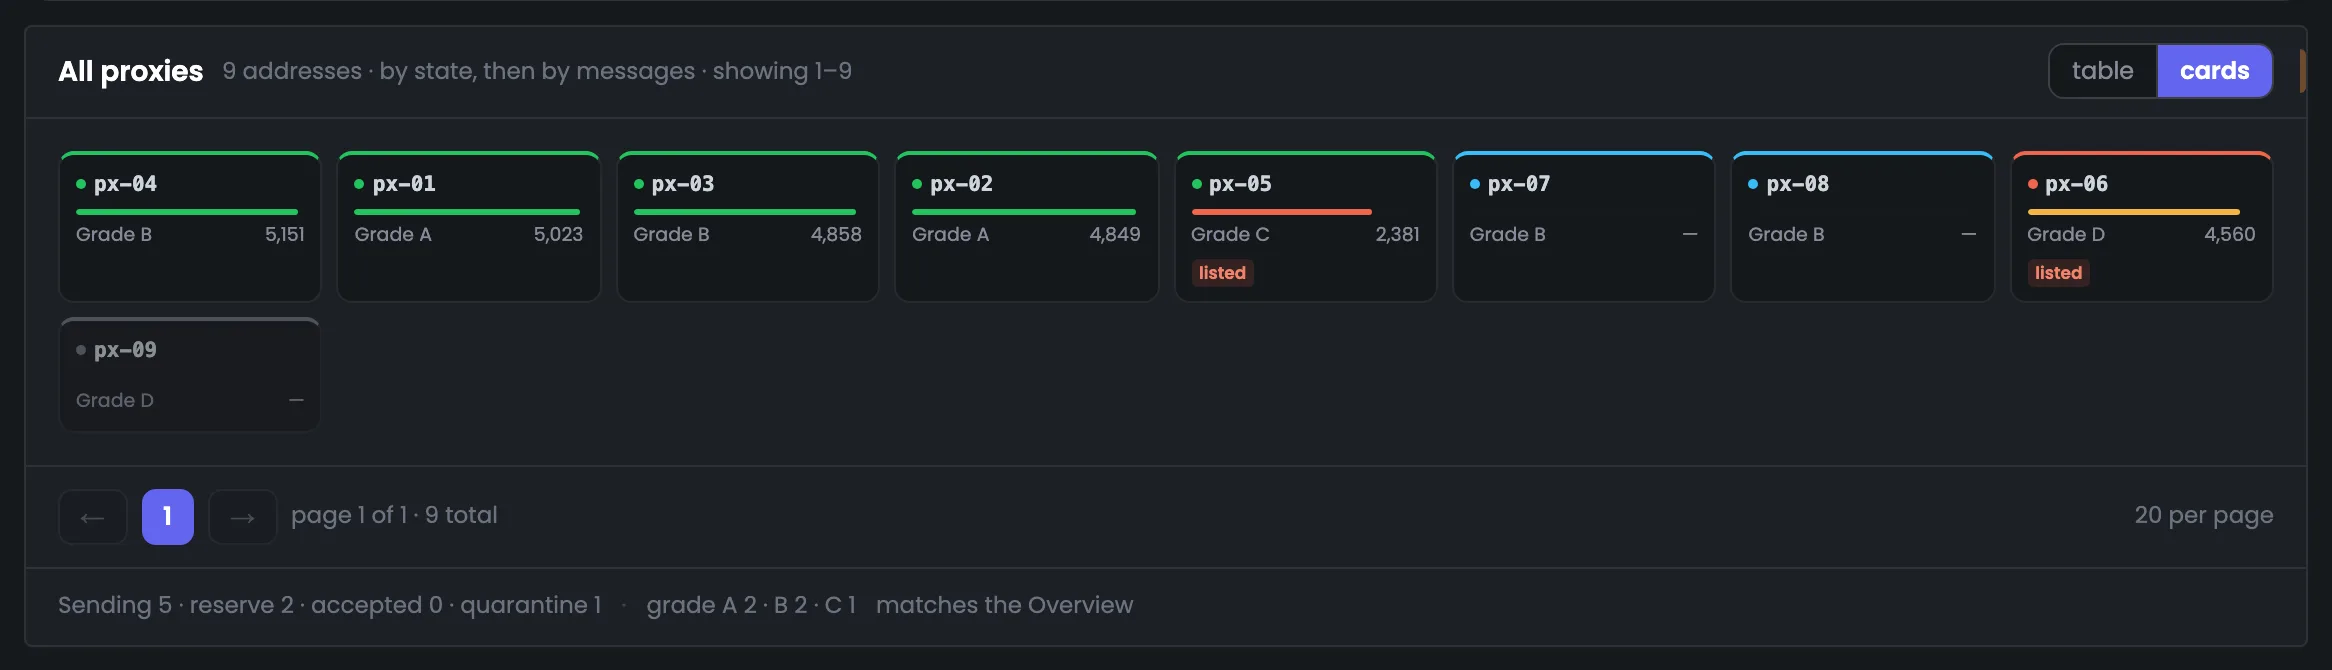
You can switch the table to cards — the same proxy list, just more compact. Each card is one address with the essentials: the color of the top edge shows the state, the bar shows the delivered share, on the right are the messages for the period, and a red tag marks blacklists. This makes it easy to scan the whole fleet and spot a problem address right away. Clicking a card opens the address’s page, and the selection and order of addresses stay the same when you switch. Cards are better for a quick look, the table for comparing columns across addresses and sorting them by any metric.
 Enlarge
The table is better for comparing columns, cards for a quick look over the addresses.
The last part is how selection works. Any metric above the table turns into a filter, and the selected condition is always written above the rows. If no address matches the conditions, the Hub tells you which condition is in the way and what you’d get without it.
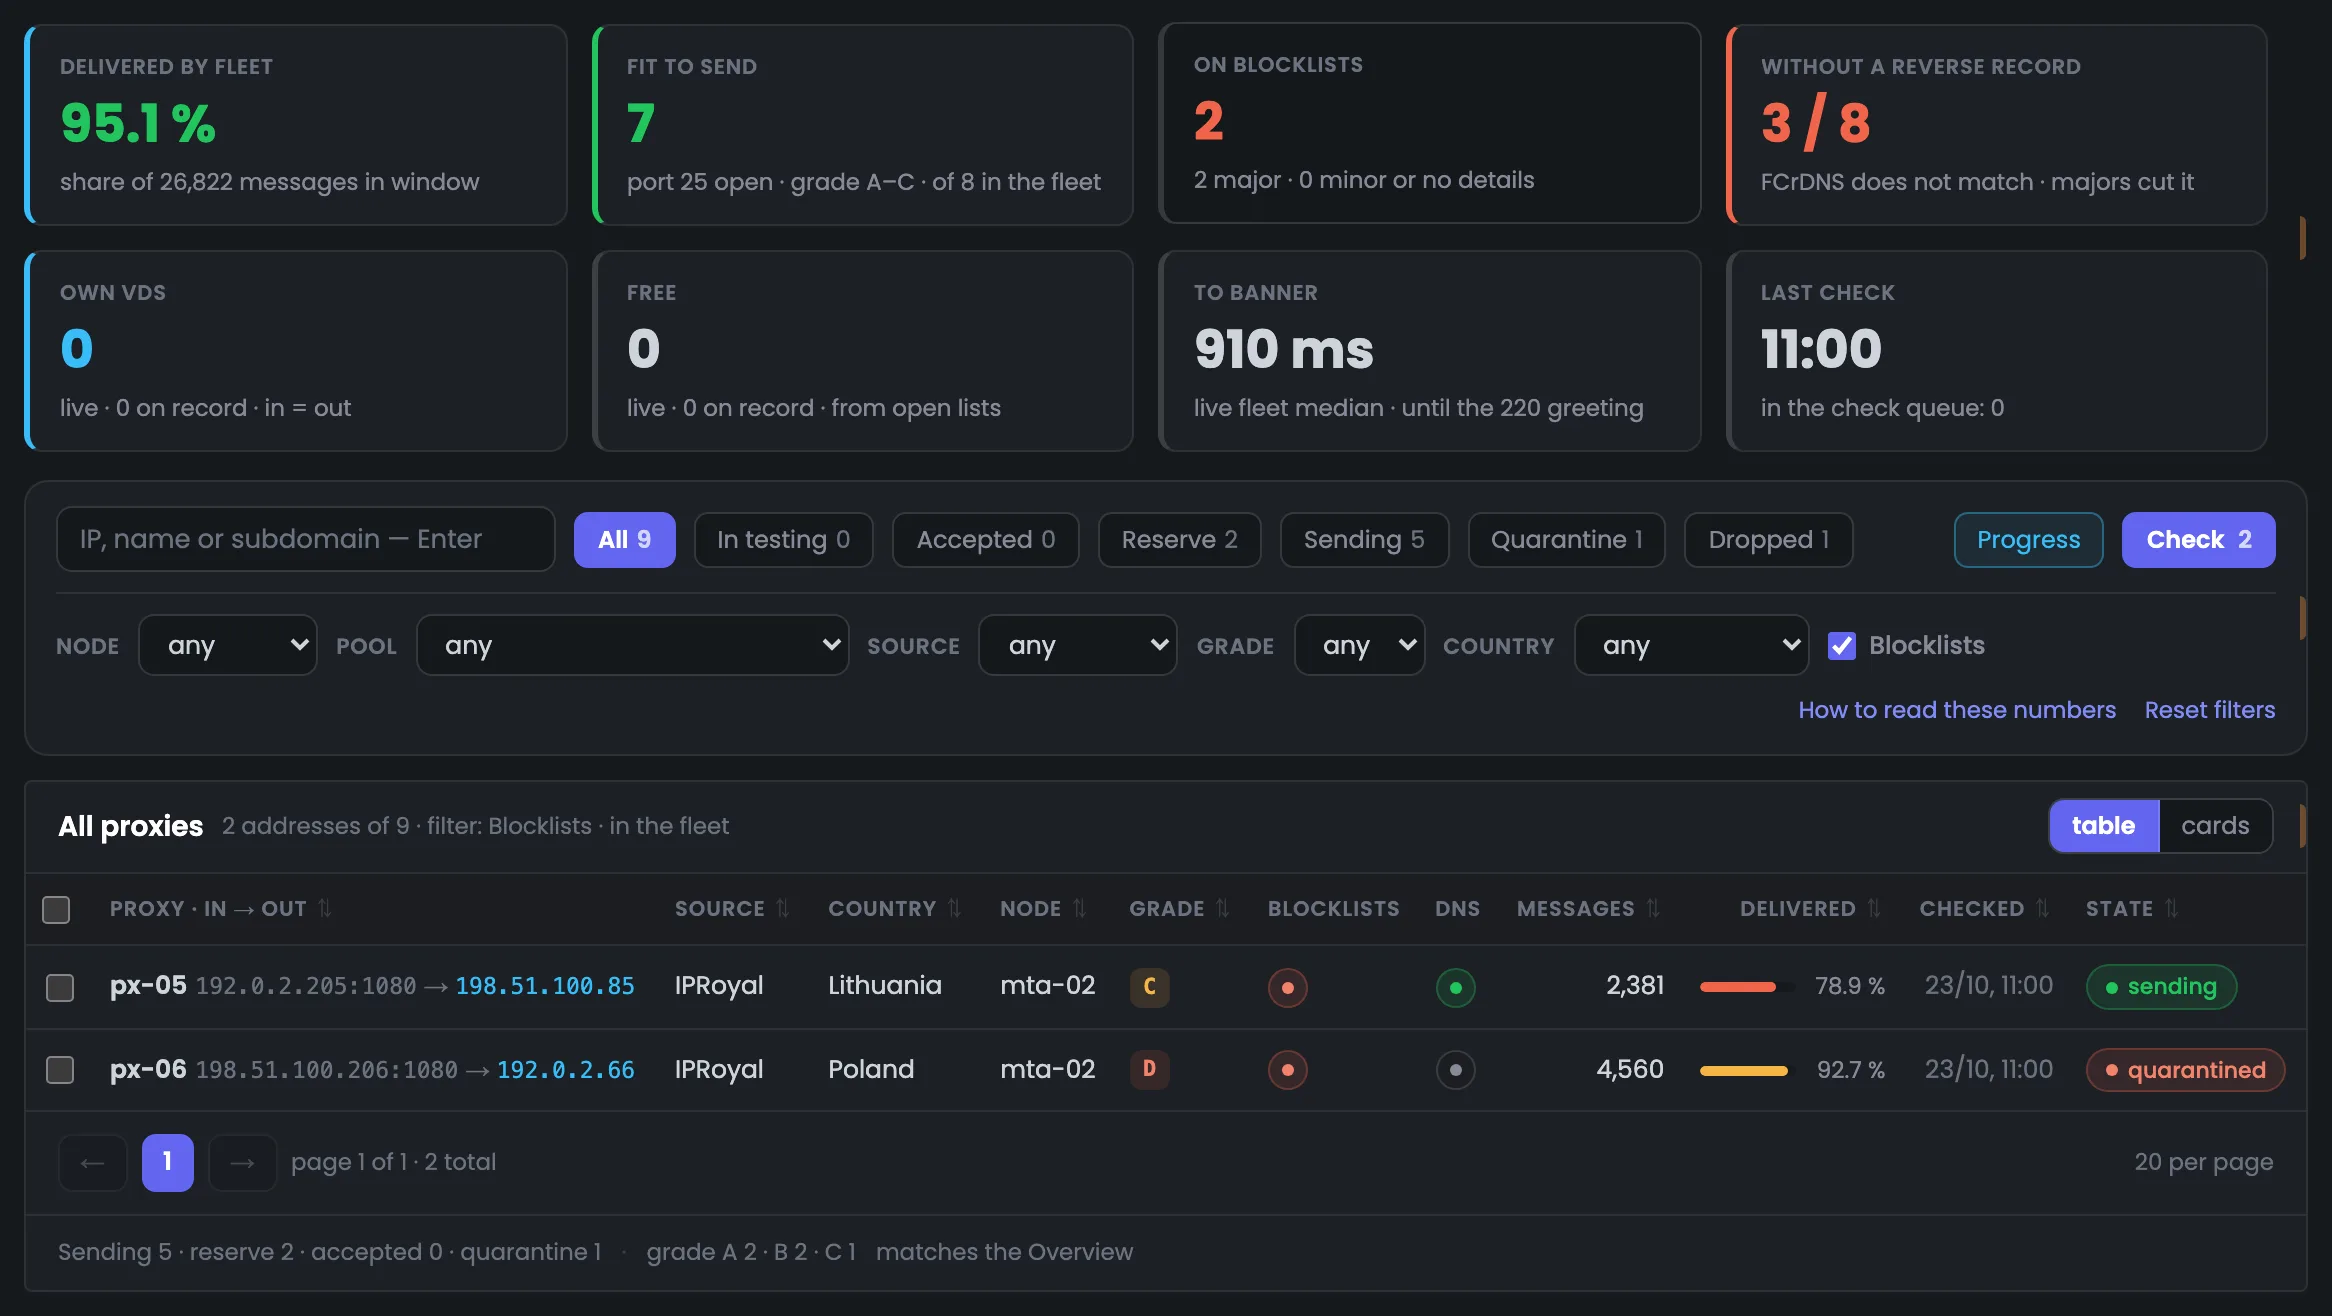
Click the “On blacklists” metric, and only the addresses it counted stay in the table. In the example these are px-05 and px-06. The caption above the table names the selection — “Blacklists · in the fleet”, the “Blacklists” tick box in the filters switches on by itself, and the check button now shows 2. The metrics count the fleet without dropped addresses, which is why the caption spells out the scope — “in the fleet”. So in one click you get from an overall figure to specific proxies and can recheck them right away. The same trick works with other metrics too — for example, “Fit for mail”, “Without a reverse record”, “Own VDS” and “Free”.
 Enlarge
The metrics count the fleet without dropped addresses, while the states count the whole list, so their scope can differ.
If no address matches the conditions, instead of an empty table the Hub explains what happened. In the example someone looked for grade A proxies in Lithuania — there are none in the fleet. The Hub says how many proxies there are in total and that none match these conditions, and right away offers the closest result: without the “Country” condition two addresses would be found, and the “Show them” button opens them. “Reset everything” brings back the whole list. This way a selection that’s too narrow doesn’t lead to a dead end: you see at once which condition is in the way. There’s nothing to go through by hand: one button takes you back to the closest matching addresses.
 Enlarge
Instead of an empty screen — the reason and the next step.
06 / Questions about the list
A few distinctions that help you read a proxy’s state, check results and sending history correctly. Short, to-the-point answers.
EnlargeWhat each state means and why “Fit for mail” doesn’t match any of them — right in the Hub, under the filters.
Fit for mail means port 25 is open and the grade is A to C. The state, on the other hand, says what role the address plays right now. A proxy that passed the checks may be sitting in reserve and not sending mail yet.
The metric checks whether the address’s reverse DNS record matches the forward one (the FCrDNS check). “3 / 8” means that for three of eight checked addresses the records don’t match. Addresses that haven’t been checked yet aren’t counted as failed.
Only the message count and the delivered share — they’re counted from MTA reports. State, grade, blacklists and DNS show the address’s current position and don’t depend on the period.
It may have been sending at the start of the selected period and gone into quarantine later. Messages are the history for the period; quarantine is what’s happening to the address now.
Exactly the rows that match the current selection. The file contains no passwords. Which conditions are selected is shown in the caption above the table and in the filters.
No, at first only the list in the Hub changes. Passing the changes to the gate and updating DNS is a separate step. A line right on the action panel reminds you of this.
07 / Next step
The list takes care of the addresses themselves. For proxies to start sending, you need to group them into a pool and tie it to a node and a domain; the checks then keep watching whether the addresses are fit for mail.
The module overview shows the whole route — from the MTA through the gate to the recipient’s mail server.