Bank vMTAs
2.2%id. and secure.corvalis-bank.org send 37 thousand messages each — over 60% of all sending — with a bounce rate of 2.2%.
NvMTA
bank
corvalis-bank2.2%
37 thousand messages60% of sending

PowerMTA vMTA statistics
A vMTA is a sending address with its own rules. If the points share the same list and mailings, the difference between them tells you about the address itself, not the message.
Each point's volume and bounces, its days and worst domains, hourly maps for a chosen day, and a “point × domain” table.
01 / Comparing vMTAs
The tiles compare sending points that have at least 1% of sending, and say how many small ones were left out. The vMTA bounce rate is colored by the Hub's common thresholds: under 4% — green, from 4% — yellow, from 6% — red. This shows right away which sending IP addresses lag behind the rest.
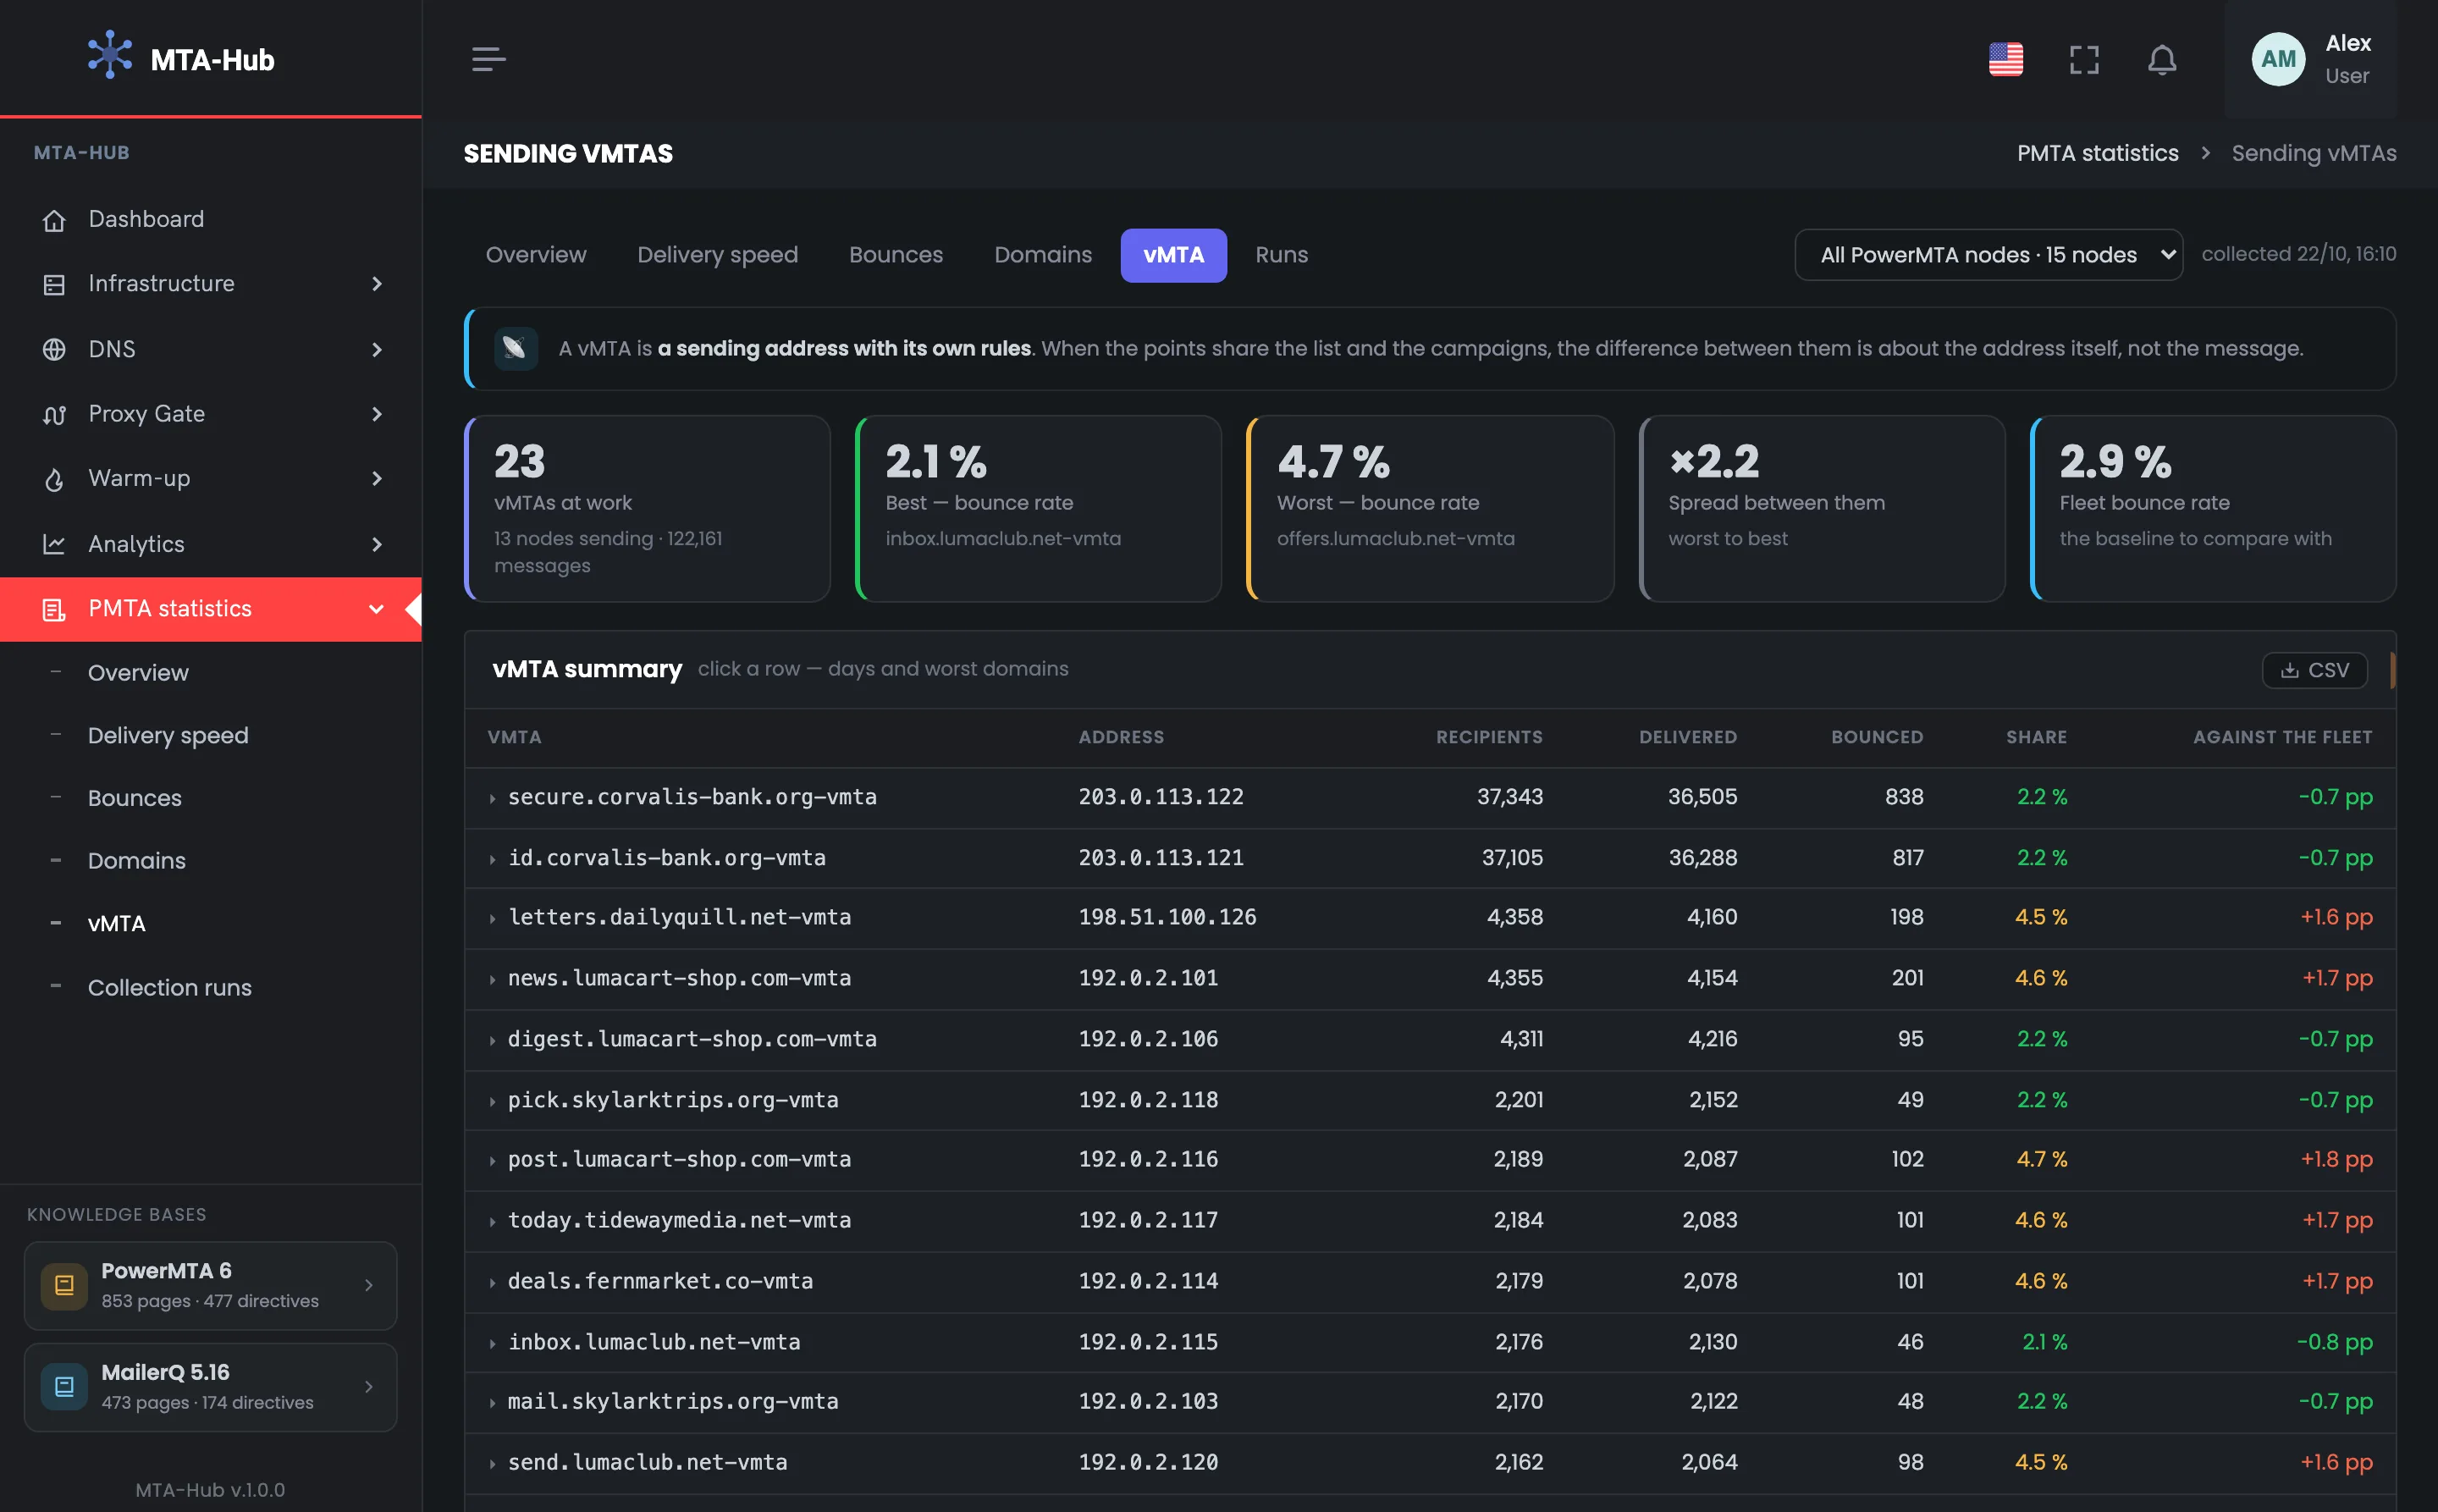
Here all 23 points are included in the comparison
id. and secure.corvalis-bank.org send 37 thousand messages each — over 60% of all sending — with a bounce rate of 2.2%.
Fifteen points have a rate of 4.4–4.7% — 1.5–1.8 percentage points worse than the average across all points.
Warm-up, reverse DNS records and blacklists aren't in the MTA's accounting: you see “who's worse” here, and “why” on the addresses page of “Analytics”.
02 / One sending point
Clicking a point shows its days — incomplete days at the edges of the period are paler and captioned — and up to five domains it delivers to worst. This shows whether the point sends steadily from day to day and with which mailbox providers it has problems.
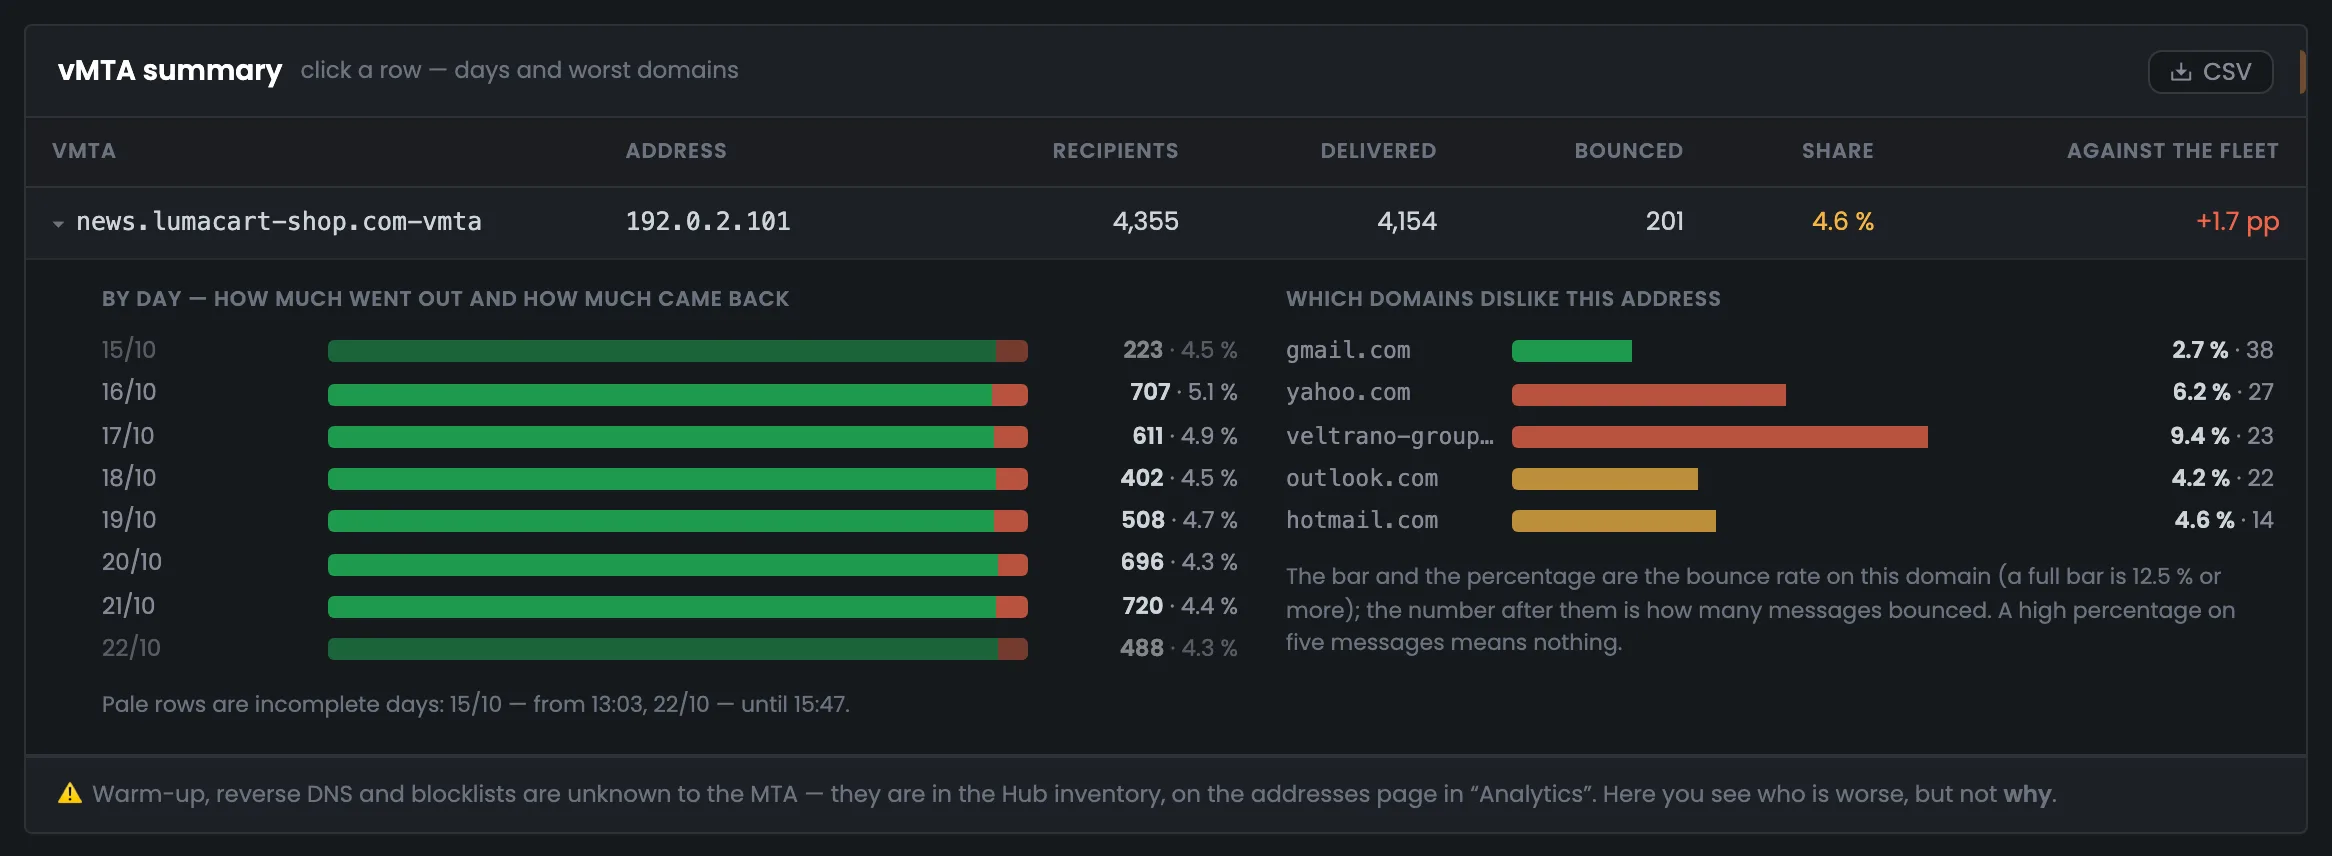
From 223 to 720 messages a day with a bounce rate of 4.3–5.1%. Oct 15 and Oct 22 are paler: the accounting period starts on Oct 15 at 13:03 and ends on Oct 22 at 15:47.
veltrano-group.com — 9.4% and yahoo.com — 6.2%, in red; hotmail.com and outlook.com — in yellow; gmail.com — 2.7%, but with the most bounces — 38.
A hint under the bars says that a high percentage on five messages means nothing.
03 / Hourly maps
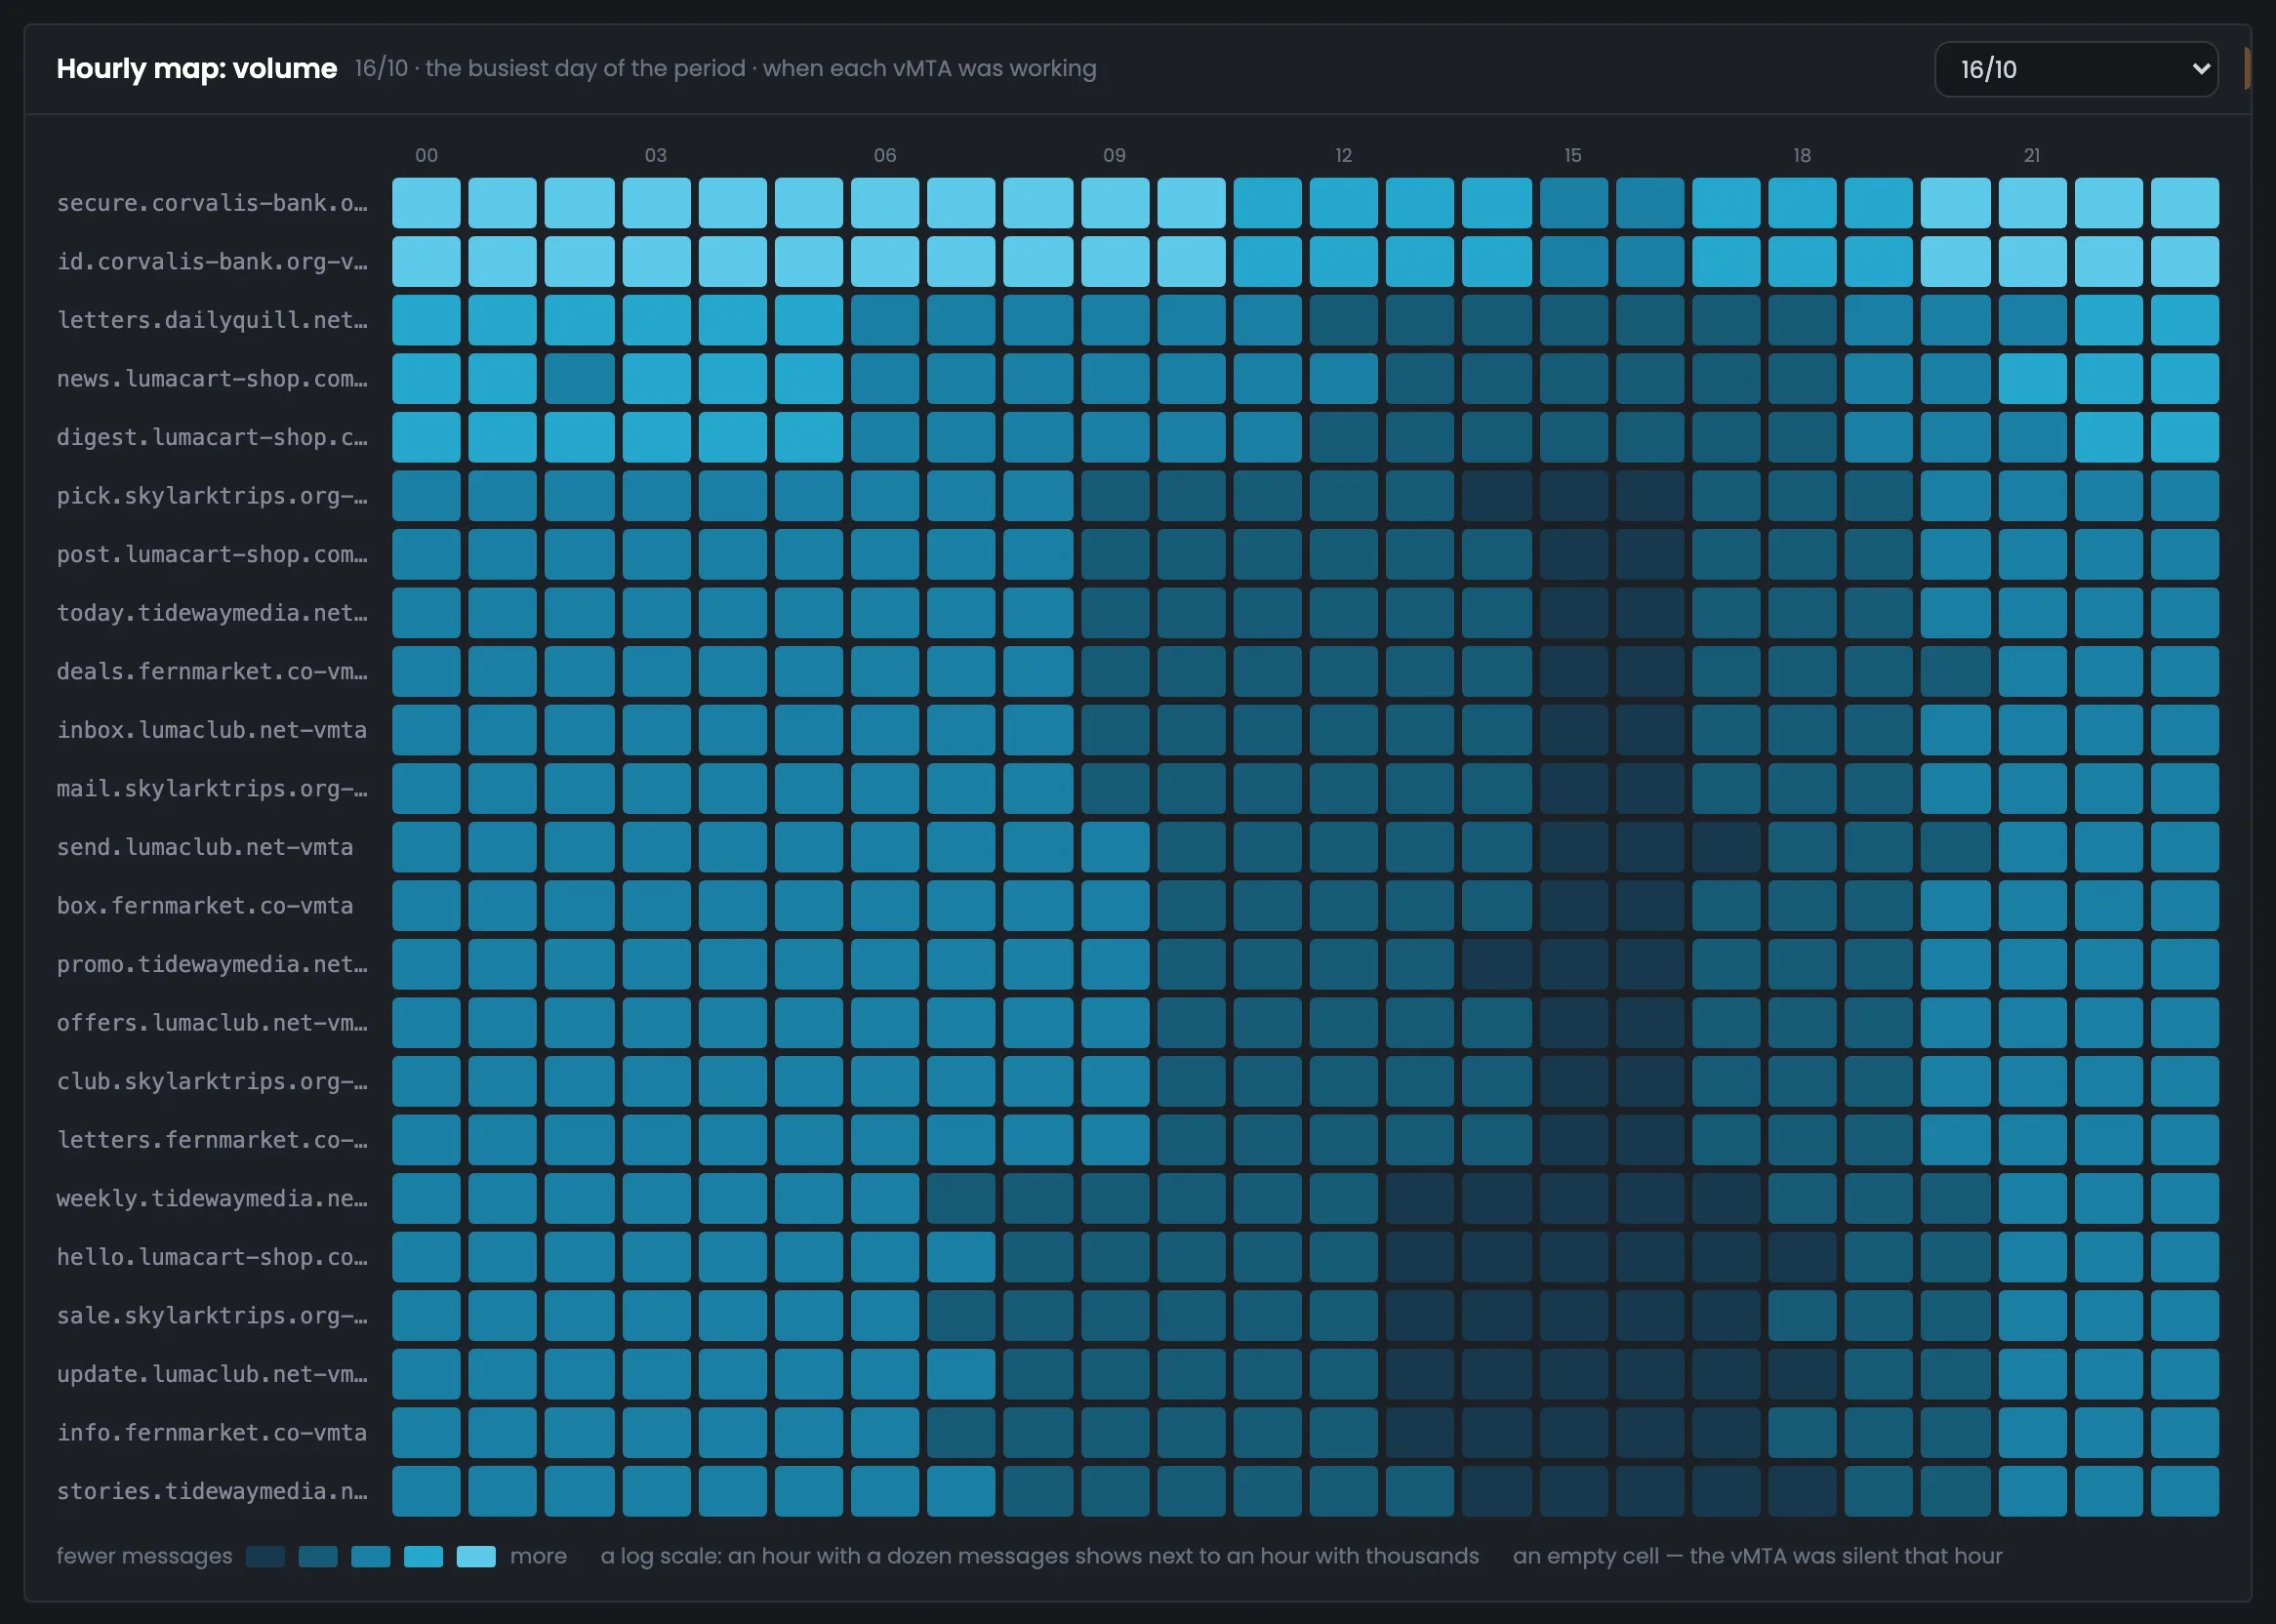
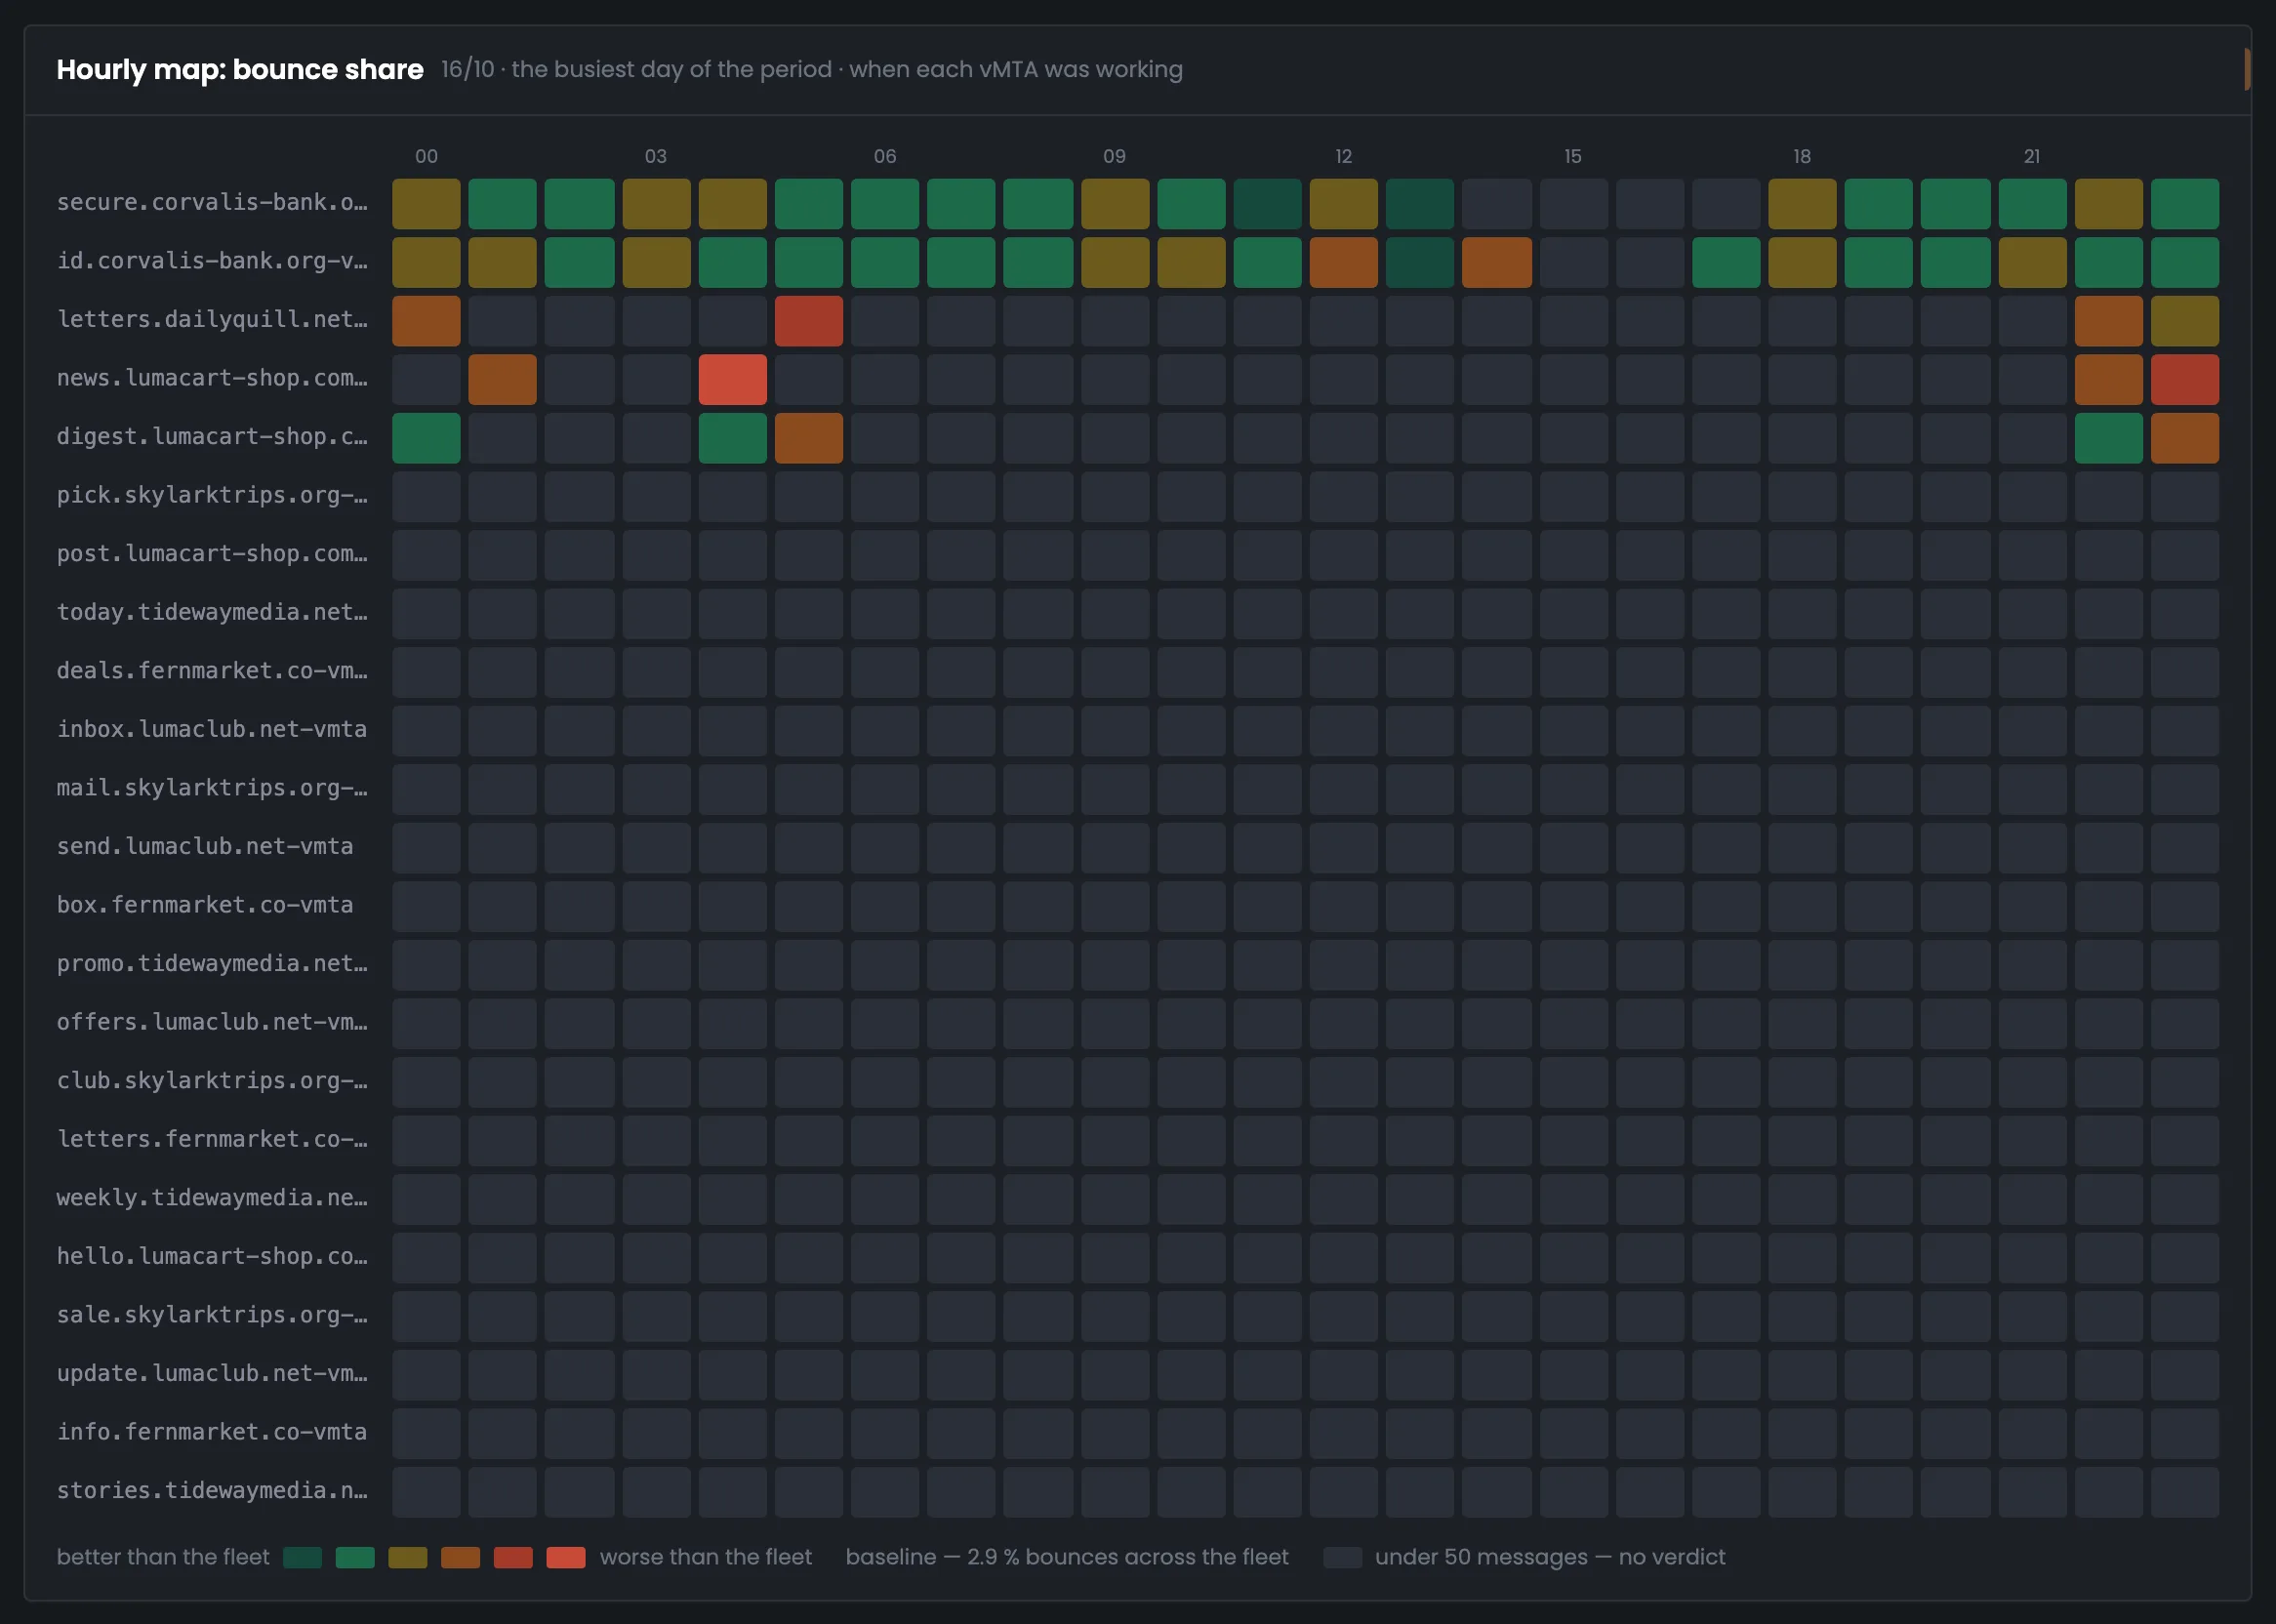
Volume is on a logarithmic scale: a point with ten messages an hour is visible next to a bank point with hundreds. The map opens on the busiest day of the period, and hours are in your profile's time zone. The second map shows the bounce rate for each hour — it's only rated where there are at least fifty messages.
Bank vMTAs peaking at 536 messages an hour and points with 20–30 messages fit in one picture — and you can see that all 23 worked every hour on Oct 16.
Only hours with at least fifty messages get a rating: 55 cells out of 552. The rest are gray — for a point with twenty messages, one bounce gives either 0 or 5%.
Hours outside the period on the edge days are hatched: there's no data for them, it's not downtime.
04 / Point × domain
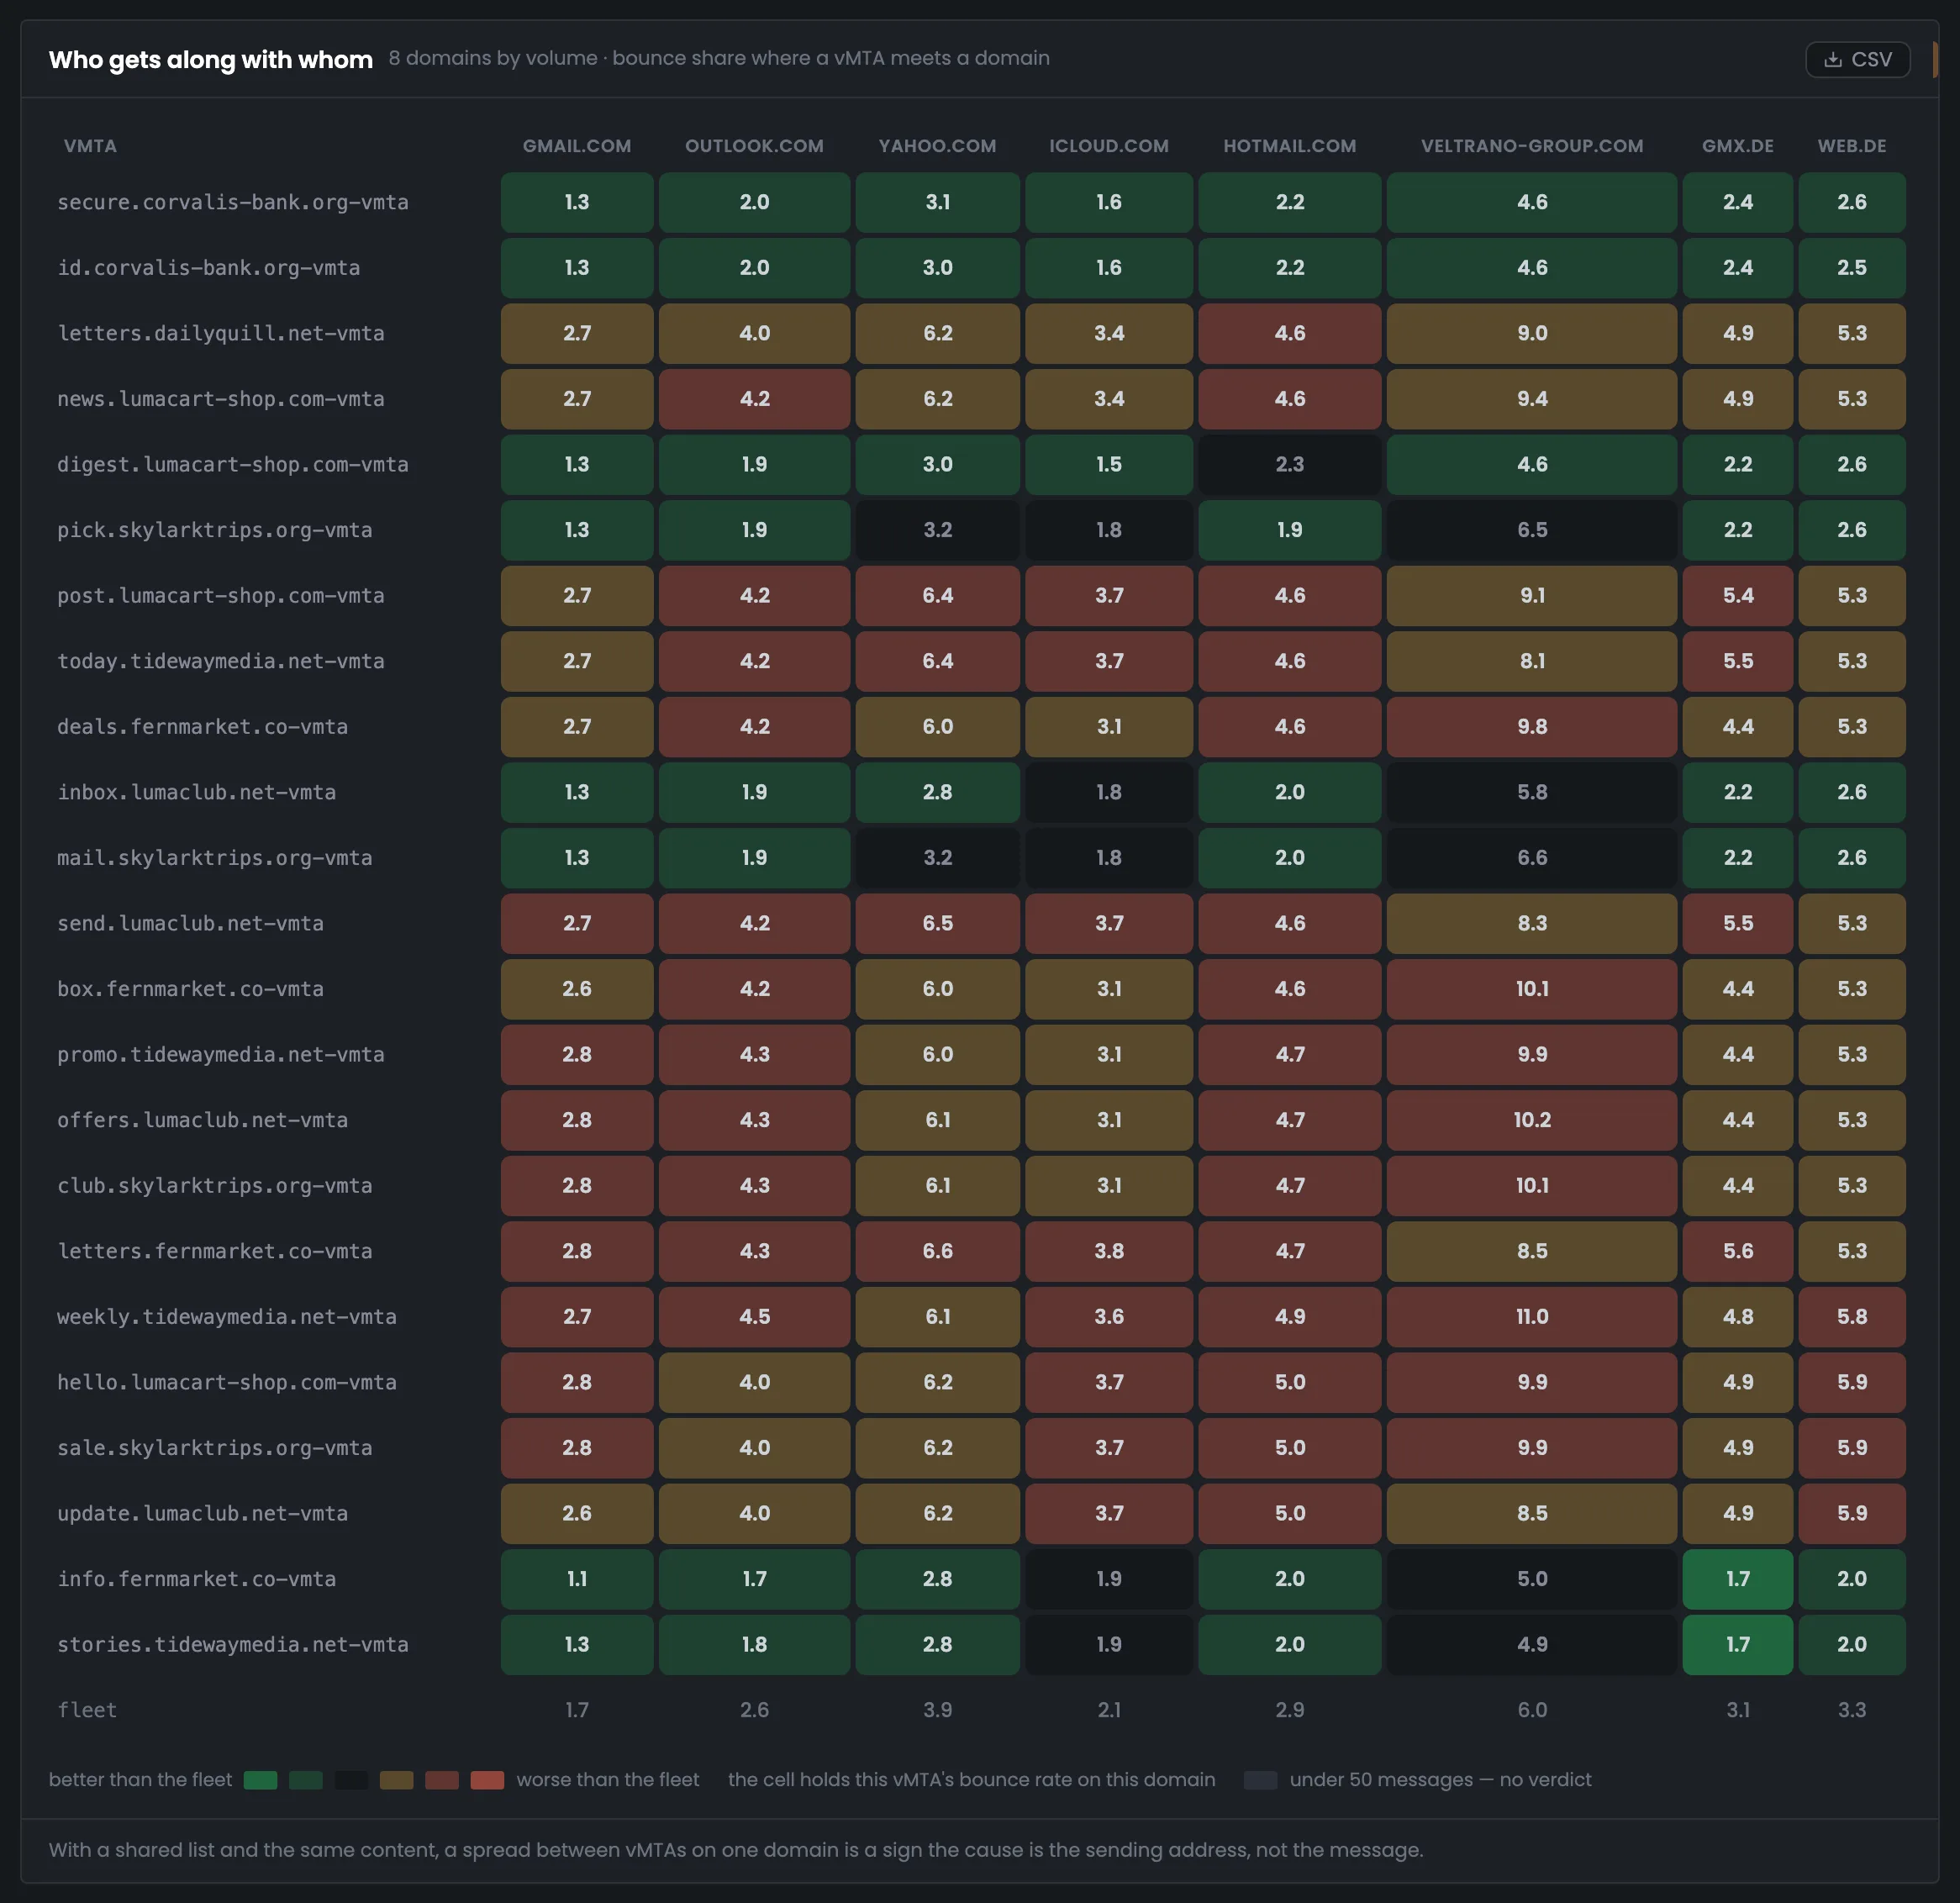
The table shows the bounce rate of each point on each of the eight largest domains. The bottom row is the average across all points for that domain, and the cell color compares against exactly that. If one vMTA is worse than average on every domain, the problem is its address, not the message.
About 4.6% — and every cell is worse than average. If the list and messages are shared, the problem is the addresses.
6.0% on average versus 1.7% for gmail.com — and the same points are worse on it too: up to 11.0%.
The Hub doesn't know what goes through the points, and says so.
A cell with fewer than fifty messages for the week would be gray; there are none here.
05 / The interface in detail
Key figures, the summary by point, an expanded row, two hourly maps and the “point × domain” table. Above each screenshot: why the screen matters. Below it: what it shows.
The tab starts with the best and worst sending point and the spread between them. Below is a summary of all vMTAs: recipients, delivery, bounces and how each one differs from the average in percentage points. Clicking a row expands one point's days and worst domains. These screens show which sending addresses lag behind and by how much.
The tiles sum up the week's vMTA statistics: the best and worst sending point by bounce rate, the spread between them and the average across all points. It's a quick answer to how evenly your sending addresses perform. In the example 23 vMTAs on 13 servers sent 122,161 messages; the best is inbox.lumaclub.net-vmta with 2.1% bounced, the worst is offers.lumaclub.net-vmta with 4.7%. Points with under 1% of sending are left out of the comparison, so that one random bounce doesn't make them the worst. The color follows the Hub's common thresholds: under 4% — green, from 4% — yellow, from 6% — red. If the spread is large, the next step is the summary below, which shows how each point differs from the average.
 Enlarge
Color: under 4% — green, from 4% — yellow, from 6% — red.
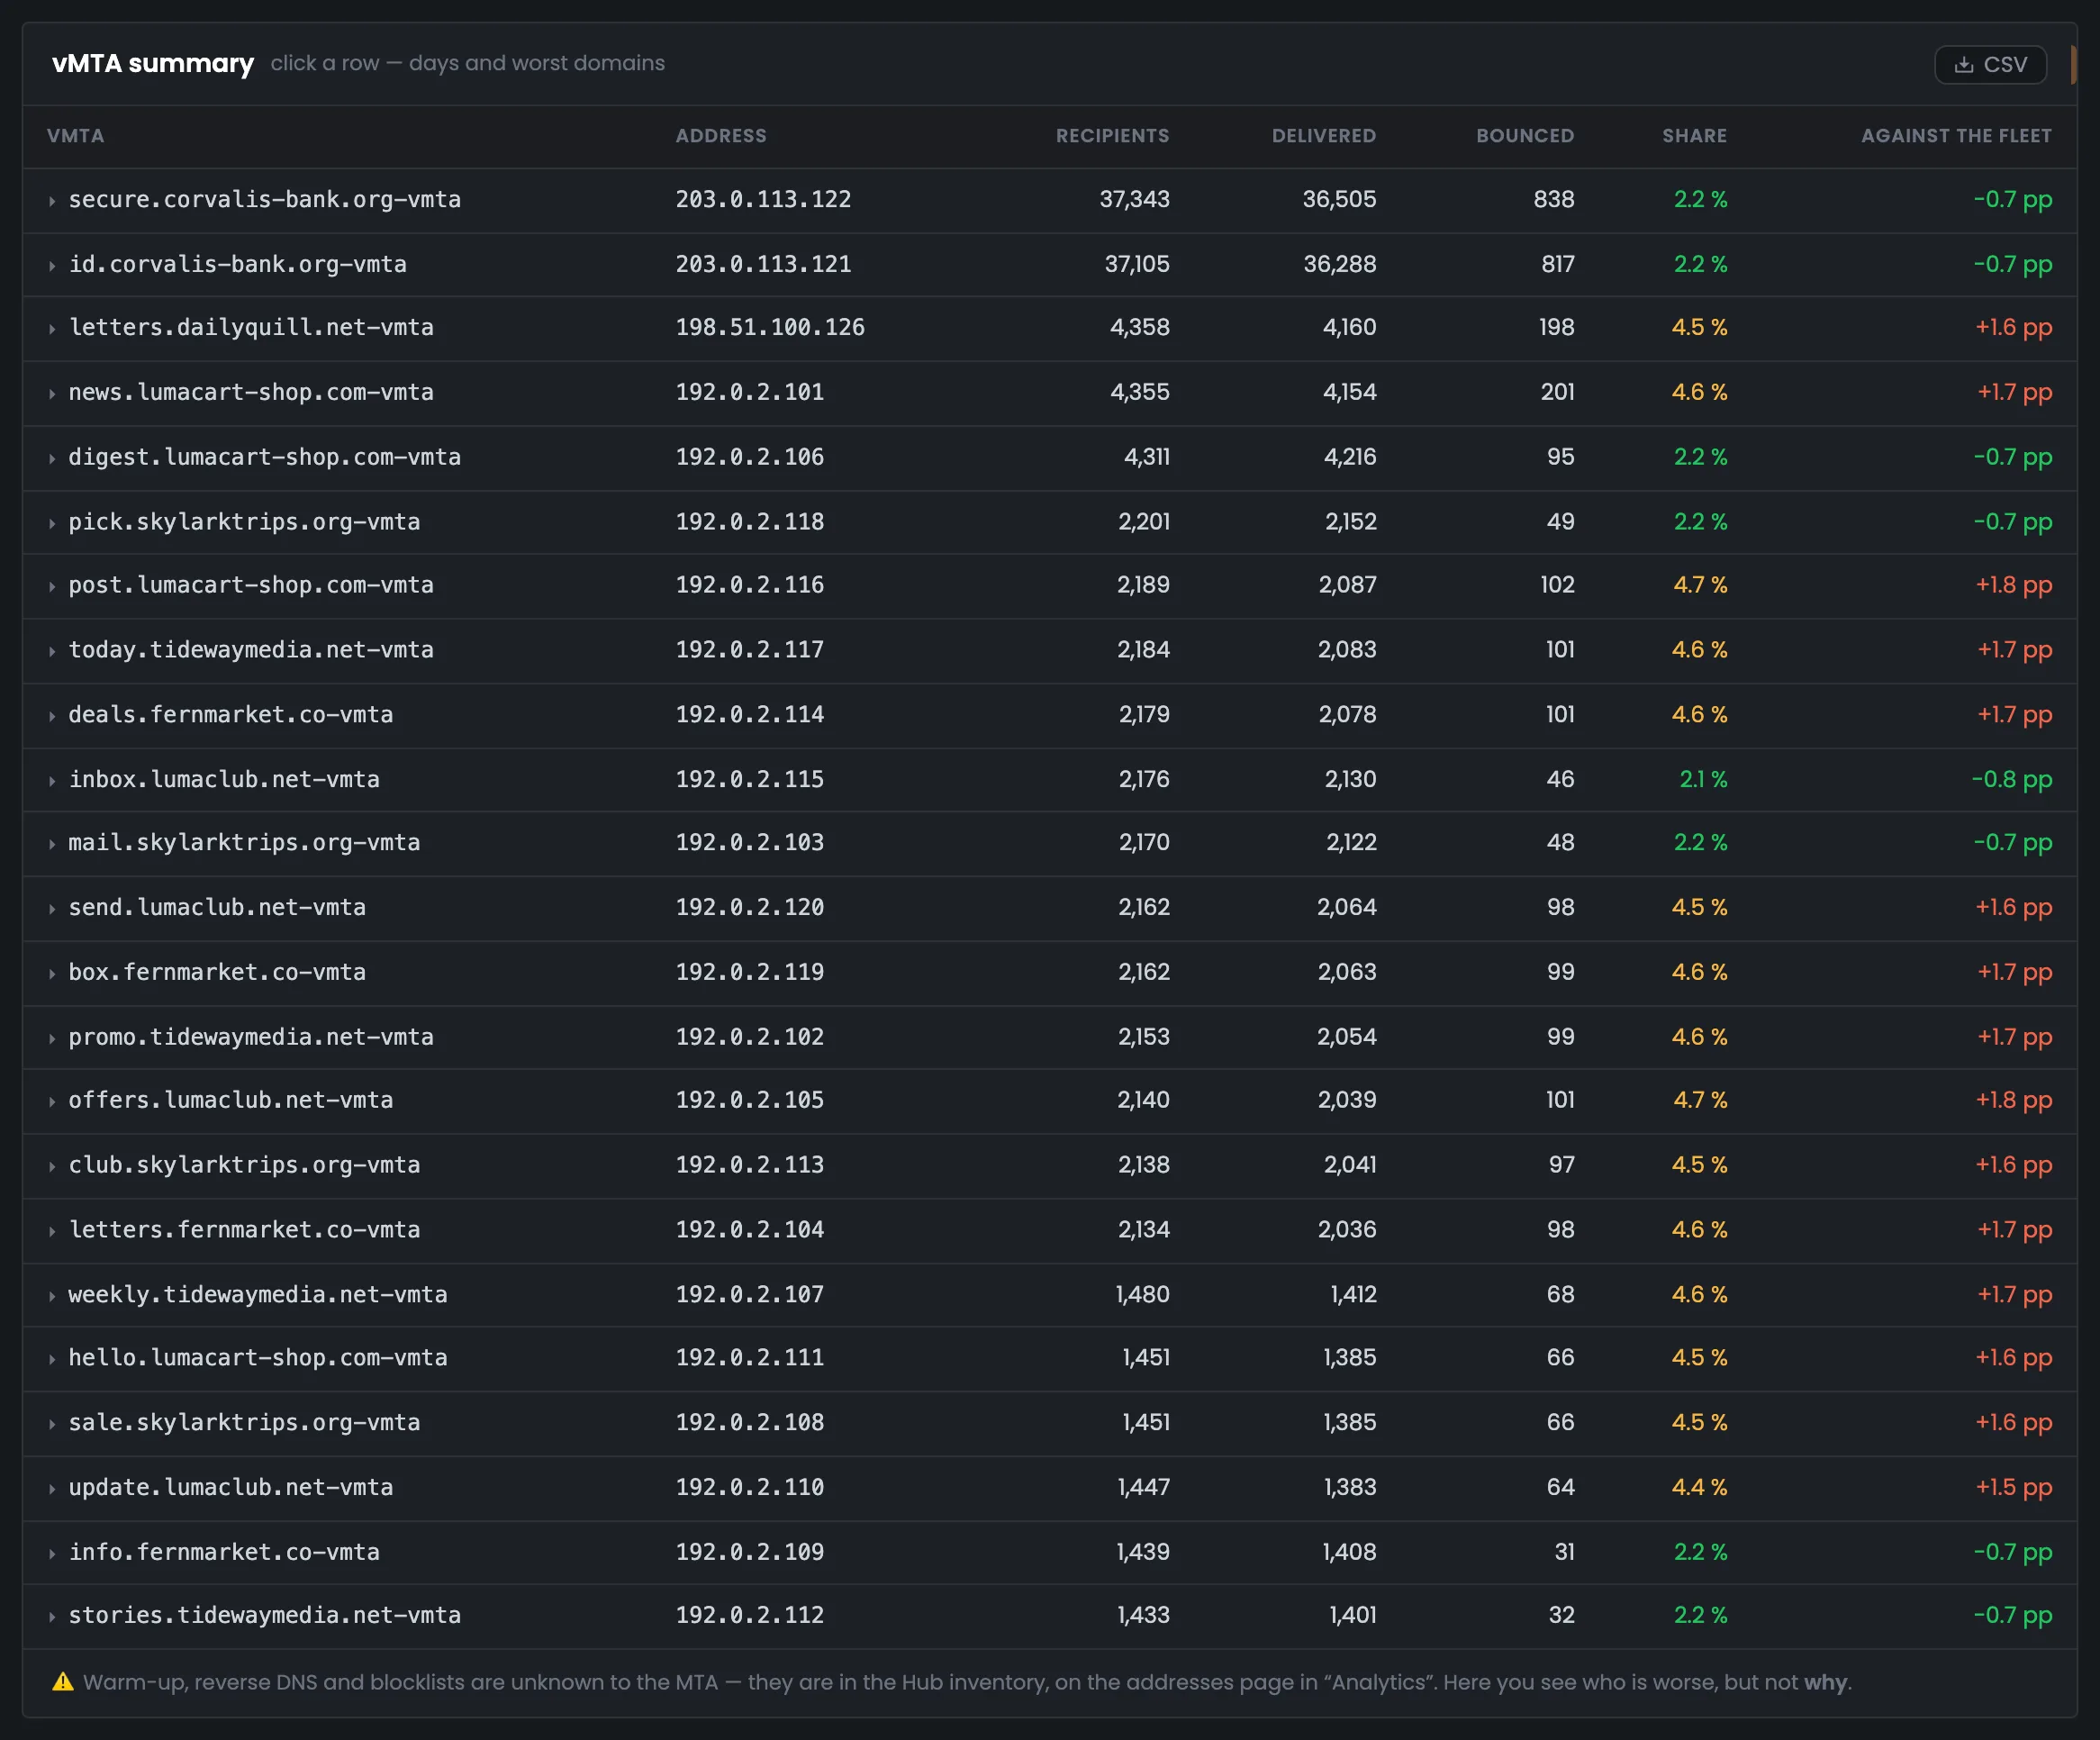
The summary shows every sending point: the vMTA name, its address, recipients, delivery, bounces and how its bounce rate differs from the average in percentage points. You use it to compare sending IP addresses with each other and find a group that lags behind. In the example the two bank vMTAs send over 60% of all mail with 2.2% bounced, while fifteen points have a rate of 4.4–4.7% — 1.5–1.8 pp worse than average. Why an address is worse — warm-up, PTR, blacklists — you check on the addresses page of “Analytics”. Eight points hold at 2.1–2.2%, so the difference within one list is obvious right away. Clicking a row expands the point's days and worst domains.
 Enlarge
“Who's worse” — here, “why” — in “Analytics”.
Clicking a summary row expands the details of one vMTA: on the left — its days, on the right — up to five domains it delivers to worst. The screen helps you see whether the point lags all the time or on certain days, and with which mailbox providers. In the example news.lumacart-shop.com-vmta is expanded: 223–720 messages a day with 4.3–5.1% bounced, the worst domains are veltrano-group.com (9.4%) and yahoo.com (6.2%). gmail.com has a rate of only 2.7%, but the largest number of bounces — 38. A hint under the bars reminds you: a full bar is 12.5% or more, and a high percentage on five messages means nothing. Oct 15 and Oct 22 are paler — these are the edges of the accounting period.
 Enlarge
A full bar is 12.5% or more.
Next — two hourly maps for a chosen day: each vMTA's sending volume and the bounce rate for each hour. Hours are in your profile's time zone, and the map opens on the busiest day by itself. The maps show whether the points worked all day and in which hours their bounces went up.
The hourly volume map shows how many messages each vMTA sent in each hour of the chosen day. The scale is logarithmic, so a point with twenty messages an hour is visible next to a bank point with hundreds. The map opens on the busiest day by itself — Oct 16 in the example — and shows that all 23 points worked every hour. An empty cell would mean the point was silent that hour; you pick another day in the list on the right. Hours are in your profile's time zone. The edge days are captioned “Oct 15 — from 13:03”, and hours outside the period are hatched: there's no data for them, it's not downtime. Look at the volume map together with the bounce map below.
 Enlarge
The day is picked in the list on the right.
The second map is each vMTA's bounce rate by hour for the same day, compared with the average across all points, 2.9%: green — better, red — worse. It shows in which hours a point's bounces went up. Only hours with at least fifty messages get a rating — in the example 55 cells out of 552, and 22 and 20 hours out of 24 for the bank vMTAs. The other cells are gray: on twenty messages one bounce gives either 0 or 5%, and the color would only confuse you. Compare the red hours with the volume map above: that shows whether a point's bounces grow along with the load. The 50-message threshold is given in the legend, and the message count is in each cell's tooltip.
 Enlarge
The threshold is given in the legend.
At the bottom — the “point × domain” table: each vMTA's bounce rate on the eight largest recipient domains. The cell color compares it with the average across all points for that domain. This is the main screen for deciding where the problem is — in the sending address or in the message.
The “point × domain” table shows each vMTA's bounce rate on each of the eight largest domains; the bottom row is the average across all points for that domain. This is the main screen for deciding where the problem is — in the sending address or in the message. In the example fifteen points have every cell worse than average: if the list and messages are shared, the problem is the addresses. veltrano-group.com has a problem of its own — 6.0% versus 1.7% for gmail.com. The Hub doesn't know what goes through the points, so it states its conclusion with a caveat. A cell with fewer than fifty messages for the week would be gray; there are none here. Why an address is worse — warm-up, reverse DNS, blacklists — you check on the addresses page of “Analytics”.
 Enlarge
The conclusion comes with a caveat: the Hub doesn't know what goes through the points.
06 / Questions about vMTAs
In short: how points are compared and why some cells are gray.
EnlargeThe point's days on the left, worst domains on the right; the edges of the period are paler and captioned.
A sending address with its own rules inside the MTA. The names come from the MTA settings on the server.
If the list and mailings are shared, the difference between points tells you about the address itself, not the message.
Only points from 1% of sending are compared; otherwise a small point with a single bounce would look like the worst.
So that a point with ten messages an hour is visible next to a bank point with hundreds.
The bounce rate is only rated where there are at least fifty messages: on twenty messages one bounce gives either 0 or 5%.
In your profile's time zone, like the rest of the Hub.
No, they aren't in the MTA's accounting. The Hub keeps this data, and it's on the addresses page of “Analytics”.
Hours outside the accounting period: there's no data for them, it's not downtime.
07 / Next step
Sending points show which recipients your mail reaches worse. How long messages take and where the time goes — on the “Delivery speed” tab.
Why an address is worse — warm-up, reverse DNS, blacklists — on the addresses page of “Analytics”.