Email delivery speed. How long it takes a message to arrive.
The average delivery time hides problems: a thousand messages in a second and a hundred in an hour give a decent average, even though a hundred recipients waited an hour.
This tab shows the whole picture from the MTAs' own accounting log — from the moment a message enters the queue to the mailbox provider's reply — and exactly where the time goes.
Half, 80, 95 and 99% of delivered messages and the slowest message — side by side. The curve on a logarithmic scale shows both seconds and hours, and the caption under it names the point where the curve shoots up. Percentiles show what the average delivery time hides: how many recipients had a long wait.
118,403 delivered messages
01 · Half0:00:05
02 · 95%0:08:59
03 · 99%2:48:27
04 · Slowest18:59:43
After 99% the curve shoots up: seven times longer
Under the curve — a comparison with the previous collection: 95% — 0:08:59 versus 0:08:39, over a minute — 15.3% of messages versus 14.9%.
02 / Estimate and measurement
What's an estimate and what's an exact measurement.
You can't simply add up percentiles from different servers. So the shares for all servers together are estimated from the summed message counts in time intervals — and the screen says so. The slowest message and the overall average, on the other hand, are measured exactly.
Shares across all servers
Estimate
The curve line for all servers is an estimate from the summed intervals. For a single server the table is exact, taken from its MTA's report.
HMTA-Hub
intervals
95% of messagesEstimate
from intervalsexact per server
The slowest
Measurement
The slowest message and the overall average add up exactly: the 100% row is a measurement, with the domain and server — orange.fr, tx-02.
Ntx-02
gmail.com
100% row18:59:43
measuredwith domain and server
Small intervals are shown as “<0.1%”, not “0.0%”: the 39 messages in “10–12 h” are real messages.
03 / Where the time goes
Message delays: queue, reply, retries.
A message's journey is split into waiting in the queue, the trip to the mailbox provider's reply, and retries after a temporary bounce. This makes it clear where a delay comes from: whether your server or the recipient's server is slow. The Hub calculates waiting and retries itself: the MTA's report utility doesn't provide them.
A message's journey, on average
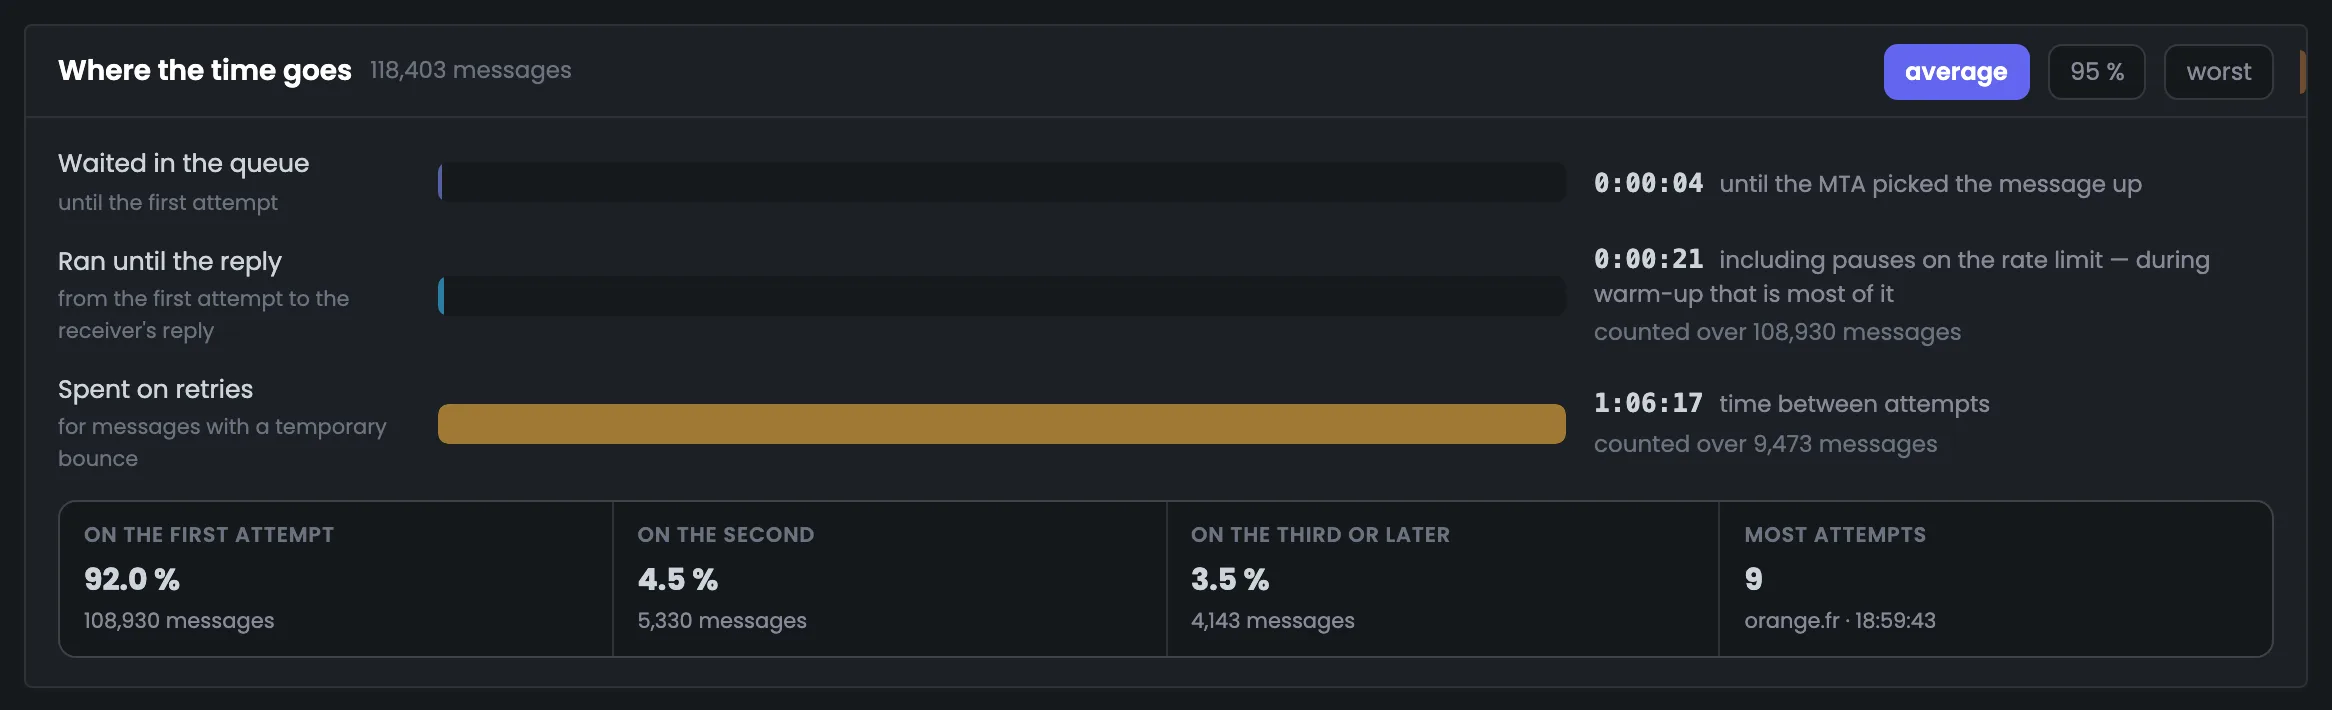
01 · Queue4 seconds
02 · To reply21 s · 108,930 messages
03 · Retries1:06:17 · 9,473 messages
On the first attempt — 92.0%, on the second — 4.5%, on the third and later — 3.5%
Retries
Where the slowest are
The slowest messages are the ones that waited: a rate limit, backoff mode, retries after a temporary bounce. The most attempts — 9.
MMailbox provider
retry
Most attempts9
orange.fr18:59:43
Best window
Across every record
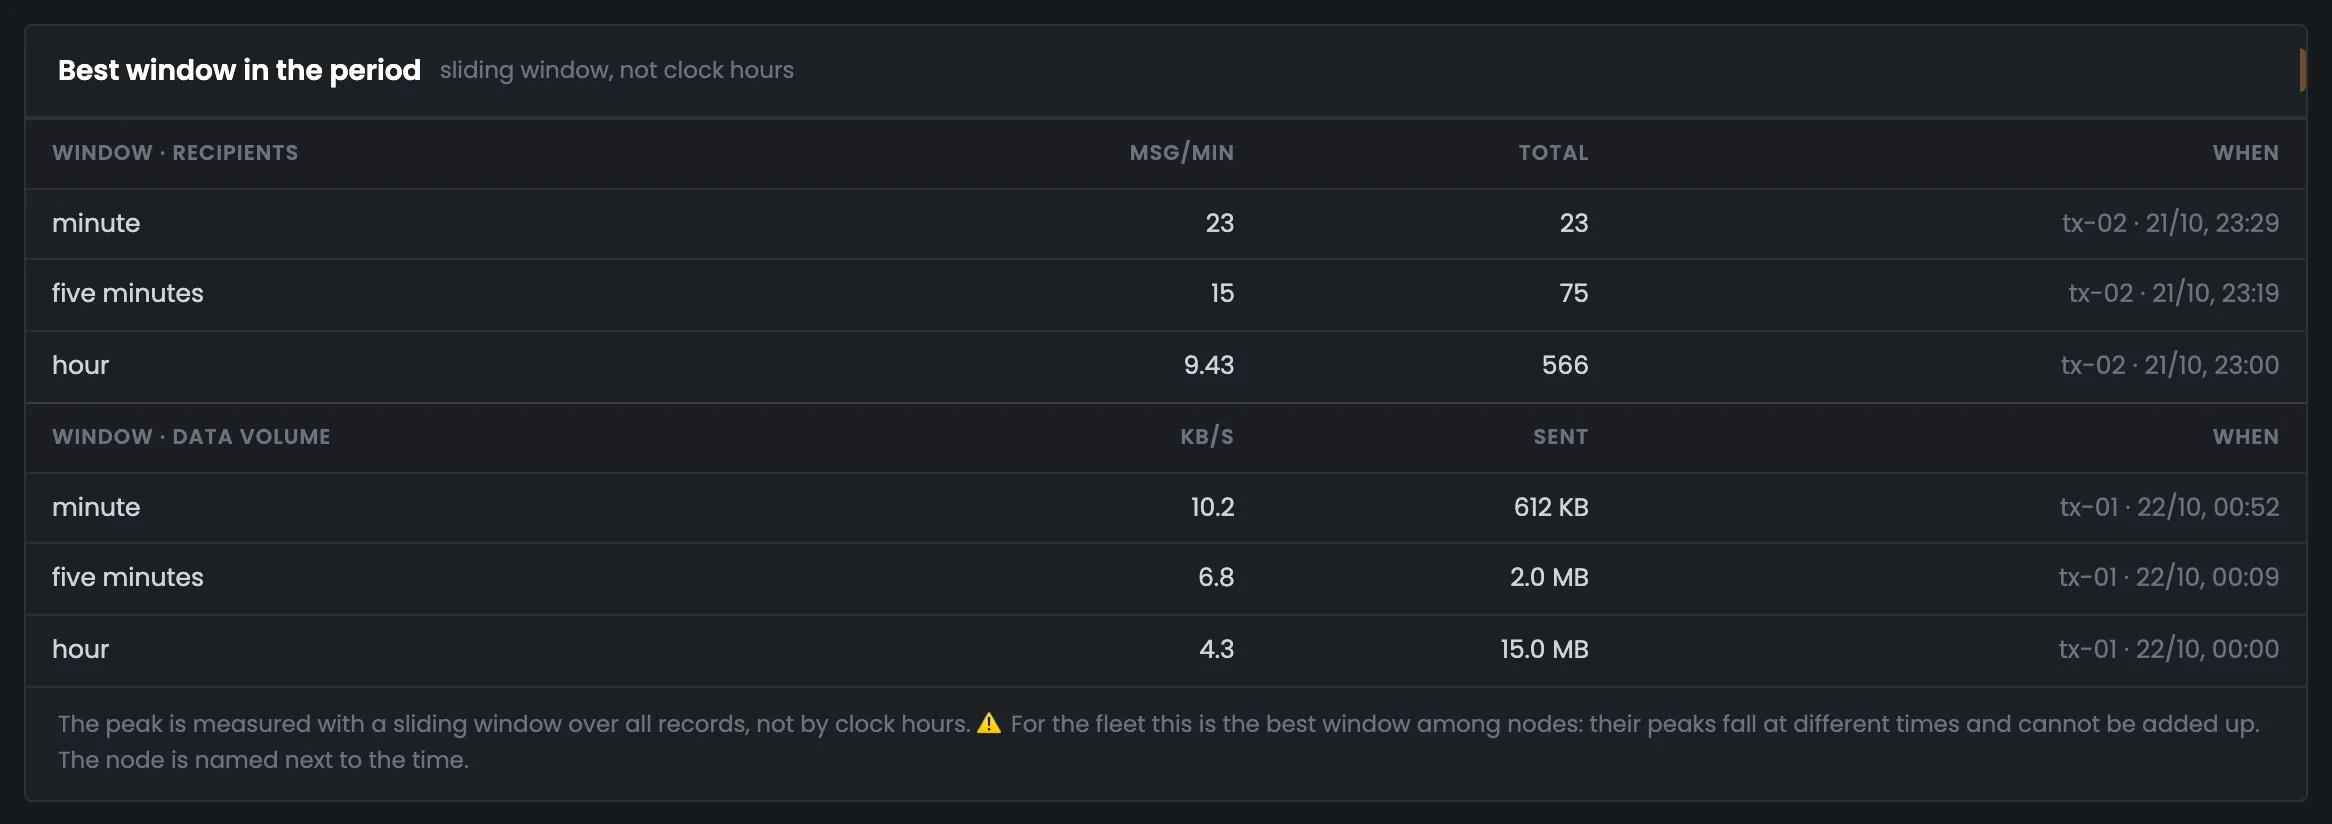
The highest speed belongs to tx-02 on the evening of Oct 21: 23 messages in a minute, 75 in five minutes, 566 in an hour. By volume — tx-01: 15.0 MB in an hour.
Ntx-02
peak
Per hour566 messages
23 per minutetx-01 — 15.0 MB
04 / Who's holding things up
Slow domains, vMTAs and servers.
Domains, sending points and servers — by delivery time. A domain with just a couple of messages is marked “few messages” and doesn't rank above domains with real volume. This shows which recipients your messages take longest to reach.
veltrano-group.com
0:11:51
A corporate domain, 6,425 messages.
aol.com
0:09:22
Next — libero.it, 0:08:14.
yahoo.com
0:08:37
Across 11,701 messages.
All servers
0:05:37
On average; the slowest — 18:59:43.
Per domain the MTA only gives the average and worst time; the “by vMTA” and “by node” views add the half, 95% and the share of messages over a minute.
05 / The interface in detail
The “Delivery speed” tab interface — 7 screens.
Key figures, the curve and its table, intervals, stages of a message's journey, the best window and slow domains. Above each screenshot: why the screen matters. Below it: what it shows.
Curve
4 screens
The tab starts with the key figures — delivery time percentiles and the slowest message. Then the same curve is shown as a chart, as a table and by the MTA's time intervals. Under the curve is a comparison with the previous collection, so you can see whether delivery got faster or slower.
01
Key figures
Half, 80, 95, 99% and the slowest
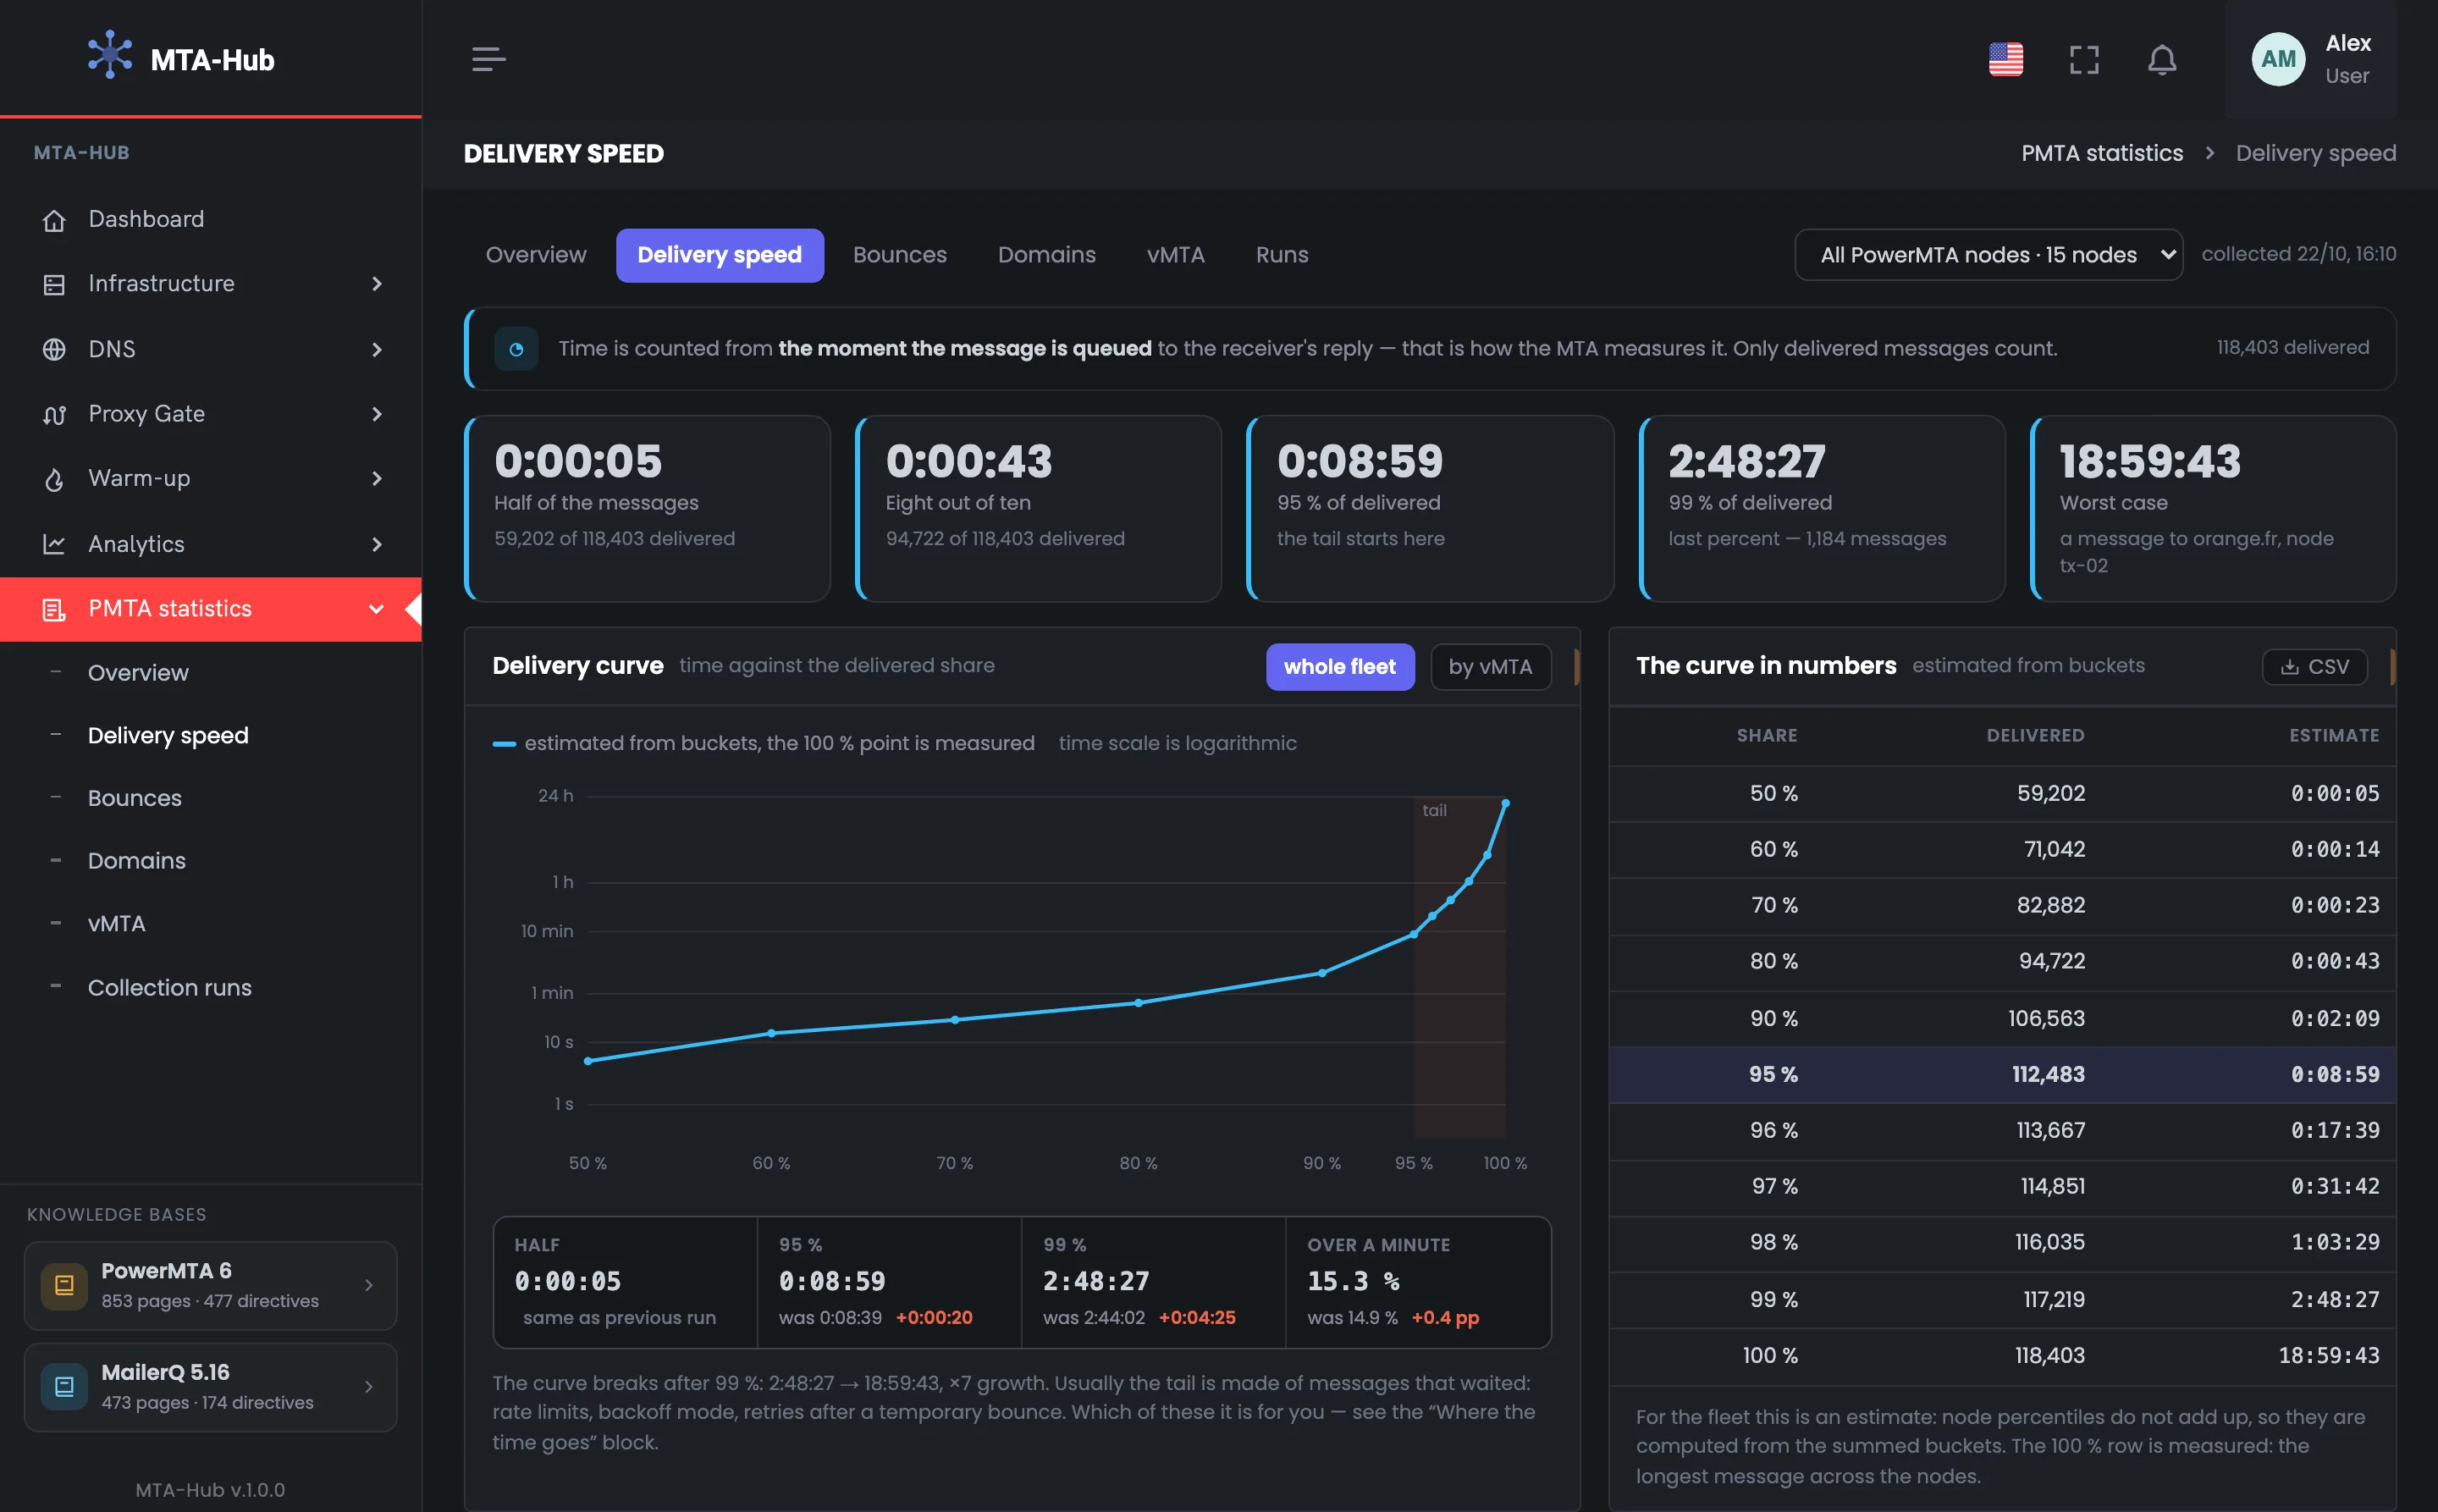
Five tiles are the delivery curve in five numbers: how long it took half, 80, 95 and 99% of delivered messages to arrive, and how long the slowest one took. It's a quick answer to how fast your messages arrive, without the misleading average. In the example half of 118,403 messages arrived within 5 seconds, 95% within 0:08:59, and the slowest message to orange.fr took 18:59:43. The tiles are all one color: there's no “fast or slow” threshold, you judge by the numbers themselves. This is an exact measurement: the slowest message across all servers is the maximum from their reports. The last percent, 1,184 messages, holds the slowest deliveries; why they waited is shown on the “Where the time goes” screen.
EnlargeScreen 01 · Key figures. An example from the MTA-Hub interface.
Half — of 118,403 messages — within 5 seconds.
80% — within 43 seconds.
95% — within 0:08:59.
99% — within 2:48:27.
Slowest — 18:59:43 — orange.fr, server tx-02, an exact measurement.
The tiles are one color: there's no “fast or slow” threshold, judge by the numbers.
02
Delivery curve
Logarithmic scale
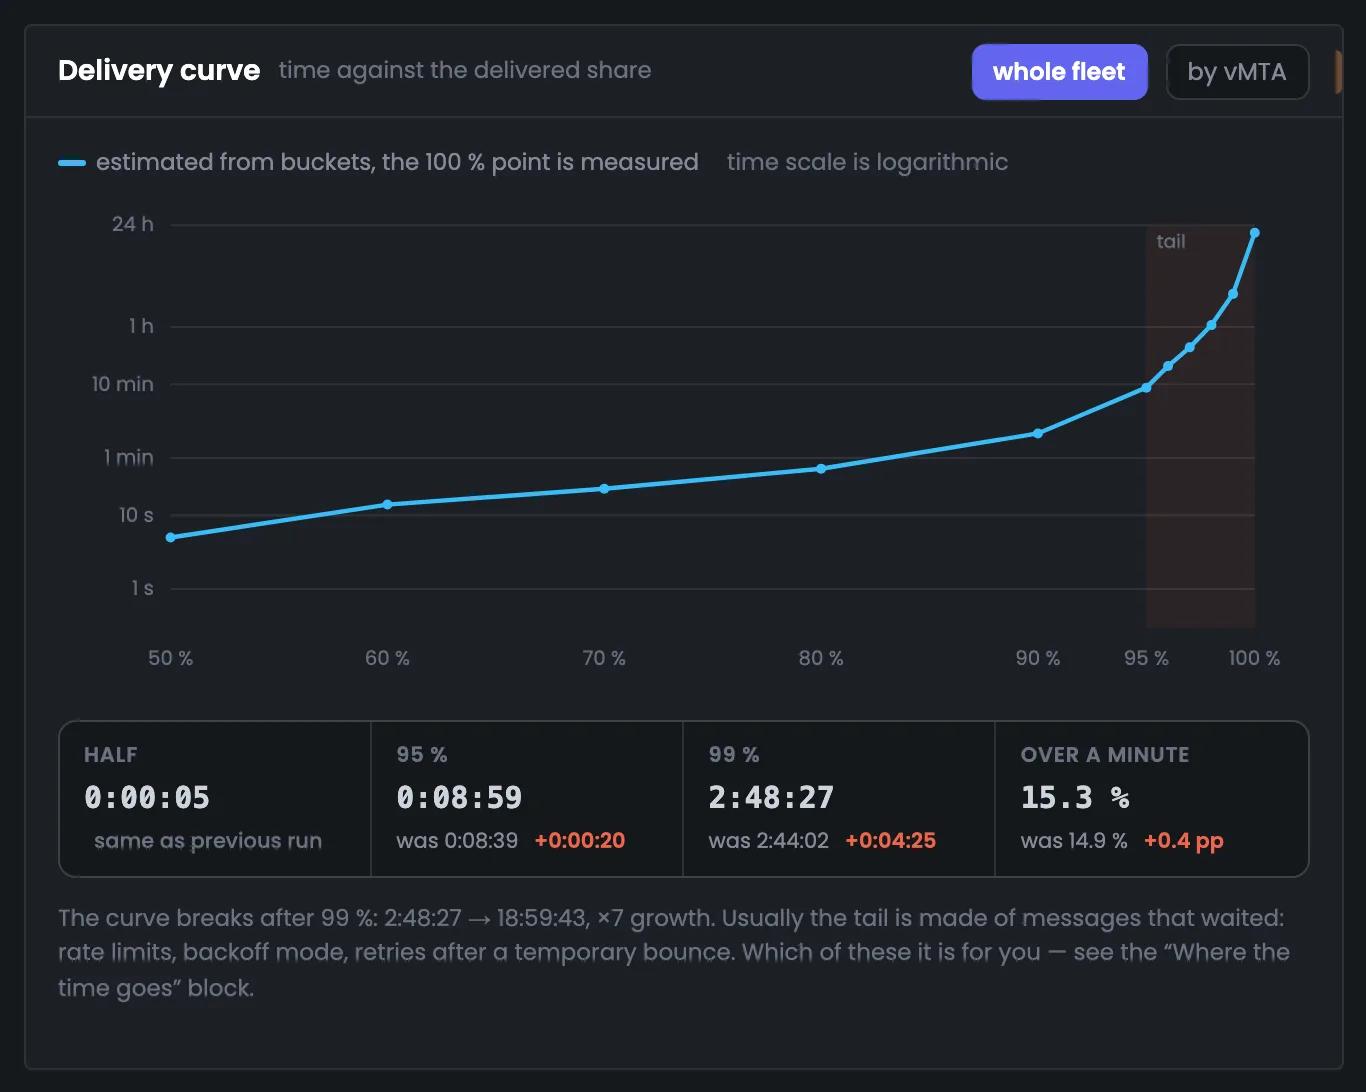
The delivery curve plots time against the share of delivered messages — on a logarithmic scale, from a second to a day. It shows where delivery slows down sharply: in the example the curve shoots up after 99%, and the time grows sevenfold. Under the curve is a comparison with the previous collection, so you notice if things got slower. Usually the slowest are messages that had to wait: a rate limit, backoff mode or retries after a temporary bounce. In the example 95% is 0:08:59 versus 0:08:39 last time, 99% is 2:48:27 versus 2:44:02 — no noticeable change. Which of these causes you have is shown on the “Where the time goes” screen below.
EnlargeScreen 02 · Delivery curve. An example from the MTA-Hub interface.
Line — for all servers — an estimate from intervals.
100% point — measured.
Versus the previous collection — 95% — 0:08:59 versus 0:08:39, 99% — 2:48:27 versus 2:44:02.
Bend — after 99% — seven times longer.
Usually the slowest are messages that had to wait.
03
The curve in numbers
The same curve as a table
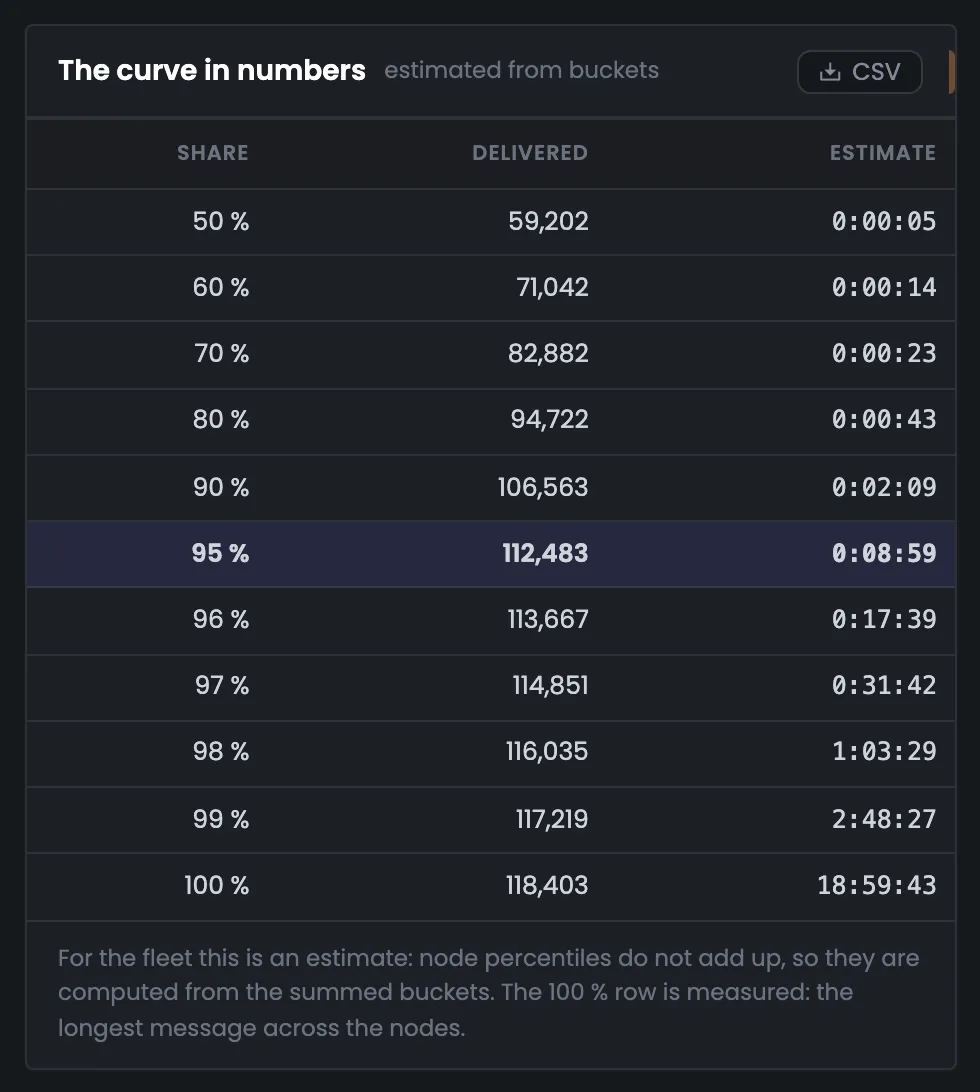
The table is the same delivery curve in numbers, for when you need an exact cutoff: how many messages reached each share and in what time. It's handy to quote in a report or in a conversation with your hosting provider. In the example 50% is 59,202 messages within 0:00:05, 95% is 112,483 messages within 0:08:59, and 100% is all 118,403 messages. For all servers together the shares are estimated and the 100% row is a measurement; for a single server the table is exact, taken from its MTA's report. For a single server the table has two columns: the average time of the messages in that share and its cutoff. Here 90% of messages arrived within 0:02:09, 98% within 1:03:29. If the 95% cutoff grows from one collection to the next, messages have started getting delayed.
EnlargeScreen 03 · The curve in numbers. An example from the MTA-Hub interface.
50% — 59,202 messages within 0:00:05.
90% — 0:02:09.
95% — 112,483 messages within 0:08:59.
98% and 99% — 1:03:29 and 2:48:27.
100% — all 118,403 — the slowest 18:59:43.
For a single server the table is exact, taken from its MTA's report.
04
How many messages arrived within this time
MTA intervals
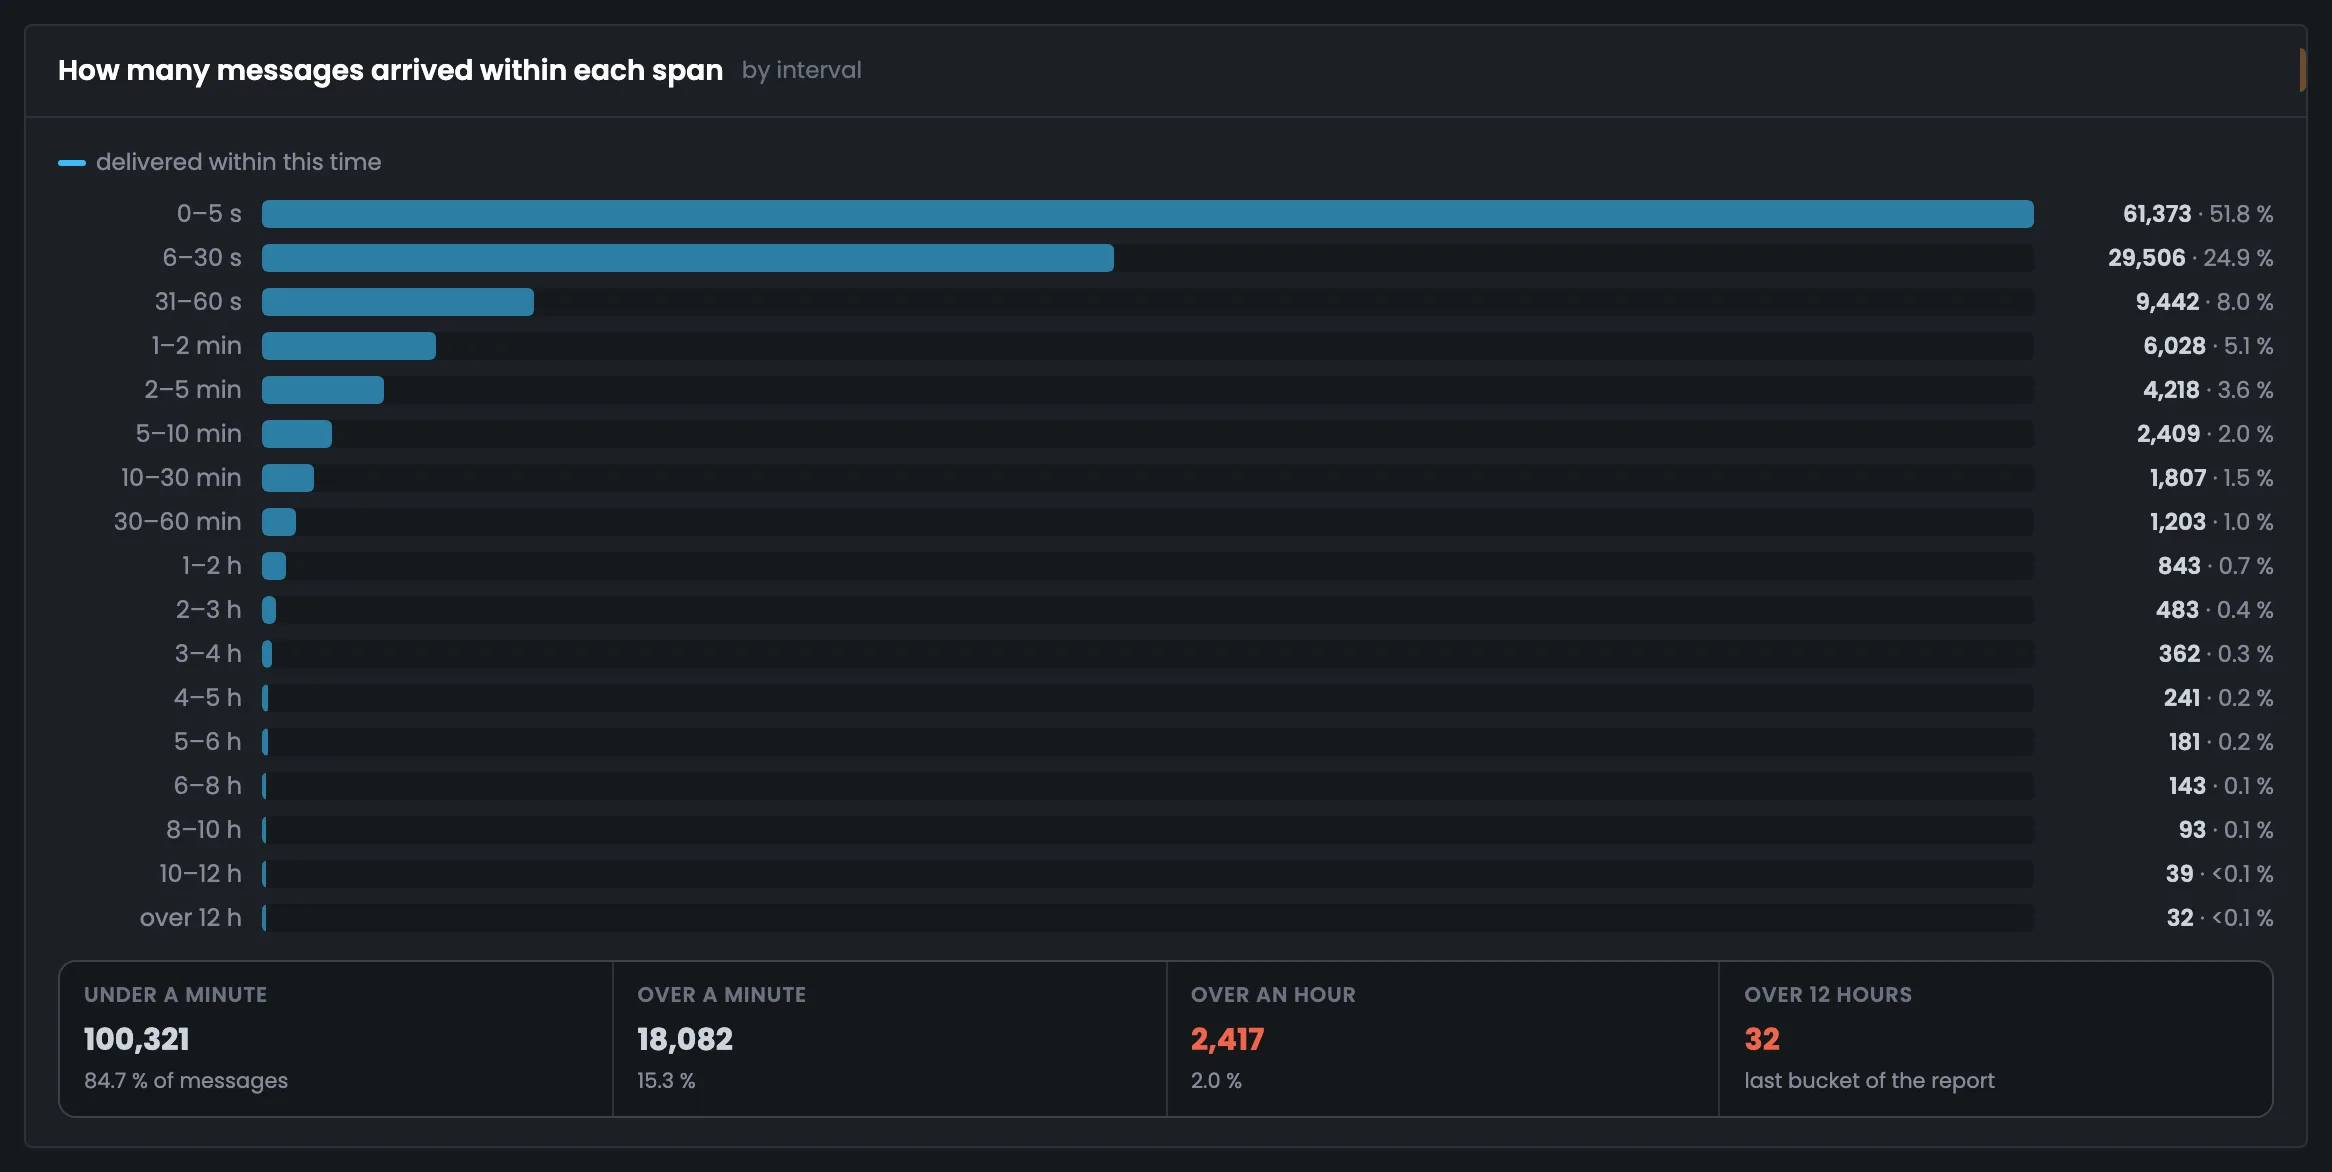
This screen breaks delivery time down into the intervals the MTA itself counts: how many messages arrived within five seconds, within half a minute, within a minute and longer. It's handier than the curve when you need to say what share of messages was delayed. In the example 61,373 messages (51.8%) arrived within five seconds, 84.7% within a minute, 2.0% took over an hour, and 32 messages took over 12 hours. Small intervals are shown as “<0.1%”, not “0.0%”: these are real messages. Another 29,506 messages arrived within half a minute, another 9,442 within a minute, and 18,082 took longer than a minute. If the “over an hour” share grows, check the retries on the “Where the time goes” screen.
EnlargeScreen 04 · How many messages arrived within this time. An example from the MTA-Hub interface.
Within 5 seconds — 61,373 messages — 51.8%.
Within a minute — 100,321 — 84.7%.
Over an hour — 2,417 — 2.0%.
Over 12 hours — 32.
Small intervals — “<0.1%”, not “0.0%”.
Time and speed
2 screens
Next — what a message's time is made of: waiting in the queue, the trip to the mailbox provider's reply and retries after a temporary bounce. Next to it is the highest sending speed of the period, with the server named. These screens answer where exactly the delays happen.
05
Where the time goes
Queue, trip, retries
This screen breaks a message's journey into parts: waiting in the queue before the first attempt, the trip to the mailbox provider's reply and retries after a temporary bounce. It tells you where a delay comes from — your server or the recipient's server. In the example the queue takes 4 seconds on average, the reply 21 seconds, and retries 1:06:17 for 9,473 messages; 92.0% of messages go out on the first attempt. A switch shows the average, 95% or worst time. The most attempts — 9, for that same message to orange.fr that took 18:59:43. The Hub calculates waiting and retries itself with a quick pass over the accounting files: the MTA's report utility doesn't provide them.
EnlargeScreen 05 · Where the time goes. An example from the MTA-Hub interface.
Queue — 4 seconds before the first attempt.
To reply — 21 seconds for 108,930 messages on the first attempt.
Retries — 1:06:17 for 9,473 messages.
Attempts — first — 92.0%, second — 4.5%, later — 3.5%; the most — 9.
The switch — average, 95% or worst.
06
Best window of the period
The highest speed
The best window is the highest sending speed of the period, by number of messages and by volume. The Hub finds it across every record of the accounting file, not by whole clock hours, so a short burst doesn't get averaged away. The screen shows how many messages a server pushes through at its peak. In the example the best by messages is tx-02 on the evening of Oct 21: 23 in a minute, 566 in an hour; by volume — tx-01 with 15.0 MB in an hour. Server peaks don't add up, so the server is always named. By volume tx-01 also has 10.2 KB/s for a minute. The same best-window search is on the statistics overview — there it's shown as the week's peak load.
EnlargeScreen 06 · Best window of the period. An example from the MTA-Hub interface.
By messages — tx-02 on the evening of Oct 21 — 23 in a minute at 23:29, 75 in five minutes, 566 in an hour.
By volume — tx-01 — 10.2 KB/s for a minute, 15.0 MB in an hour.
Server peaks don't add up — for all servers together the screen shows the best stretch of a single server and names it.
Who's slow
1 screen
At the bottom — who's holding messages up: recipient domains by average delivery time, and with a switch, sending points and servers. Domains with just a couple of messages are marked “few messages” and don't rise to the top. This shows which recipients and which addresses your messages take longest to reach.
07
Who replies slowly
Domains by average time
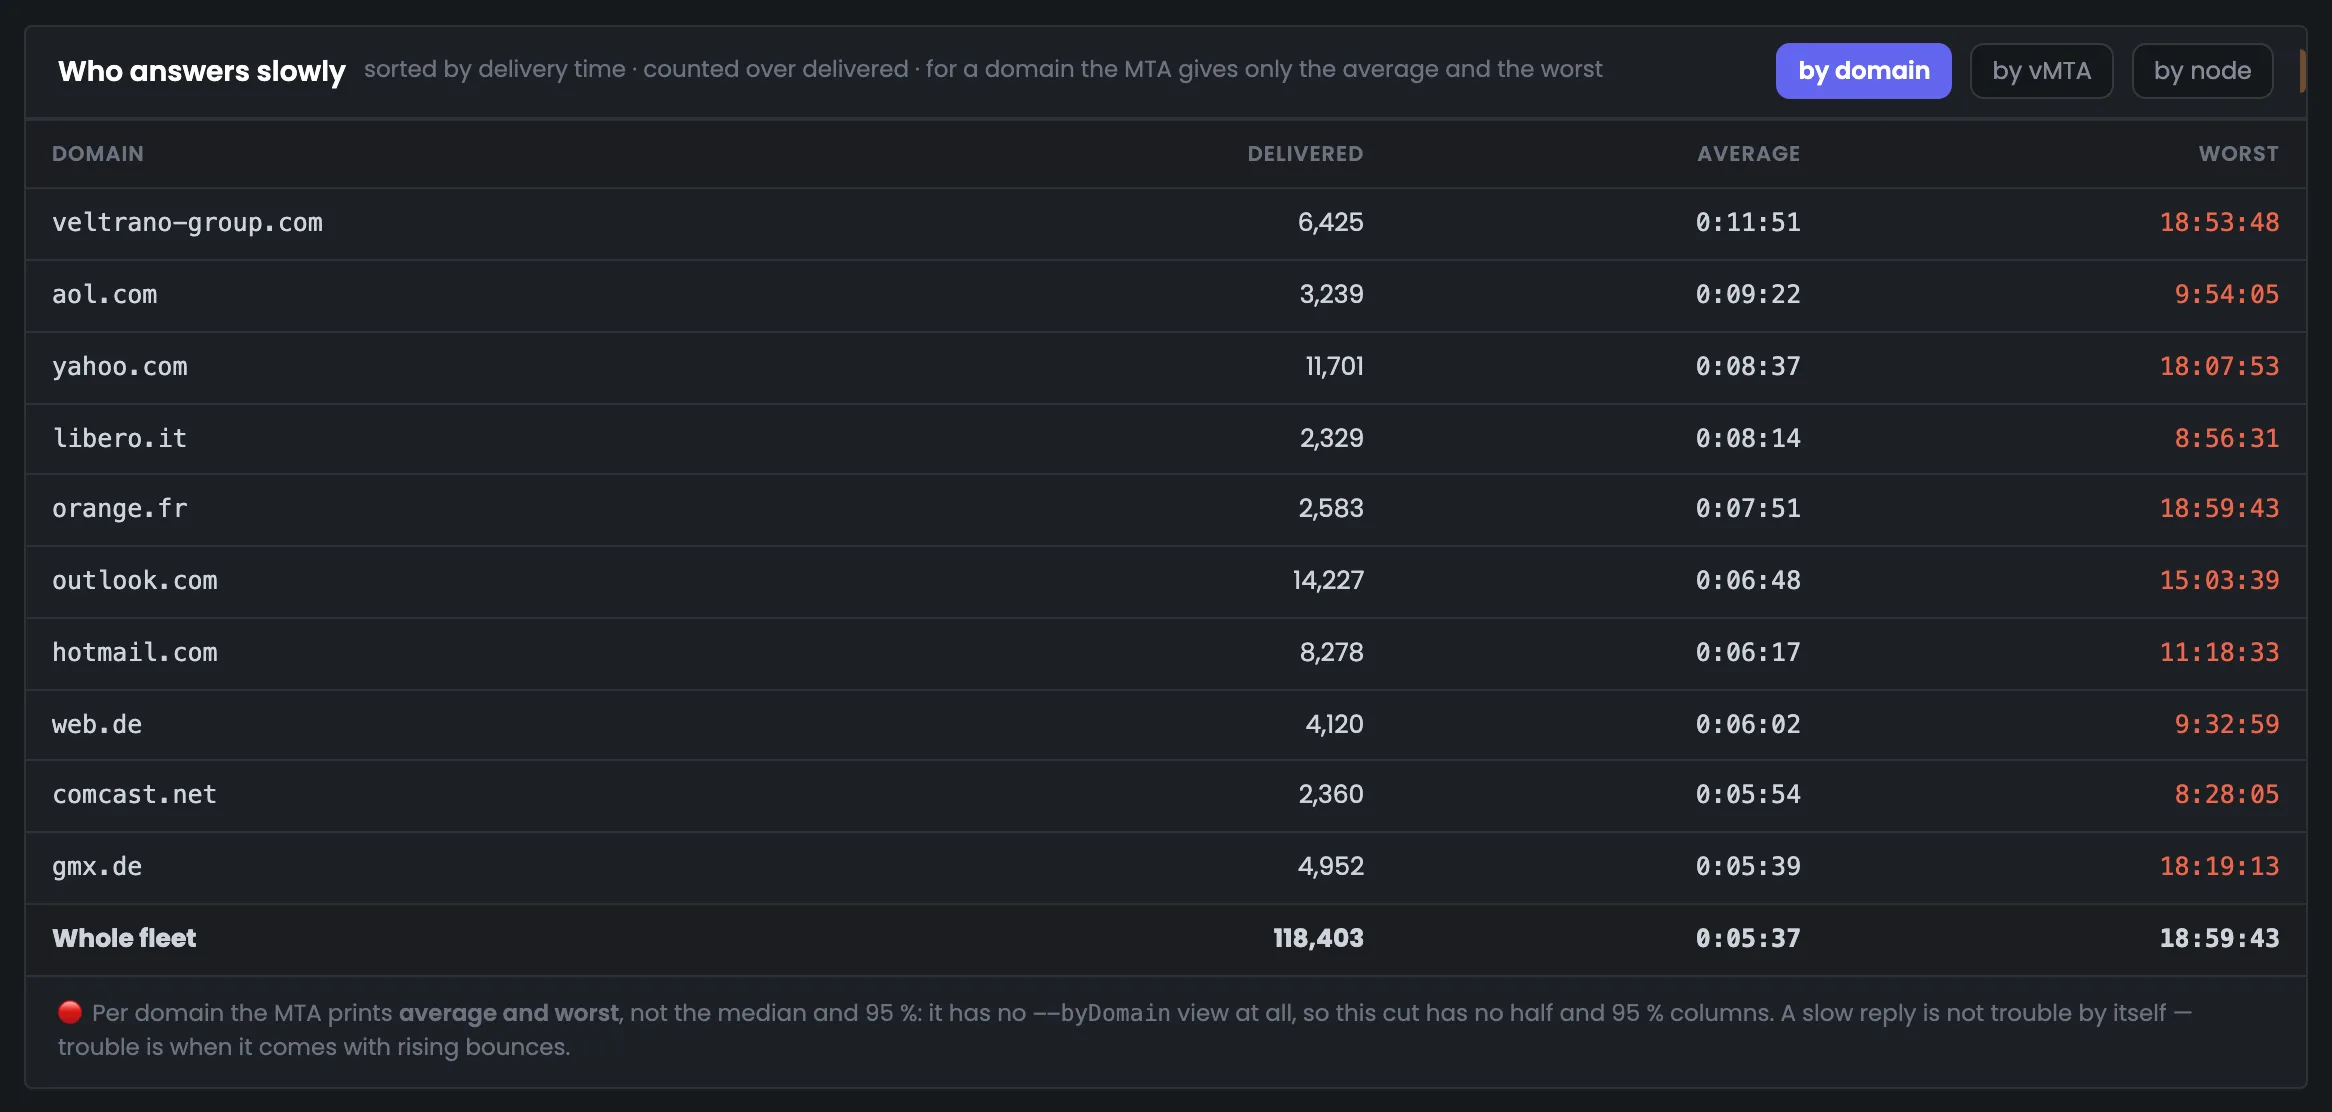
The table shows recipient domains by average delivery time — who your messages take longest to reach. It helps you tell a general problem from a problem with one mailbox provider. In the example messages to the corporate veltrano-group.com take the longest — 0:11:51 versus 0:05:37 on average across all servers, followed by aol.com, yahoo.com and libero.it. A switch shows the same data by vMTA and by node — with the half, 95% and the share of messages over a minute. A domain with just a couple of messages is marked “few messages” and doesn't rank above domains with real volume. Per domain the MTA only gives the average and worst time; the full domain profile is on the “Domains” tab.
EnlargeScreen 07 · Who replies slowly. An example from the MTA-Hub interface.
veltrano-group.com — 0:11:51 across 6,425 messages.
aol.com — 0:09:22.
libero.it — 0:08:14.
yahoo.com — 0:08:37 across 11,701 messages.
All servers — 0:05:37 on average.
The “by vMTA” and “by node” views — with the switch.
06 / Questions about speed
Frequently asked questions about email delivery speed.
In short: why the curve is more honest than the average and where the numbers come from.